Most pupils achieving top GCSE grades progress to higher education. Having strong GCSE grades provides students with a competitive edge when applying to higher education institutions, with universities often considering GCSE grades alongside A-level results, personal statements, and various other factors, during their admission processes. However, not all students with strong GCSE grades progress to higher education. Some will follow further education pathways, such as apprenticeships or higher technical qualifications in colleges. Others will avoid higher education for financial or social reasons[i].
These factors are unlikely to affect people coming from different backgrounds equally. This analysis investigates the likelihood of pupils with high attainment at GCSE level progressing to higher education, and how this varies by gender, disadvantage, school type, and English region.
We define high-attaining pupils as those who were awarded A or A* in both English and Mathematics GCSE. As students often do not enter Higher Education (HE) straight after finishing their secondary education, we consider students as having progressed to higher education if they appeared in the Higher Education Statistics Agency (HESA) student database by the time they were 25. HESA data contains all students enrolled in any course of level 4 or above. We focus on students from the 2013 GCSE cohort as that cohort would have turned 25 in 2022, the latest available year for HESA data. We focus on the percentage of students not entering HE, rather than those entering HE, as analysing students who take the less common path of not progressing into HE may give us more insight into issues surrounding access and inequality.
Figure 1: Percentage of GCSE high attainers who enter higher education
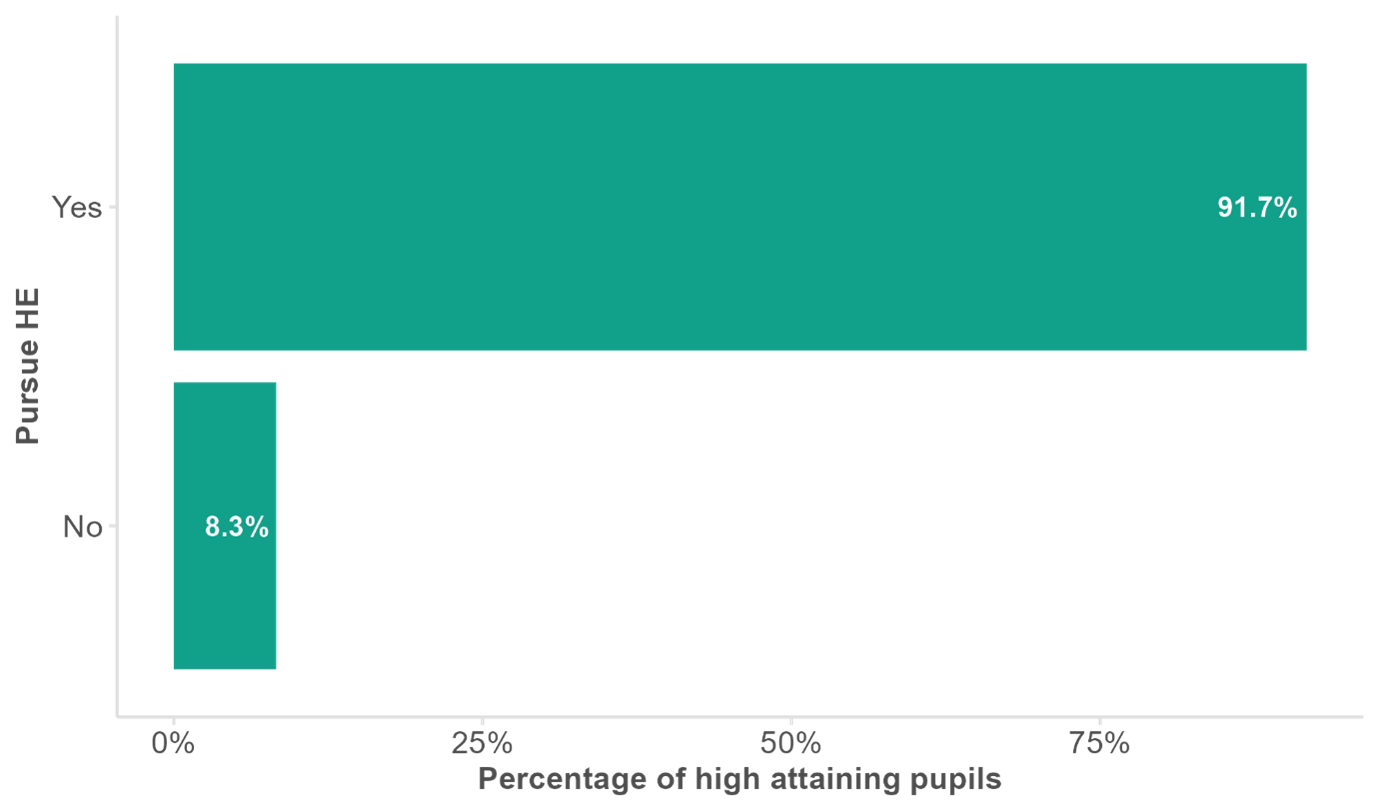
The overwhelming majority of pupils who were awarded A or A* in English and Maths entered higher education. Figure 1 shows that 91.7 per cent of top attaining GCSE students, equating to 60,900 pupils, appeared in the HESA data by the time they were 25. Only 8.3 per cent, or 5,500 students, did not progress to higher education. However, as the following figures show, these proportions vary by students’ characteristics.
Figure 2: Percentage of GCSE high attainers who do not enter higher education, by gender
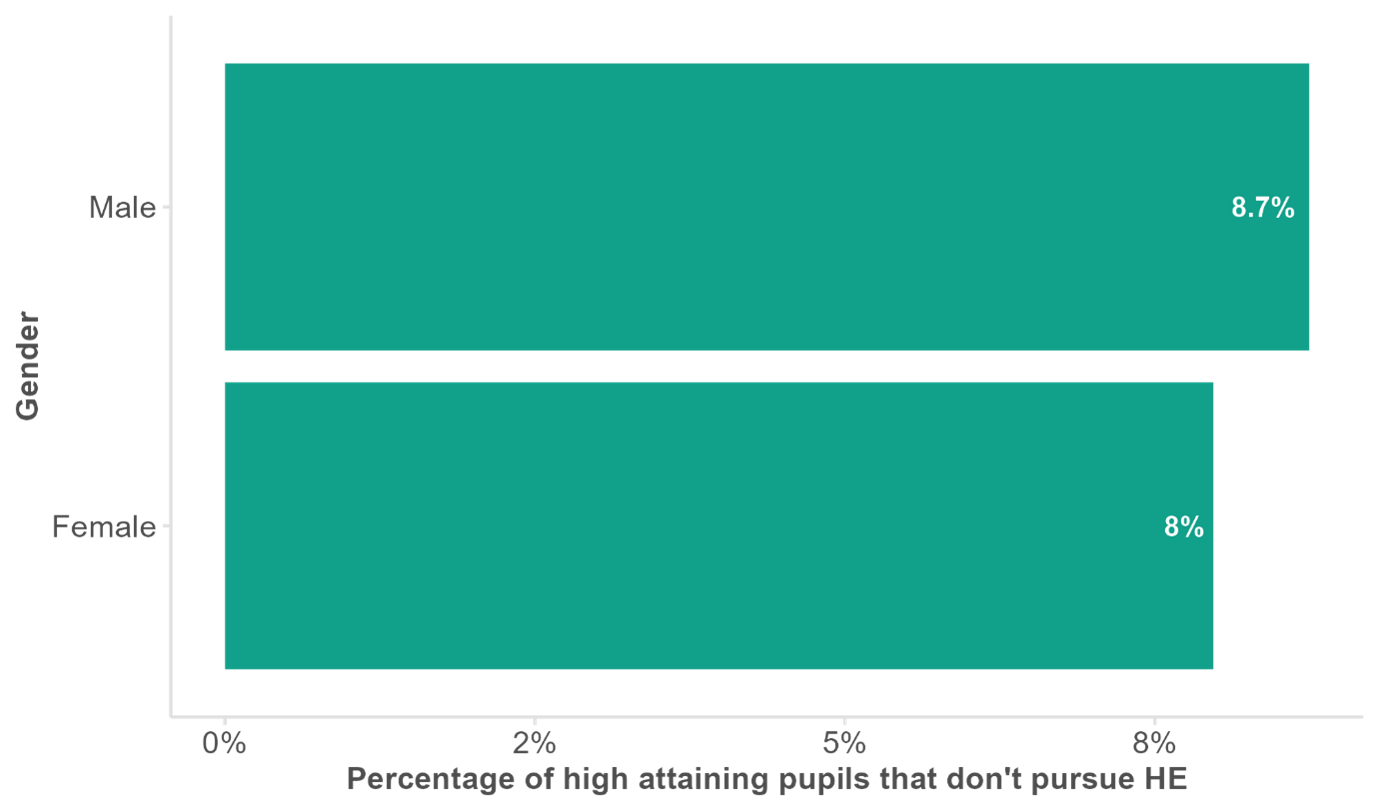
Historically, female students outperform their male counterparts both at key stage 4 and key stage 5[ii]. Figure 2 shows how this trend is also reflected in the percentage of high-attaining GCSE students that do not end up progressing into HE by the time they are 25, with 8 per cent of female students not going to HE, compared with 8.7 per cent of male students.
Figure 3: Percentage of GCSE high attainers who do not enter higher education, by disadvantage status
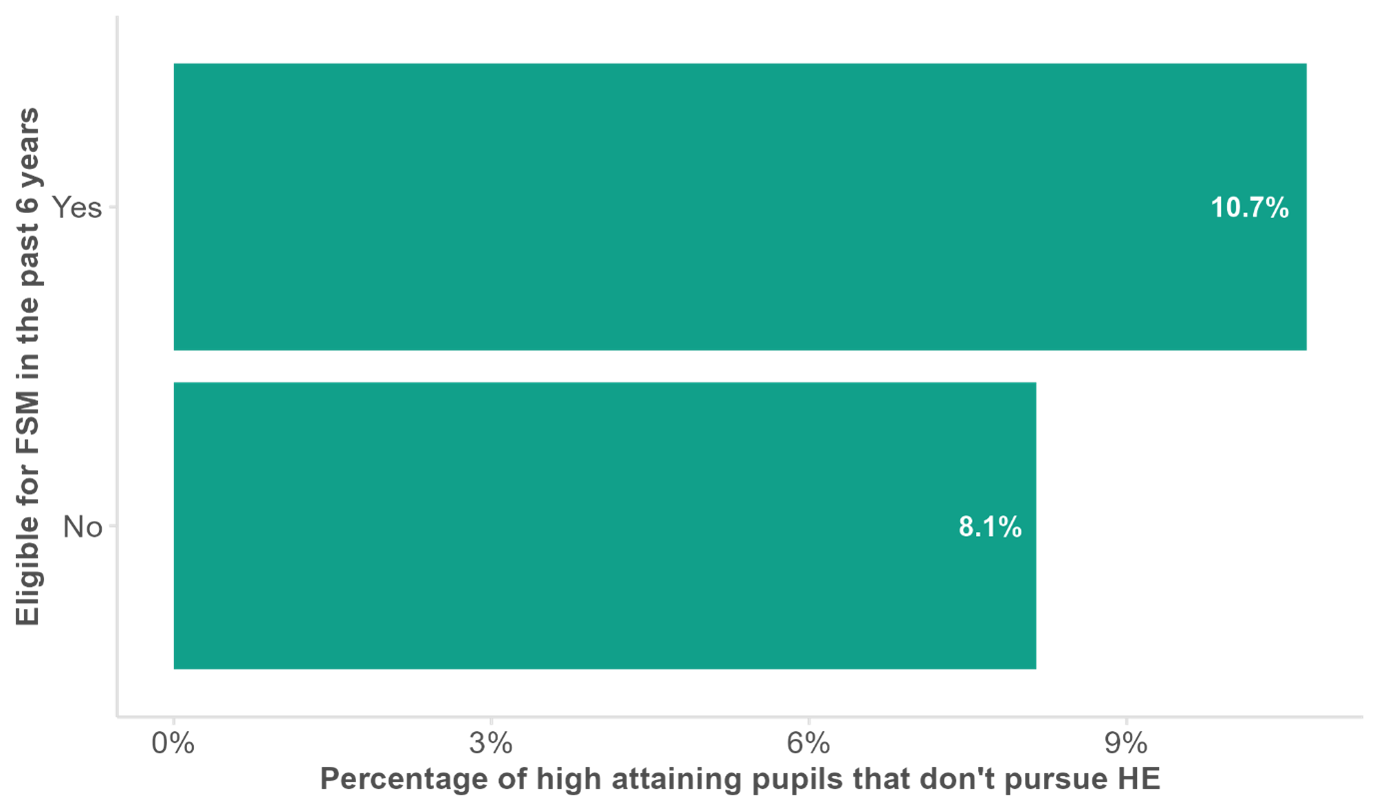
EPI’s research has repeatedly highlighted how disadvantaged students fall behind their peers[iii] at different points in their education. Correspondingly, figure 3 reveals a sizeable difference between disadvantaged students, here defined as being eligible for free school meals in any of the six years prior to 2013, and their high-attaining peers. We find that 8.1 per cent of non-disadvantaged pupils with high GCSE grades do not enter HE, compared with 10.7 per cent among students eligible for the pupil premium.
Figure 4: Percentage of GCSE high attainers who do not enter higher education, by school type[1]
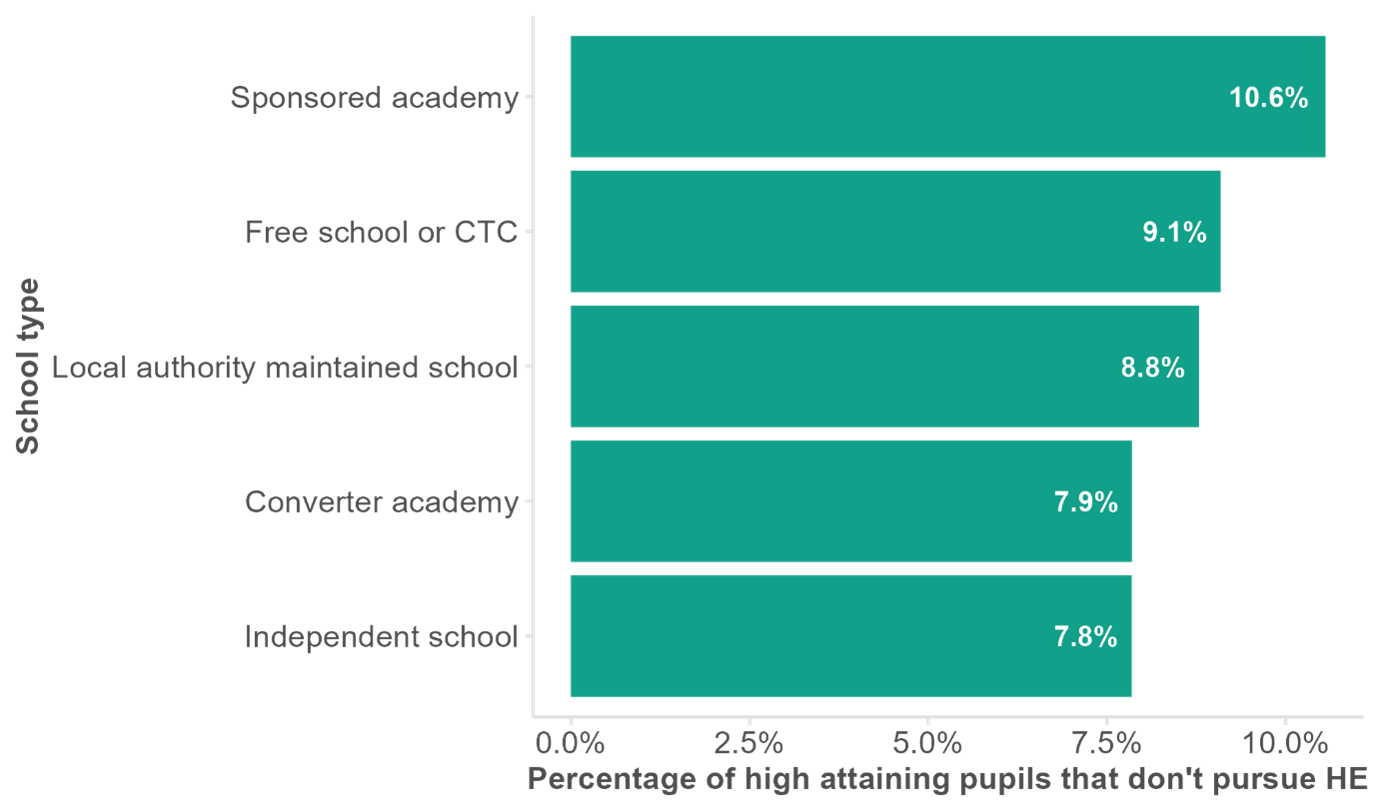
The proportion of high-attaining students not entering HE, by school type, reveals that students who completed their GCSEs in independent schools or converter academies are more likely to progress to HE compared to all other school types. Respectively, only 7.8 and 7.9 per cent of these students do not appear in the HESA data, compared with 8.8 and 9.1 per cent for local authority-maintained schools and free schools or CTCs, and 10.6 per cent for sponsored academies. It is worth noting that schools with the highest proportions of high attaining pupils not going into HE are usually those with a higher percentage of pupils eligible for free school meals. This suggests that it could be the higher concentration of disadvantaged pupils driving differences here, rather than the governance model of the school.
Figure 5: Percentage of GCSE high attainers who do not enter higher education, by English region
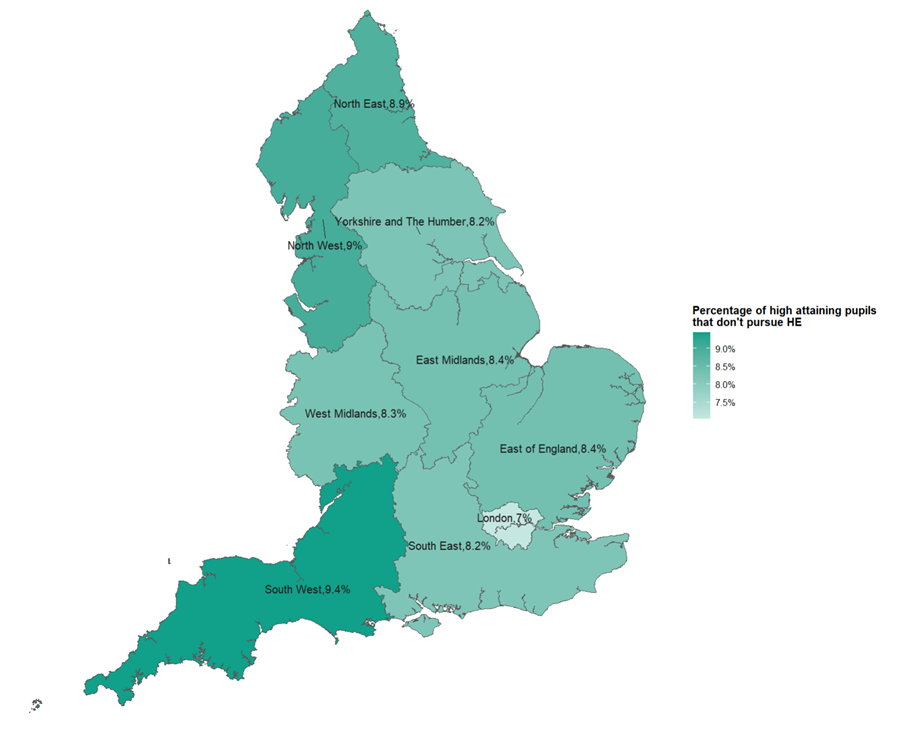
Results in GCSEs and subsequent qualifications are known to vary by region[iv], and these differences persist when looking at the proportion of top-performing students progressing to HE. Pupils who sat their GCSE exams in London schools are more likely to enter HE than in any other region. Only 7 per cent of high-attaining London students do not end up in HE, compared with 8.2 per cent in the South East (second region), and with 9.0 and 9.4 per cent in the North West and South West respectively (the two regions with the highest percentage). We can notice how regions which typically have higher attainment at level 2 and level 3 qualifications, such as London and the South East[v], are among the regions with the lowest percentage of high attaining pupils not entering HE. On the other hand, regions with lower average grades are among those with a high percentage, such as the North West and the North East.
Figure 6: Percentage of GCSE high attainers who do not enter higher education, by local authority
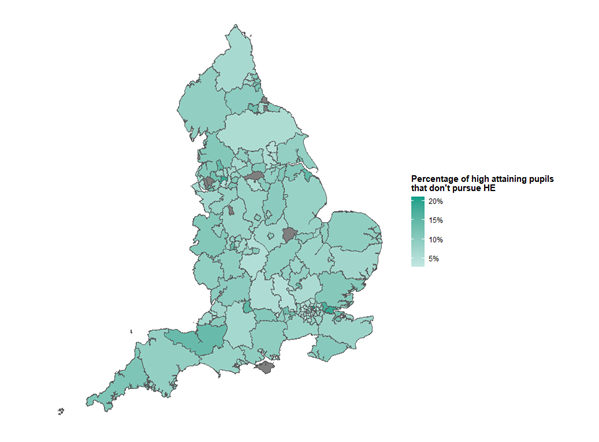
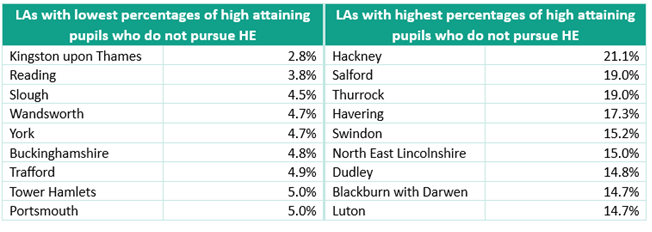
Figure 6 shows results by local authority. The London borough of Hackney has the highest percentage of high-attaining pupils not entering HE in the country at 21.1 per cent, compared with an average of 7.0 per cent across the whole of London. Hackney is closely followed by Salford and Thurrock, both with 19.0 per cent of high attainers not pursuing HE. Havering, with 17.3 per cent, is the only other London borough which stands out as having a much higher percentage than the regional average. On the other hand, the smallest percentages nationally were in Kingston upon Thames, Reading, and Slough, at 2.8, 3.8, and 4.5 per cent respectively. Students in these boroughs also typically achieve higher grades than the national average[vi].
Overall, this analysis has highlighted how most high performing GCSE students end up progressing to higher education. However, this is not uniformly the case across different demographics, with girls, disadvantaged students and those in the North West and South West less likely to go to university, even with high GCSE grades. London is also unusual in having boroughs with the highest and lowest proportions of high attainers not progressing to higher education.
The gap varies across these groups. The gender gap is relatively narrow, with a 0.7 percentage-point difference between girls and boys, compared with the disadvantage gap, where the difference between pupils eligible for FSM and their peers is 2.6 percentage points. Differences between regions are similar in size to the differences between school types, although the biggest gap in the latter group – 2.8 percentage points between independent schools and sponsored academies – is larger than the 2.4 percentage-point difference between London and the South West.
There are likely a range of reasons why these students end up not entering higher education. Broadly, there will be students who make an informed decision to follow another path, and those who might have benefited from higher education, but encounter social or economic barriers to progression. The first group of students might opt to pursue a different education path, such as apprenticeships or higher technical qualifications, to enter a family business or a job opportunity valued more than starting a degree. The second group of students includes young people who encounter real or perceived financial barriers, for example through insufficient support for their living cost during their studies, aversion to student debt, or the need to enter the workforce as soon as possible to secure an income. It will also include those students who encounter social barriers, such as a feeling that university is not for them, or those whose personal circumstances mean that they are unable to progress, including young carers, or those suffering from poorer mental health. Finally, it may also include those students who attained well at 16, but for some reason struggled during their 16-18 education. Although our analysis does not tell us how many of the 8.3 per cent of high attainers who do not pursue HE made a positive choice to follow another pathway, breakdowns by characteristics shed light on factors that might play a role in a student’s career path.
This work contains statistical data from ONS which is Crown Copyright. The use of the ONS statistical data in this work does not imply the endorsement of the ONS in relation to the interpretation or analysis of the statistical data. This work uses research datasets which may not exactly reproduce National Statistics aggregates.
Appendix
Table 1: Percentage of GCSE high attainers who do not enter higher education, by local authority1
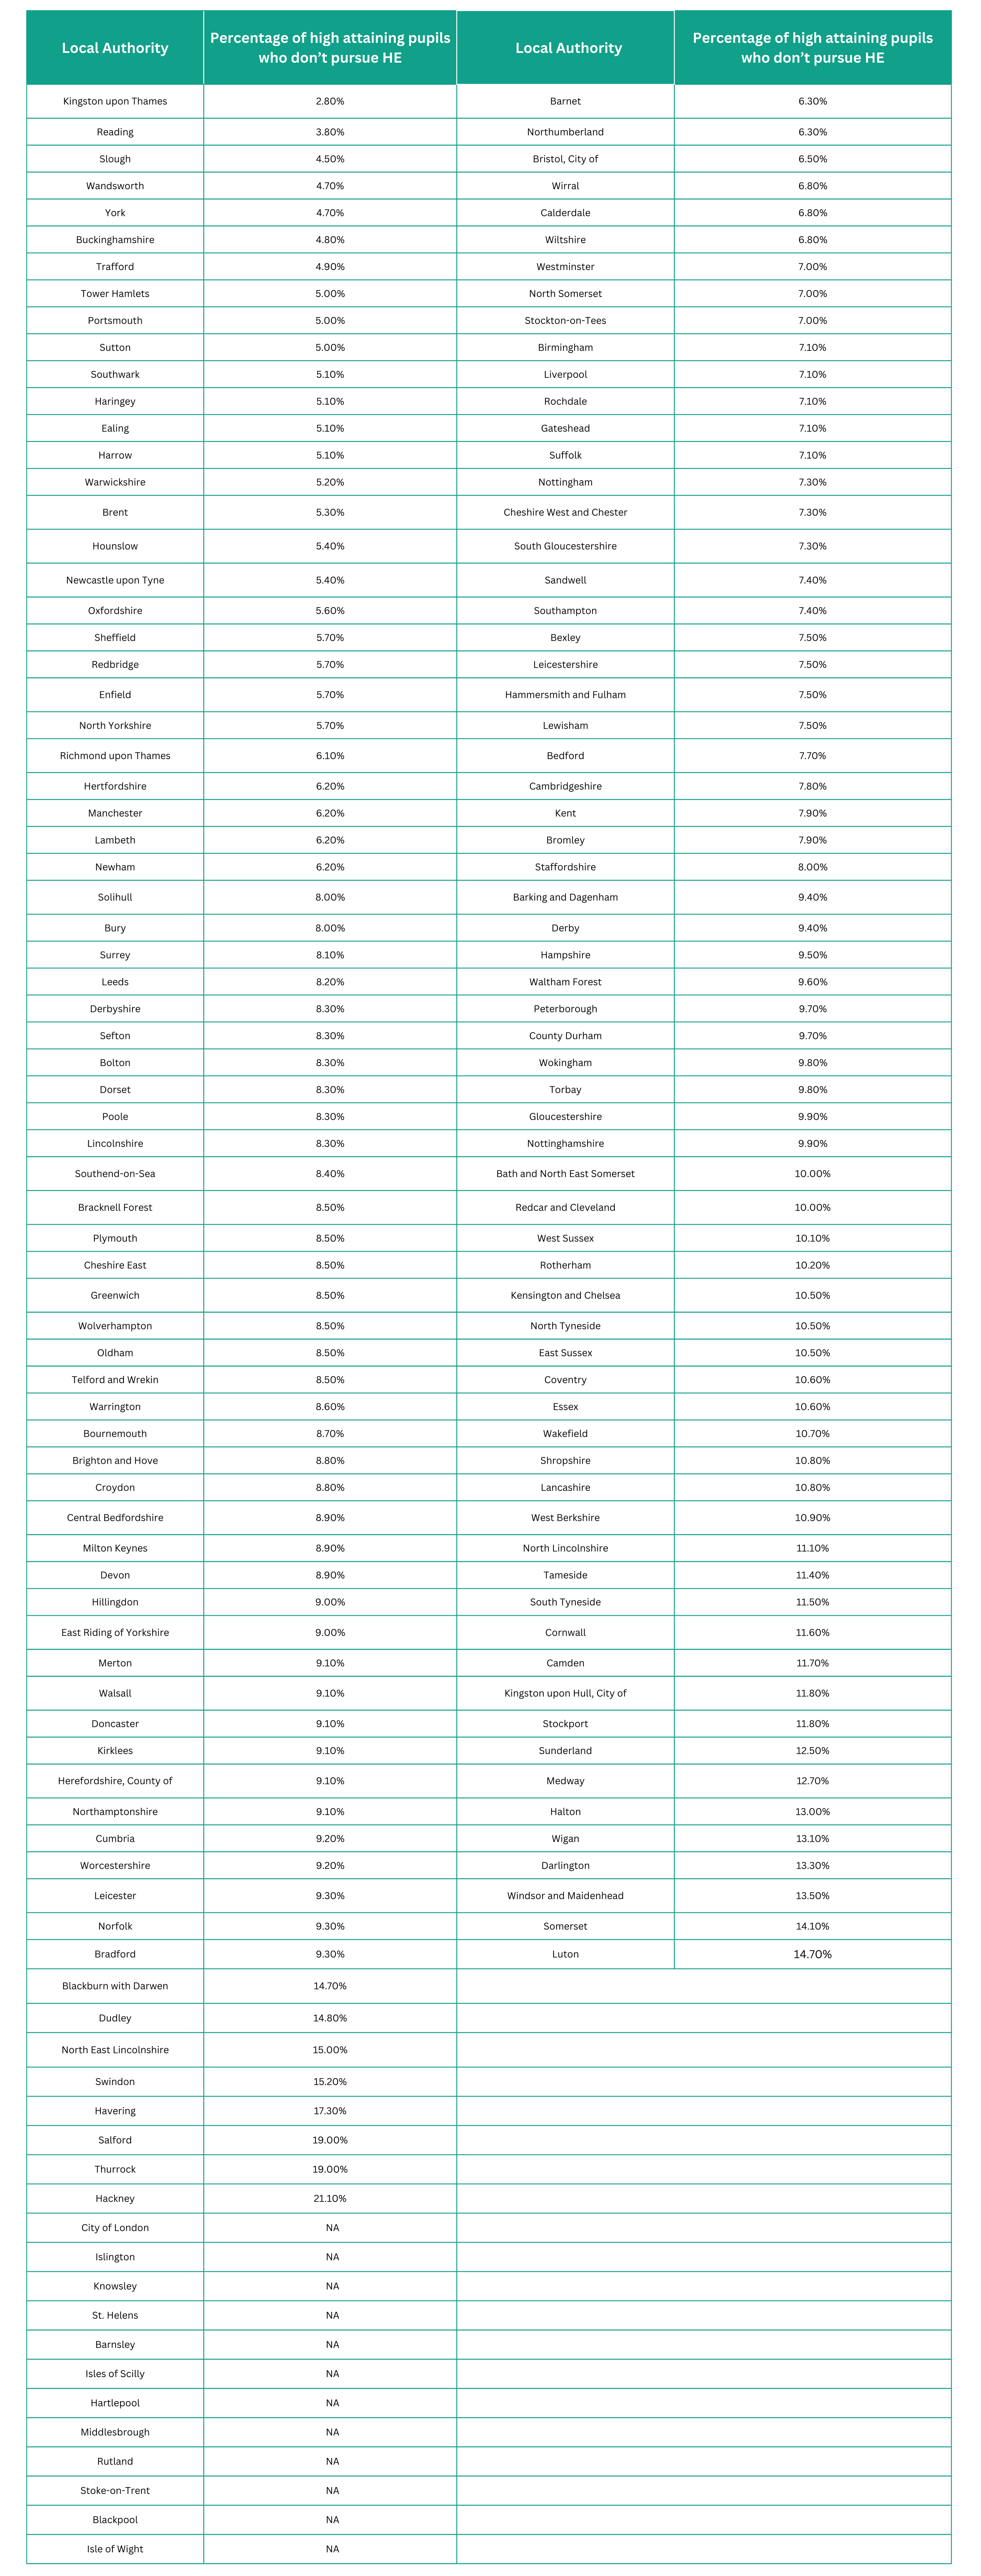
1 – Some of the breakdowns in this table are not available (NA) because they were suppressed due to low student counts.
