After three years of grading directly affected by the pandemic, 2023 marked the first year where A level, technical and vocational qualifications were set to return to roughly pre-pandemic levels. Most students completing their 16-19 study in 2023 will not have sat a formal exam before this year, as they were awarded teacher assessed GCSE grades in 2021. Entries for A levels in 2023 were higher than ever, likely to be explained by an increase in the size of the 18-year-old population and by the record levels of high GCSE grades registered in 2021, which may have influenced students course decisions.
There were almost 800,000 A levels awarded in 2023 and 255,000 certificates awarded in the vocational and technical qualifications (of those reported in the official performance tables).
Although this year’s exams returned to pre-pandemic grading, the government have included a protection mechanism to account for the severe disruption that the students have faced during recent years. The protection mechanism assists students by adjusting grades upwards in subjects where national performance was lower than pre-pandemic levels. It is currently unclear to what extent this affected grading in 2023.
FIGURE 1: A level grade distribution by year
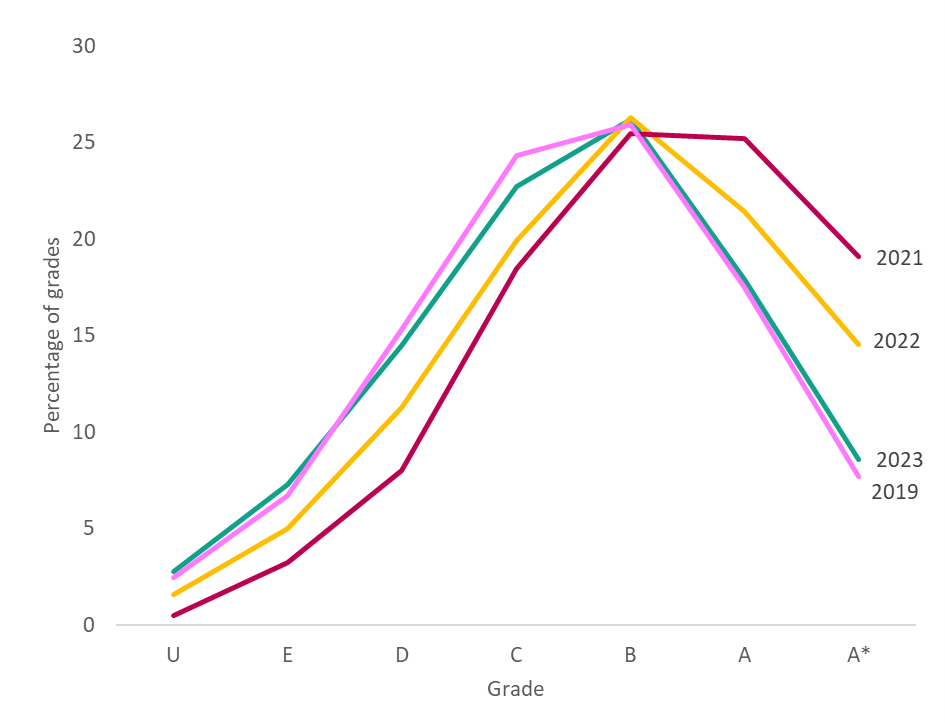
Figure 1 shows that, as expected, the 2023 grading distribution is more closely aligned with that of 2019. 26.5 per cent of entries were awarded an A or A* in 2023, compared with 25.2 per cent in 2019, and 35.9 per cent in 2022, confirming the gradual return to pre-pandemic standards. In both 2019 and 2023, three quarters of entries were awarded a C grade or above. There are slight differences when looking at grades awarded B or above compared to 2019, however it is usual to observe small differences year on year.
FIGURE 2: Proportion of A level entries awarded top grades, by English region
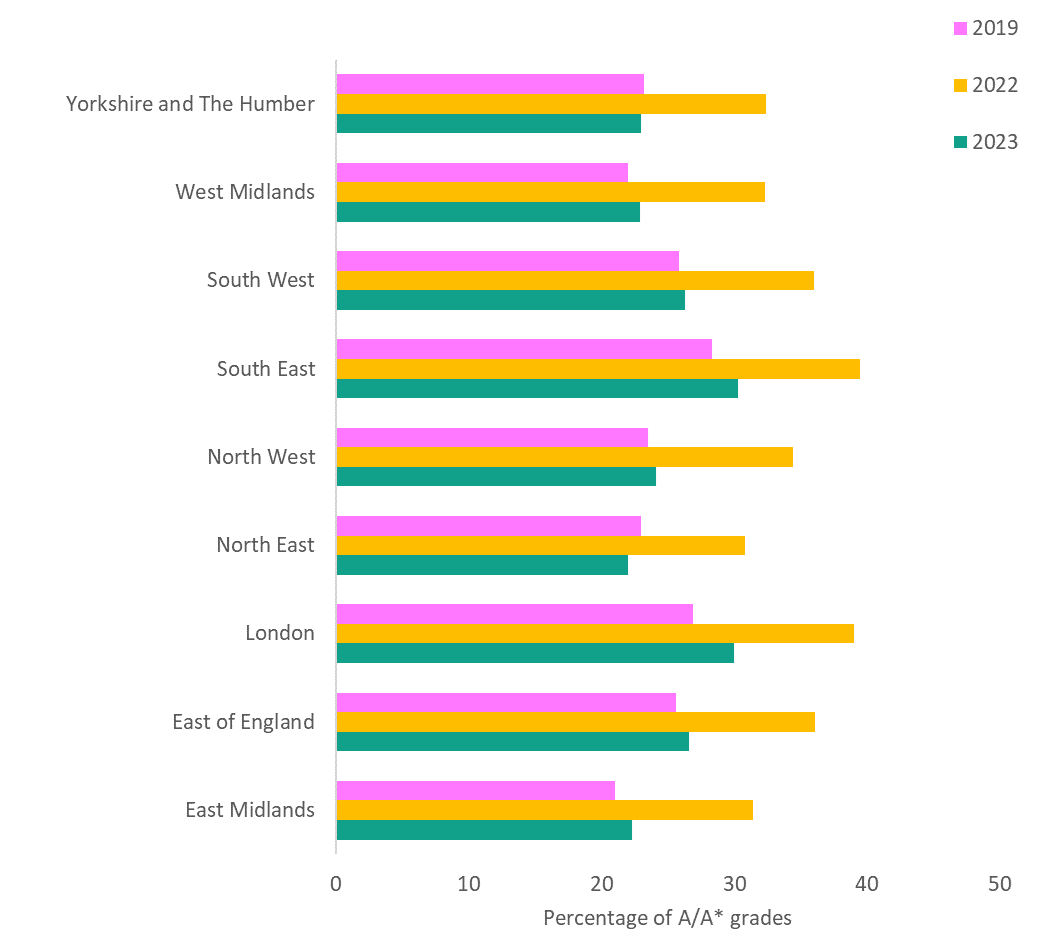
Figure 2 shows that although at a national level, grades returned to roughly pre-pandemic levels, there was significant variation across the regions. Compared with 2019 a lower proportion of A or A* grades were awarded in Yorkshire and The Humber, where the share of top grades decreased from 23.2 to 23 per cent, and the North East, where the share decreased from 23 to 22 per cent. In all other regions the proportion awarded top grades increased, with an increase in London of 3 per centage points. Looking at the overall picture, the gap between the North and the South has increased compared to the pre-pandemic level, suggesting that the pandemic might have contributed to the increase in the gap between the least and most disadvantaged parts of the country.
FIGURE 3: Proportion of A level entries awarded top grades, by centre type
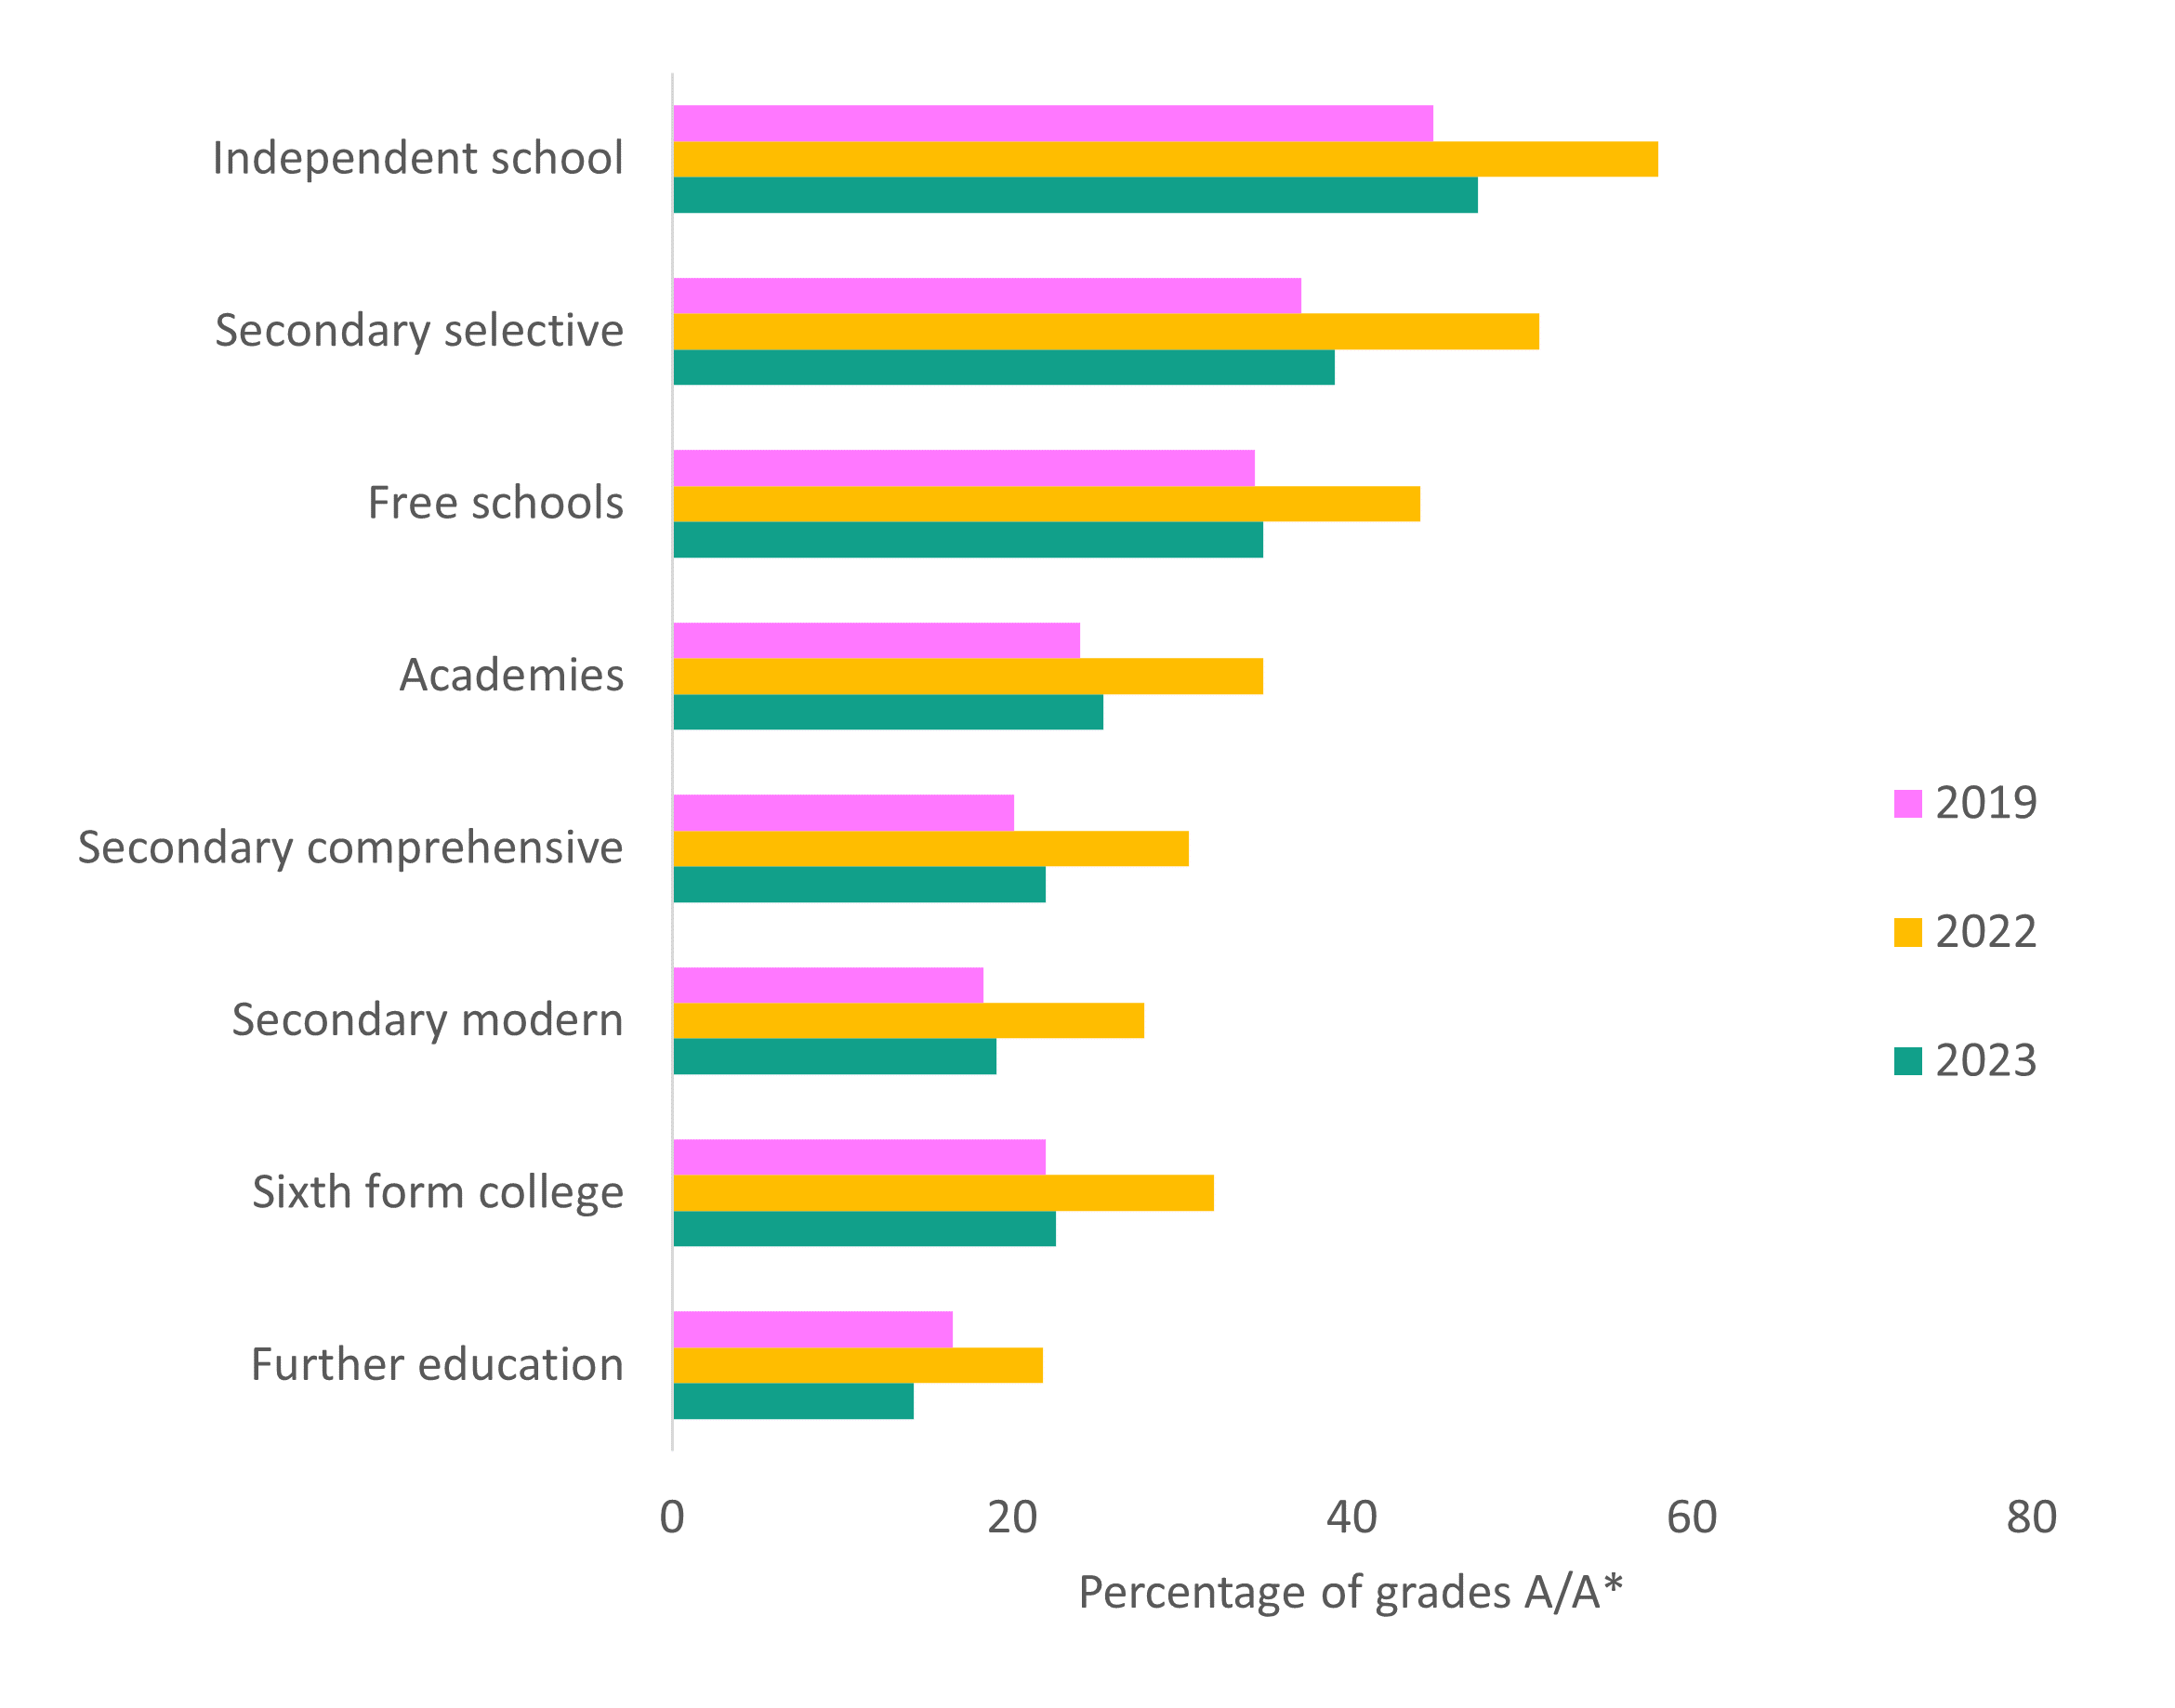
Figure 3 shows a breakdown of the proportion of students achieving A or A* grades by centre type. For most types, the proportion of top grades is lower than last year’s, but above that of 2019. However, in further education establishments the proportion of top grades decreased from 16.5 per cent in 2019 to 14.2 per cent in 2023. This might be due to greater learning losses in the further education sector, which serves a higher proportion of disadvantage students, as a result of the pandemic and the likely higher levels of absences since then. Independent and secondary selective (grammar) schools, which both tend to take on a much lower proportion of disadvantaged students, have seen the biggest increases compared with 2019, with a 2.6 and 2.0 percentage point increases respectively.
FIGURE 4: Male v female grade increases compared to 2019
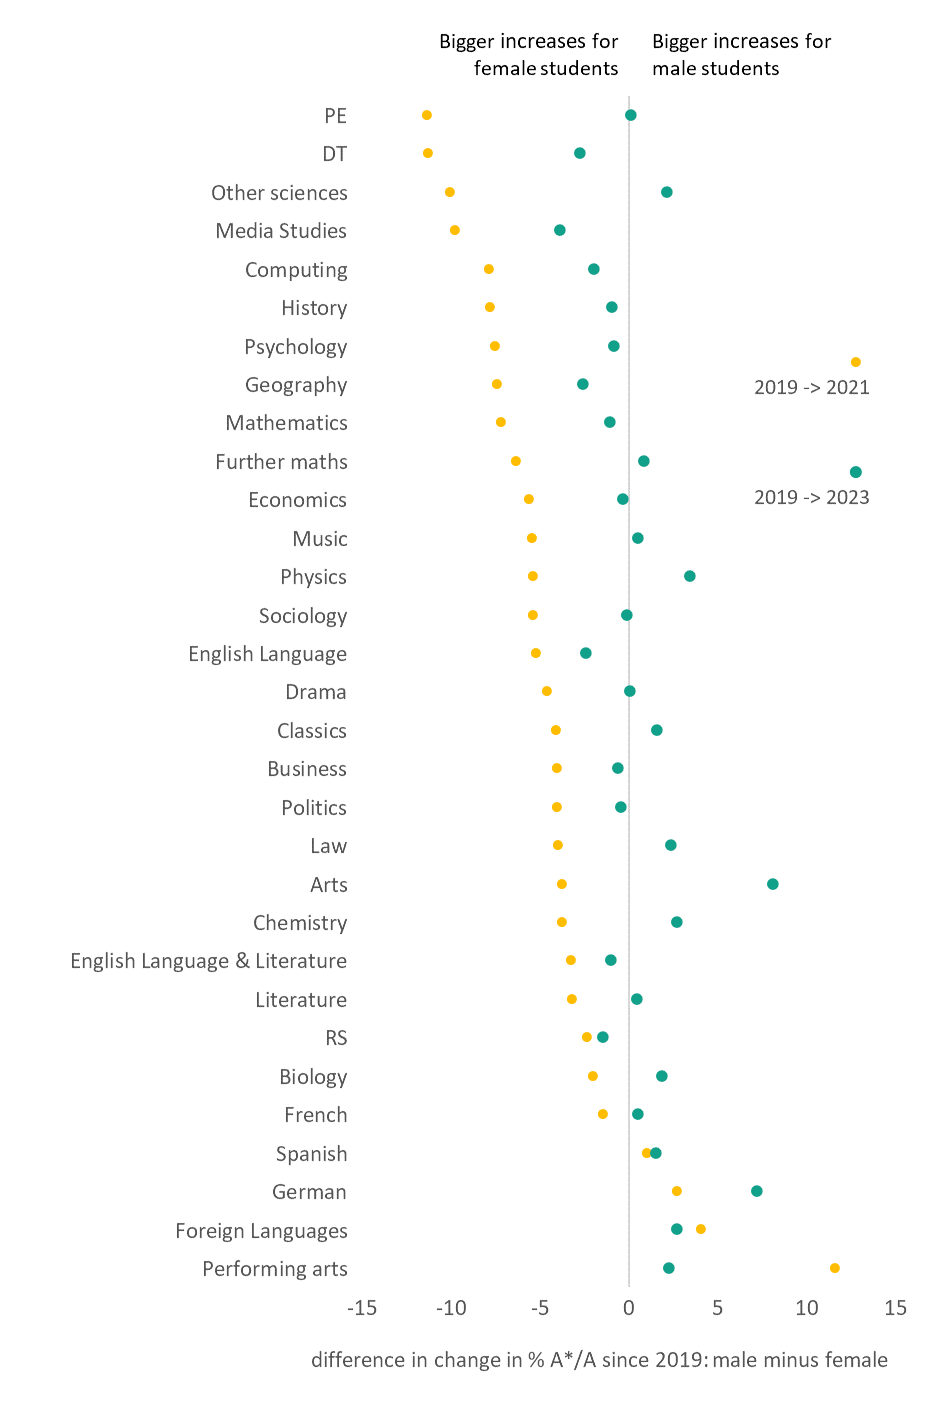
As we can see from Figure 4, female students saw bigger increases in top grades than male students among most subjects with teacher-assessed grades in 2021. This is likely because, as research suggests, final exams tend to favour male students relative to female students. Correspondingly, the return to exams in 2023 saw male students close the gap that had become wider during the pandemic. Most subjects have seen the pandemic trend reversed, with a more even split in grade improvements across male and female students compared with 2022.
FIGURE 5: The A level gender gap: attainment and entries in 2023
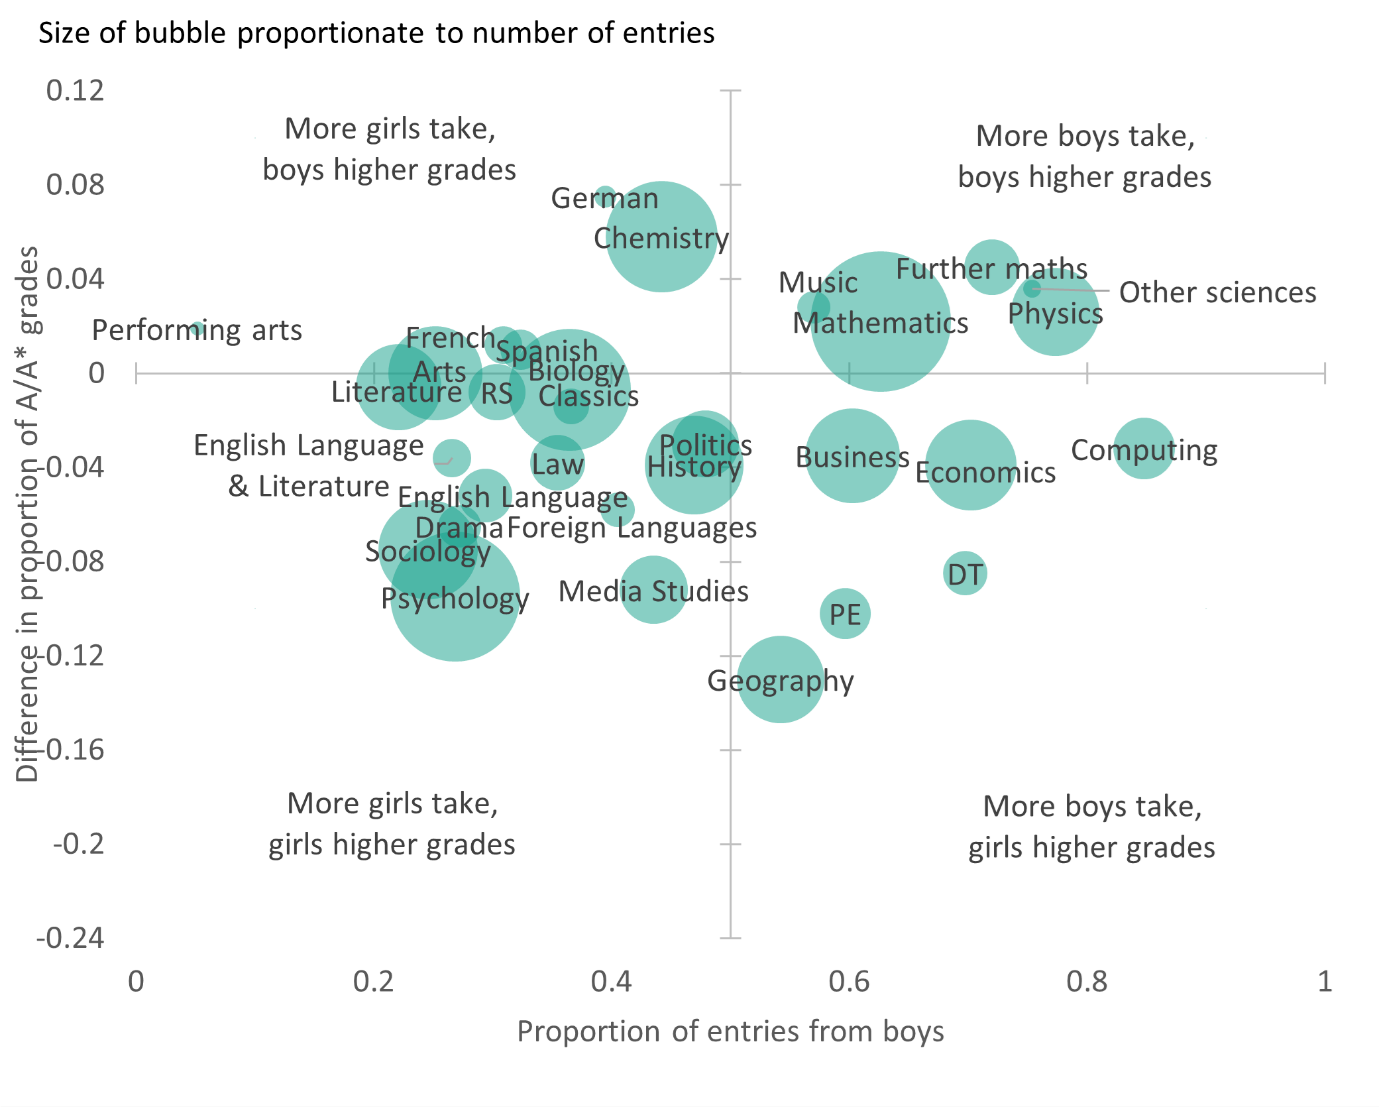
Figure 5 shows that the subjects most commonly entered by male students are not necessarily the ones where they achieve higher grades, and vice versa. The top left and bottom right quadrants show the subject areas where this is the case. Contrary to 2022, this year has seen boys outperform girls in the percentage of top grades in mathematics, physics, and other sciences. However, girls are still outperforming boys in the majority of subjects (22 out of 31).
FIGURE 6: Completion rates of T levels compared with rates for existing alternatives to A levels
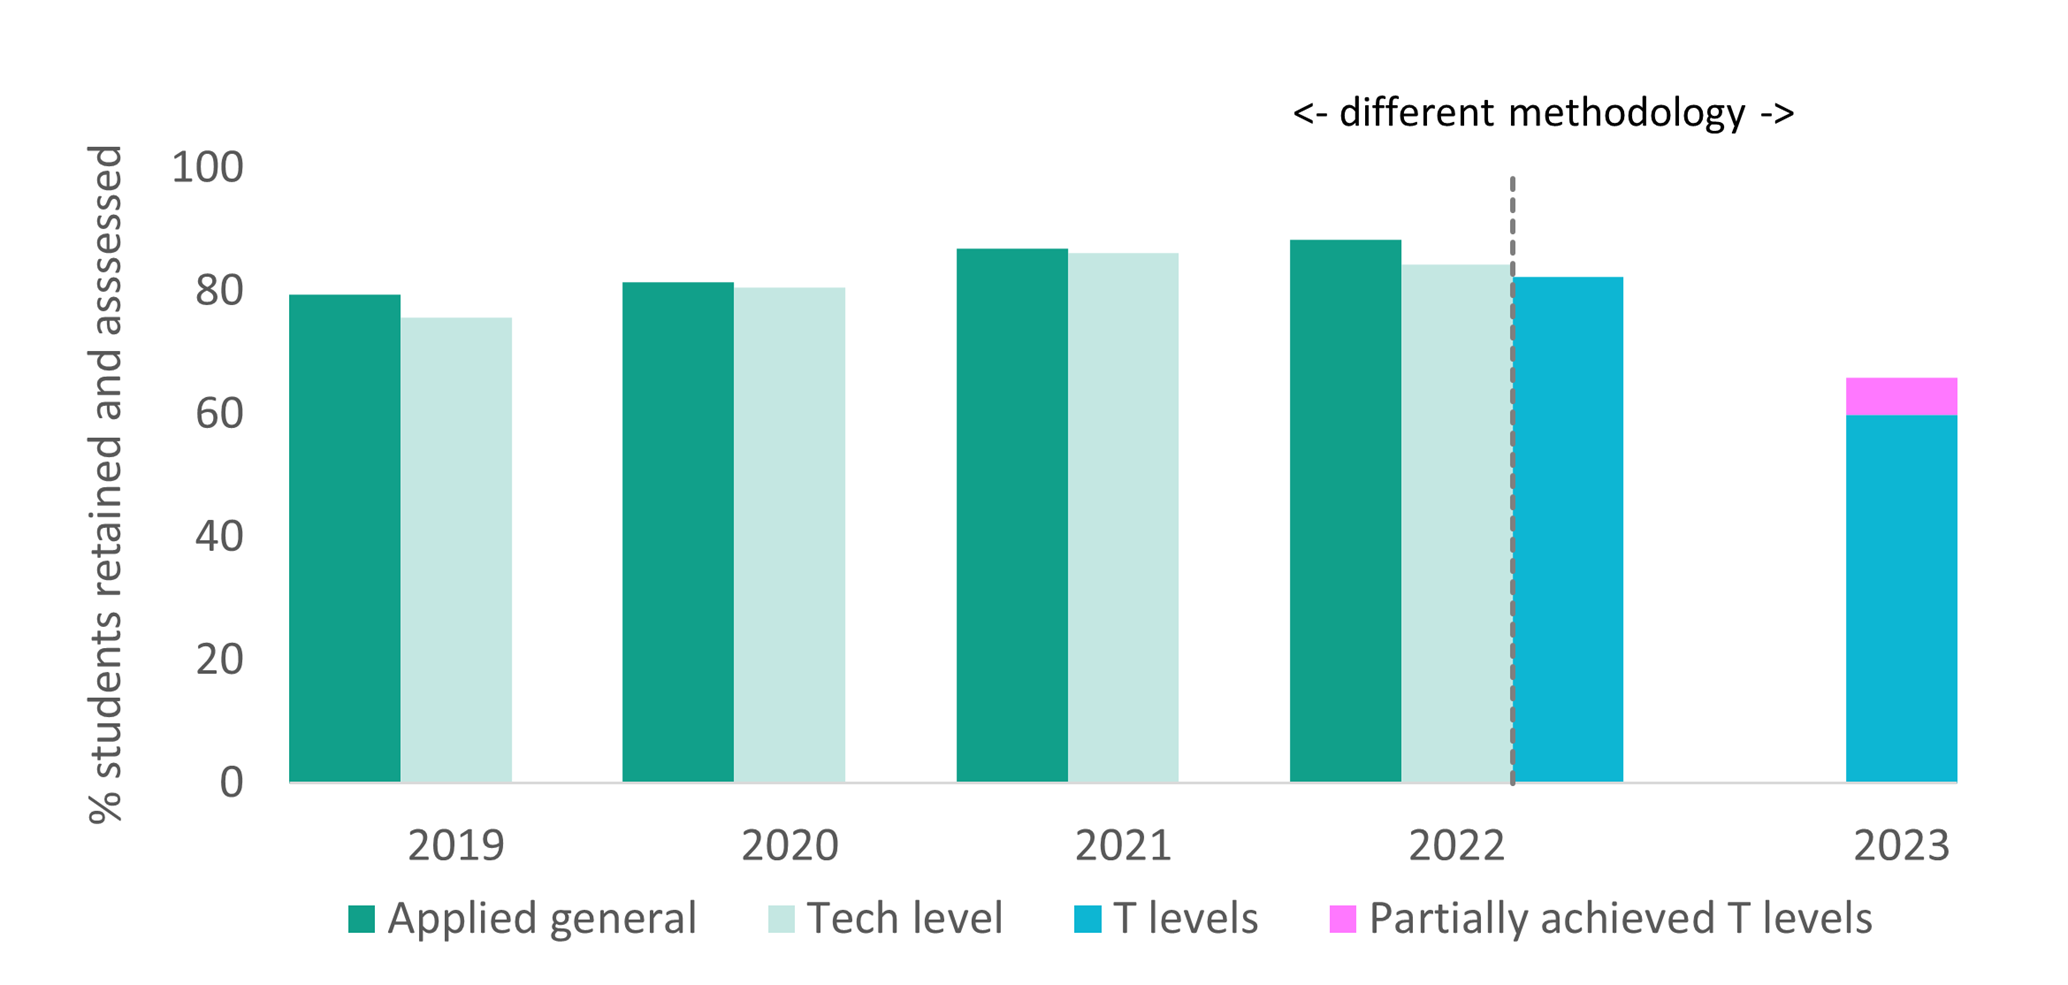
Students taking level 3 technical and vocational qualifications also receive their results today, including the second cohort of T level students. These new qualifications have been designed as high-status technical alternatives to A levels. The second cohort of T level students began their qualifications in 2021, and this cohort have been graded favourably to recognise that these qualifications are still in their roll-out phase. Figure 6 shows that, although around 5,210 students began a T level 2 years ago (as per stated in the government’s T level action plan), only 3,448 completed their T level and received a grade today. This suggests a completion rate of 65.9 per cent at best, which compared with last year’s 82.3 per cent, seems to suggest a sharp decrease in students completing their T levels. This figure is also significantly lower than the pre-pandemic completion rates of 79 and 76 per for applied general and tech level qualifications (the existing alternatives to A levels). As the methodology for calculating the completion rates differ, it is difficult to draw any firm conclusions from this comparison. However, the lower percentage compared with both 2022 and 2019 does seem to suggest that many students are facing challenges in these qualifications. Looking forward, this year’s figure may not be an indication of future completion rates for T levels as the first providers received significant support in establishing the courses, and provision of the new qualifications may also improve over time as they become established.
FIGURE 7: 18-year-olds UCAS applications, England
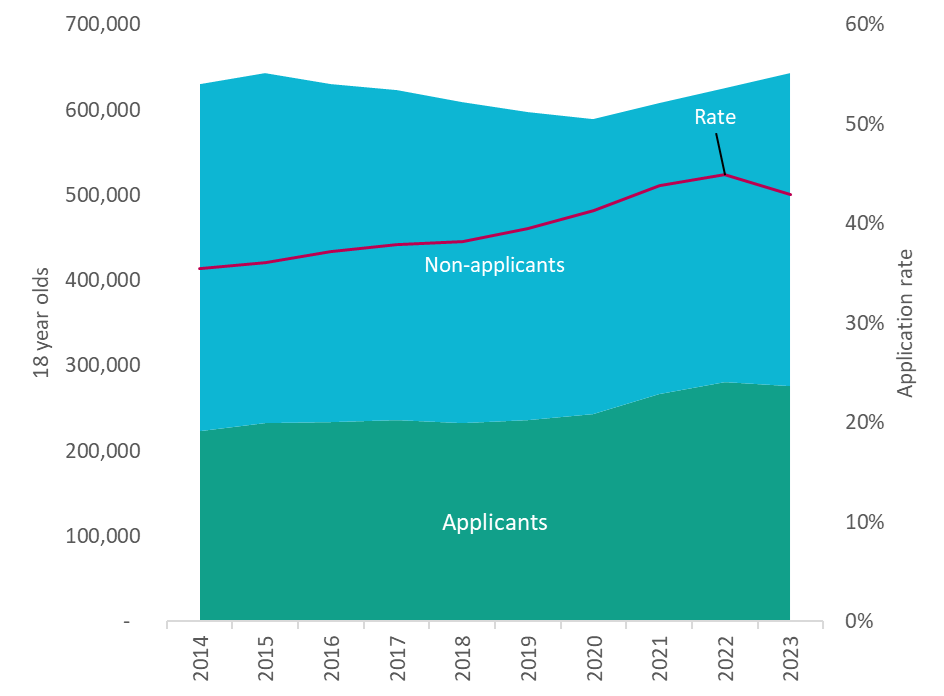
The number of 18-year-olds applying for higher education courses from England decreased after having reached its peak in 2022. As we can see from Figure 5, this comes together with an increase in the 18-year-old population, resulting in a decrease of the application rate of 2 per cent. This decline in applications in 2023 shouldn’t be unexpected; the return of A-level grading to pre-pandemic norms could have played a factor in shaping students’ decisions regarding university applications. Excluding the past two years, where teacher and centre assessed A-level grades led to an unprecedented increase in applications, the trajectory over the last 10 years continues to depict a consistent increase in the application rate among 18-year-olds.
FIGURE 8: UCAS applications and acceptance rate by provider/univeristy tariff
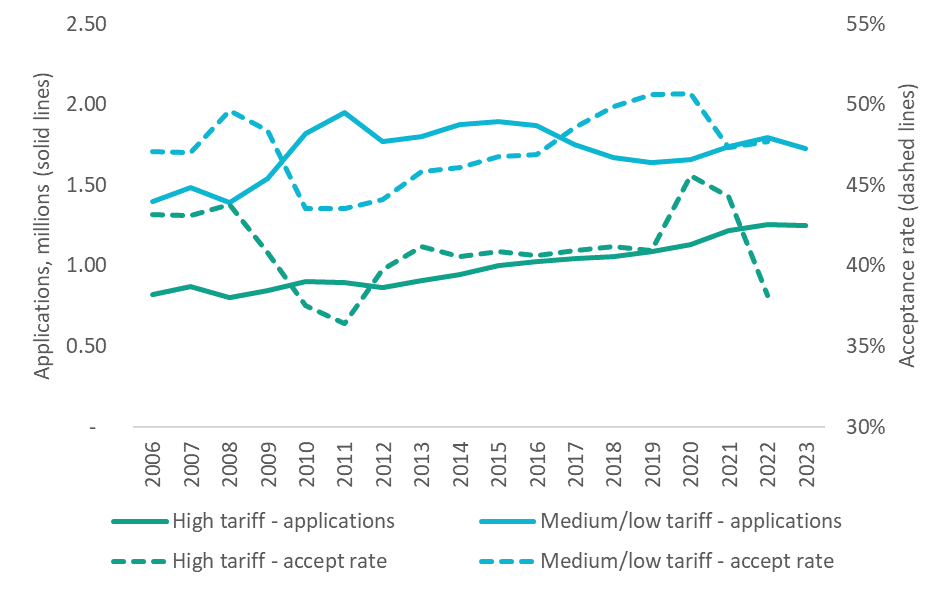
As we can see from Figure 8, whilst the number of applications for medium and low tariff universities is similar to pre-pandemic levels, the number of applications for high tariff universities has grown consistently over the last decade. Though the acceptance rate for high tariff universities increased during the pandemic, it fell in 2022, when demand was at a record level. With a similar level of demand in 2023, it’s likely that competition for places in more selective universities will remain high in 2023.
FIGURE 9: 18-year-olds UCAS application rates by English region
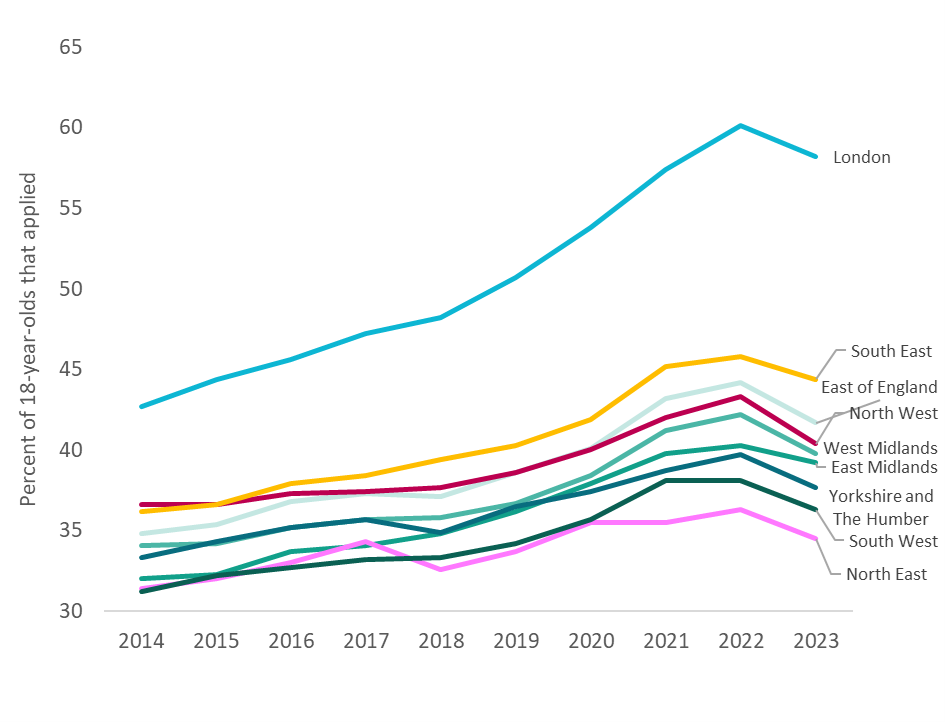
Figure 9 shows a breakdown of the application rates among 18-year-olds from different regions over the past decade. While the upward trend persists across all regions in England, variations in the degree of this growth have produced increasing regional inequalities.
Evidently, there is a significant disparity between application rates among students coming from London and their counterparts in all other English regions, and this gap has been further widened by the impact of the pandemic. Specifically, the gap between application rates from London and the North East, which holds the lowest application rate, has increased from 17 per cent in 2019 to 23 per cent in 2023. This change highlights once again how students who have been disproportionately affected by the pandemic are probably those living in the nation’s most socio-economically disadvantaged areas.
FIGURE 10: POLAR 4 Entry Rates in England
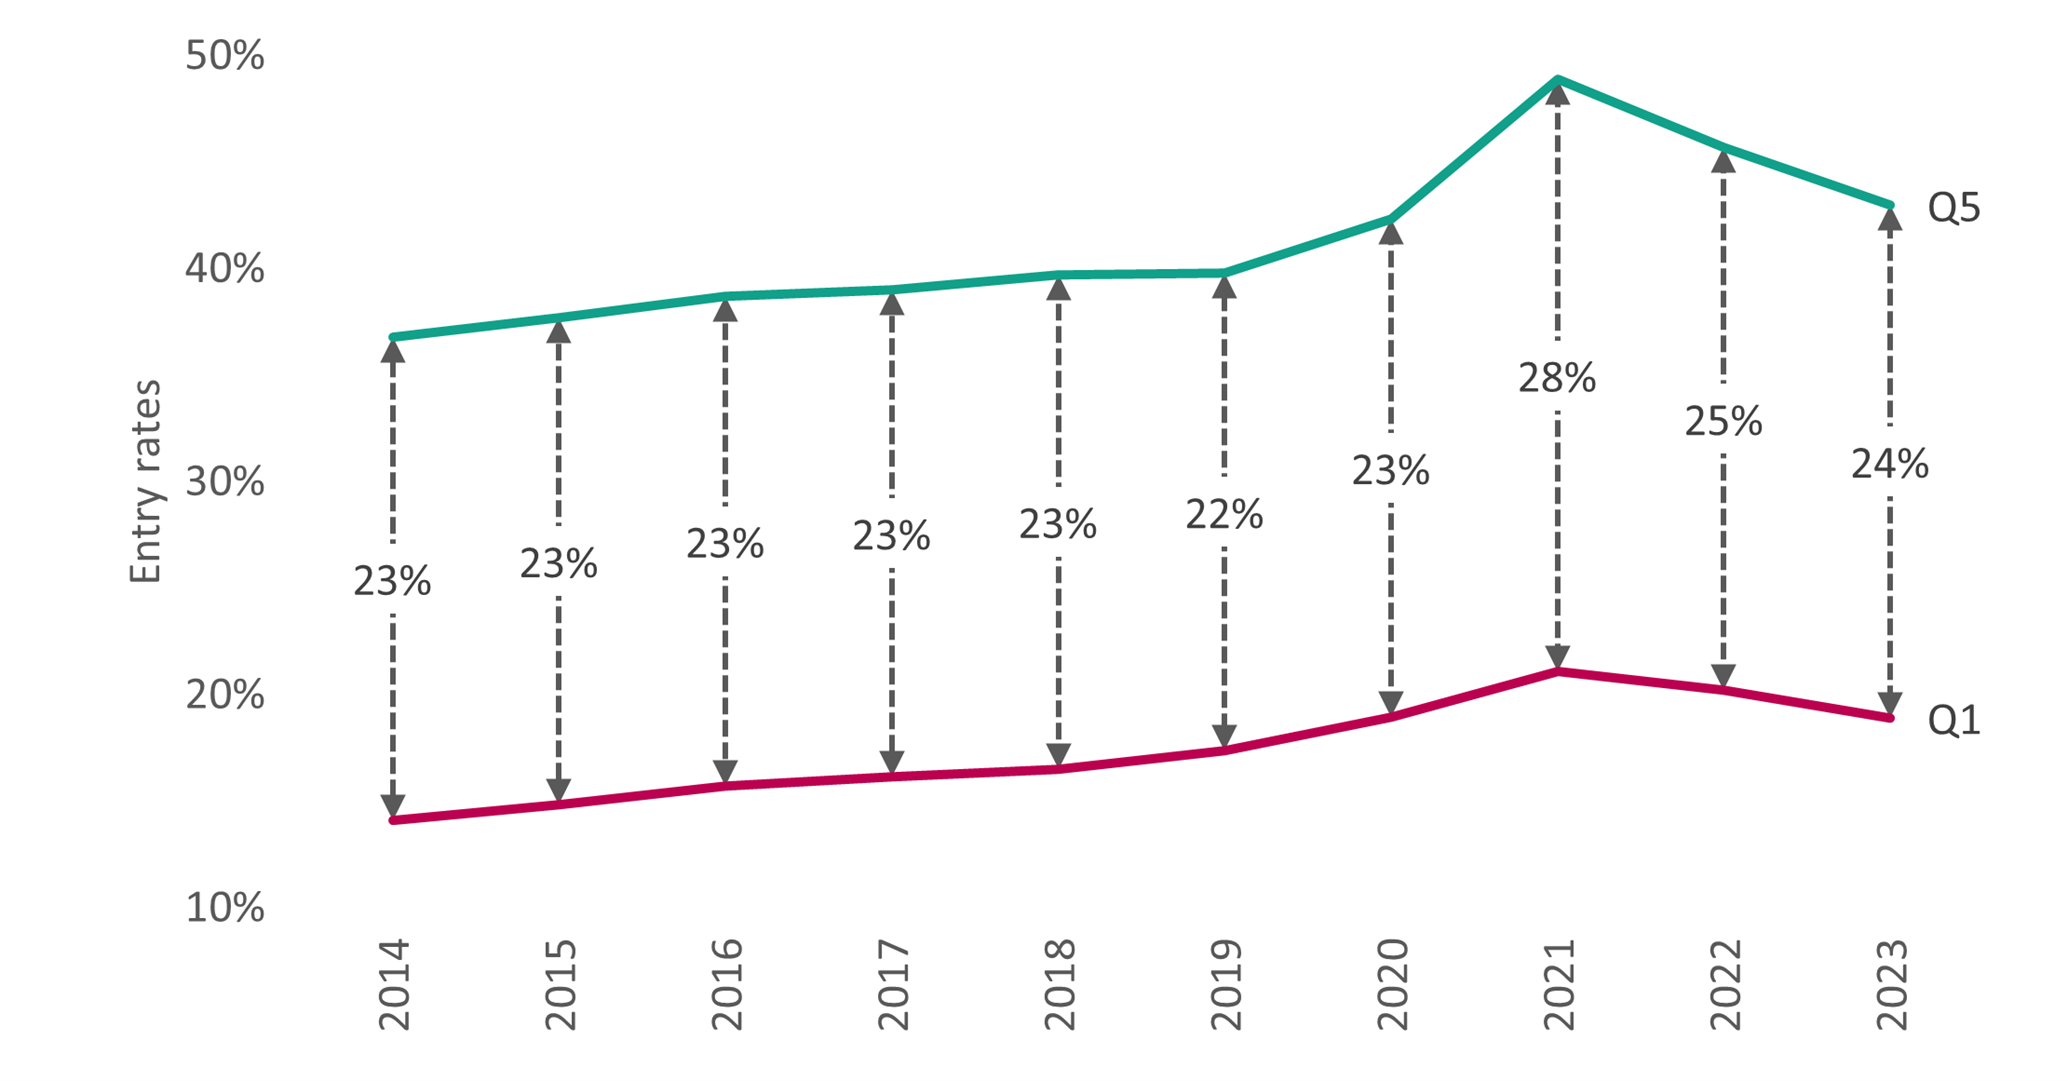
Figure 10 shows the entry rates for individuals from areas with historically high and low participation rates in higher education, using the POLAR4 quintiles. Quintile 1 indicates the areas with lowest levels of participation, and quintile 5 the highest.
The disparity between the quintiles was at its highest in 2021, at the height of the pandemic. The gap has since decreased but remains slightly higher than pre-pandemic levels. The entry rates for quintile 5 increased at a significantly higher rate than quintile 1 between 2019 (40 per cent) and 2021 (49 per cent). The reduction in the gap since then can be largely attributed to the entry rates for quintile 5 returning to levels that were seen at the beginning of the pandemic (42 per cent). Positively, the fall in entry rates for quintile 1 between 2021 (21 per cent) and 2023 (18 per cent) has been relatively smaller. Nonetheless, it is of concern that areas that have historically sent fewer students to higher education continue to be hampered by systemic barriers.