The Education Policy Institute (EPI) has published a major report, funded by the Nuffield Foundation, on the disadvantage gap in education.
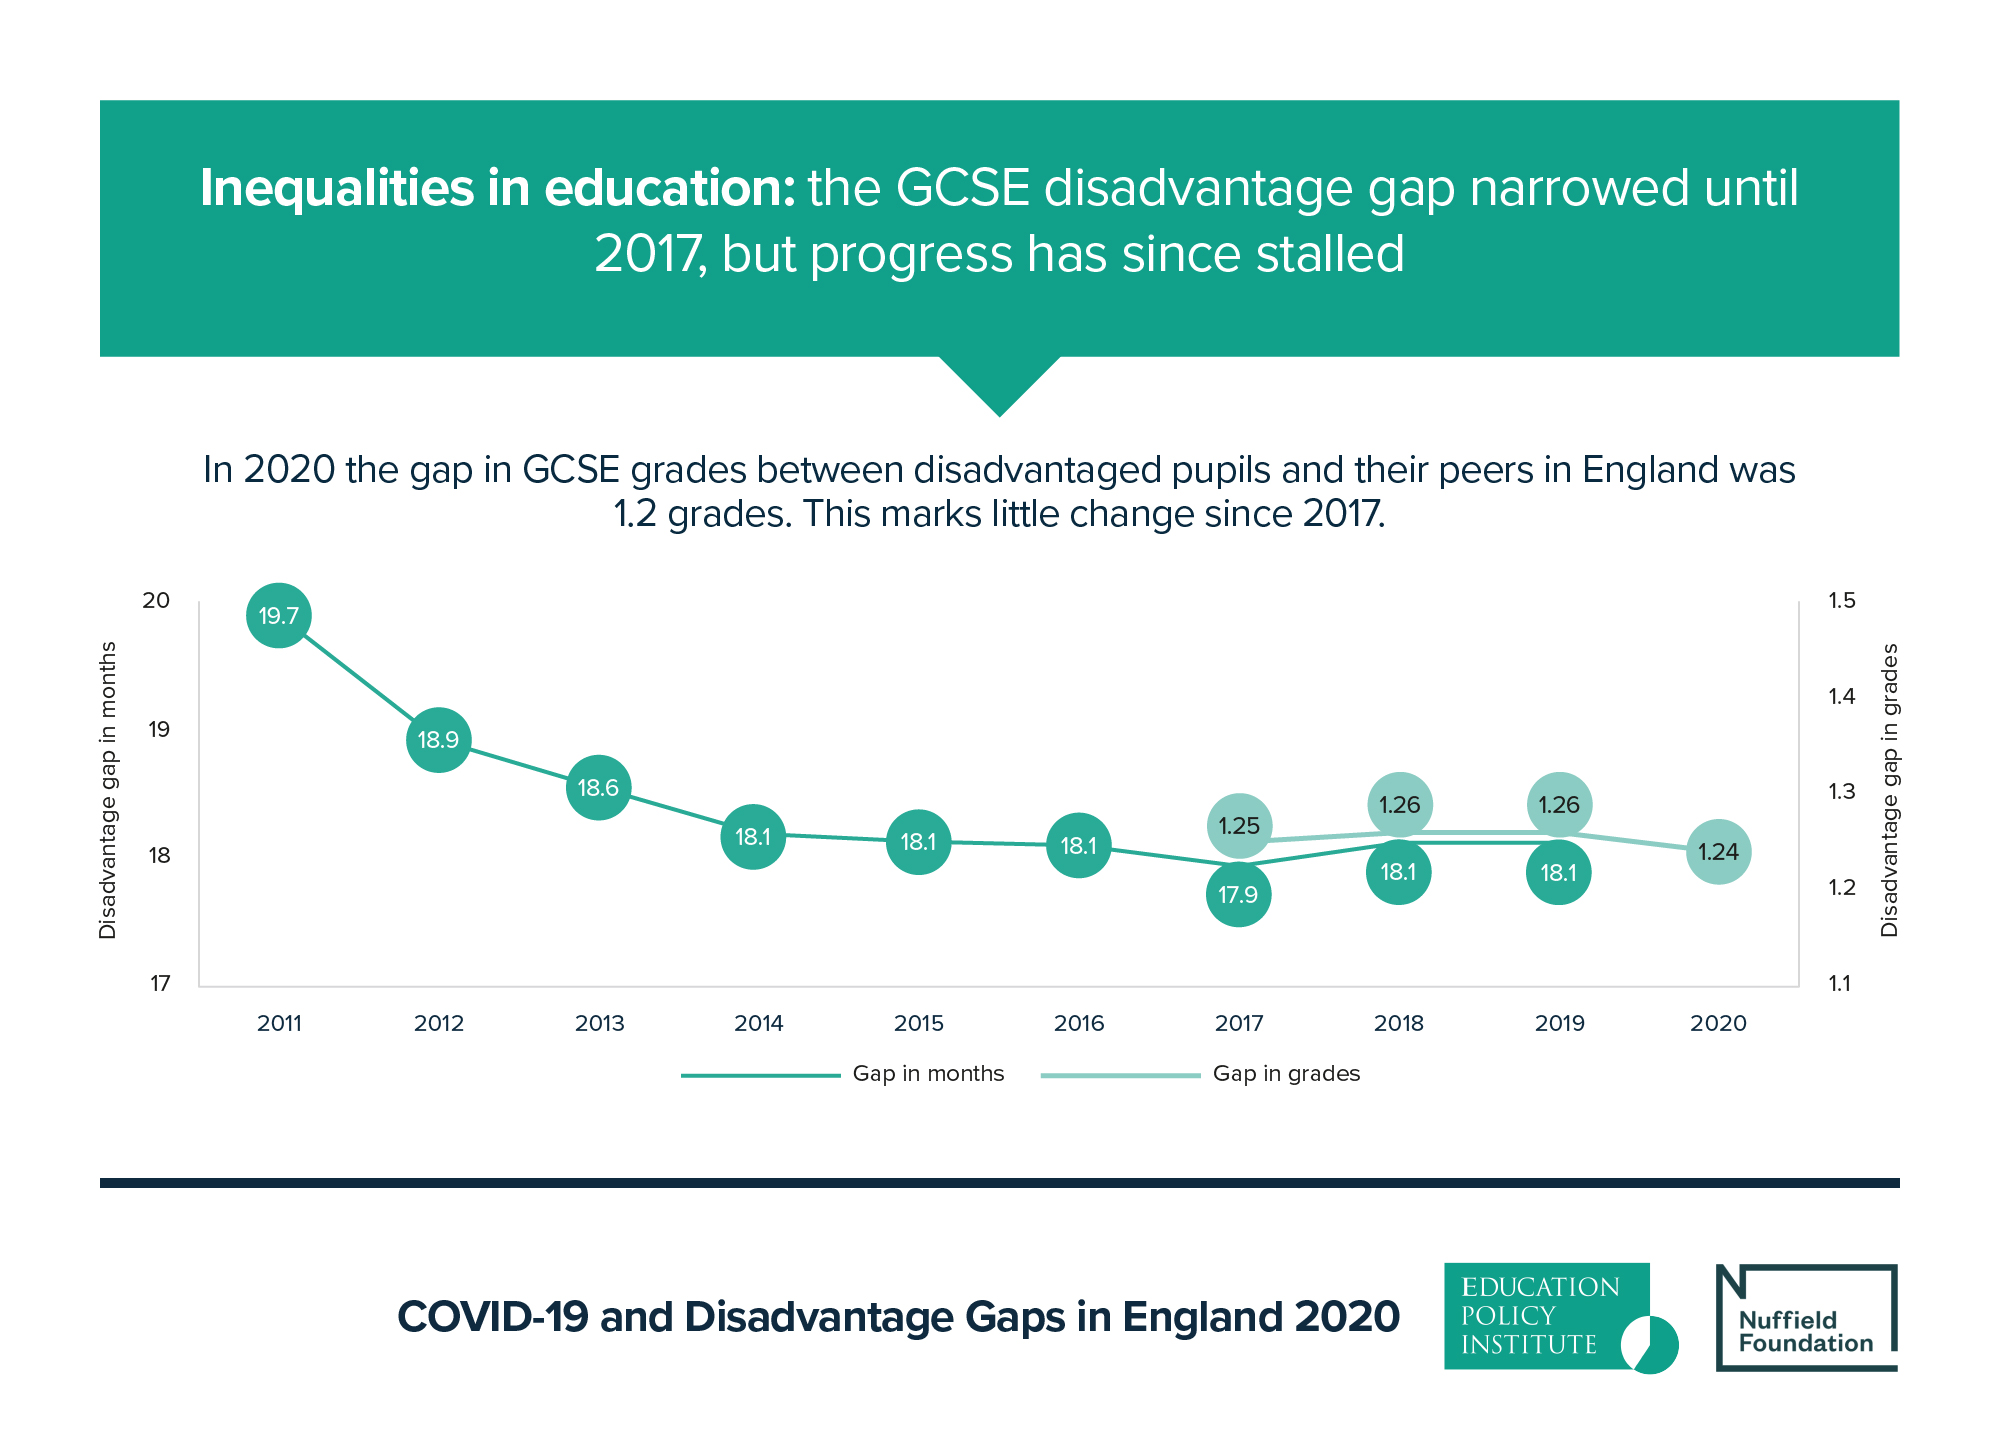
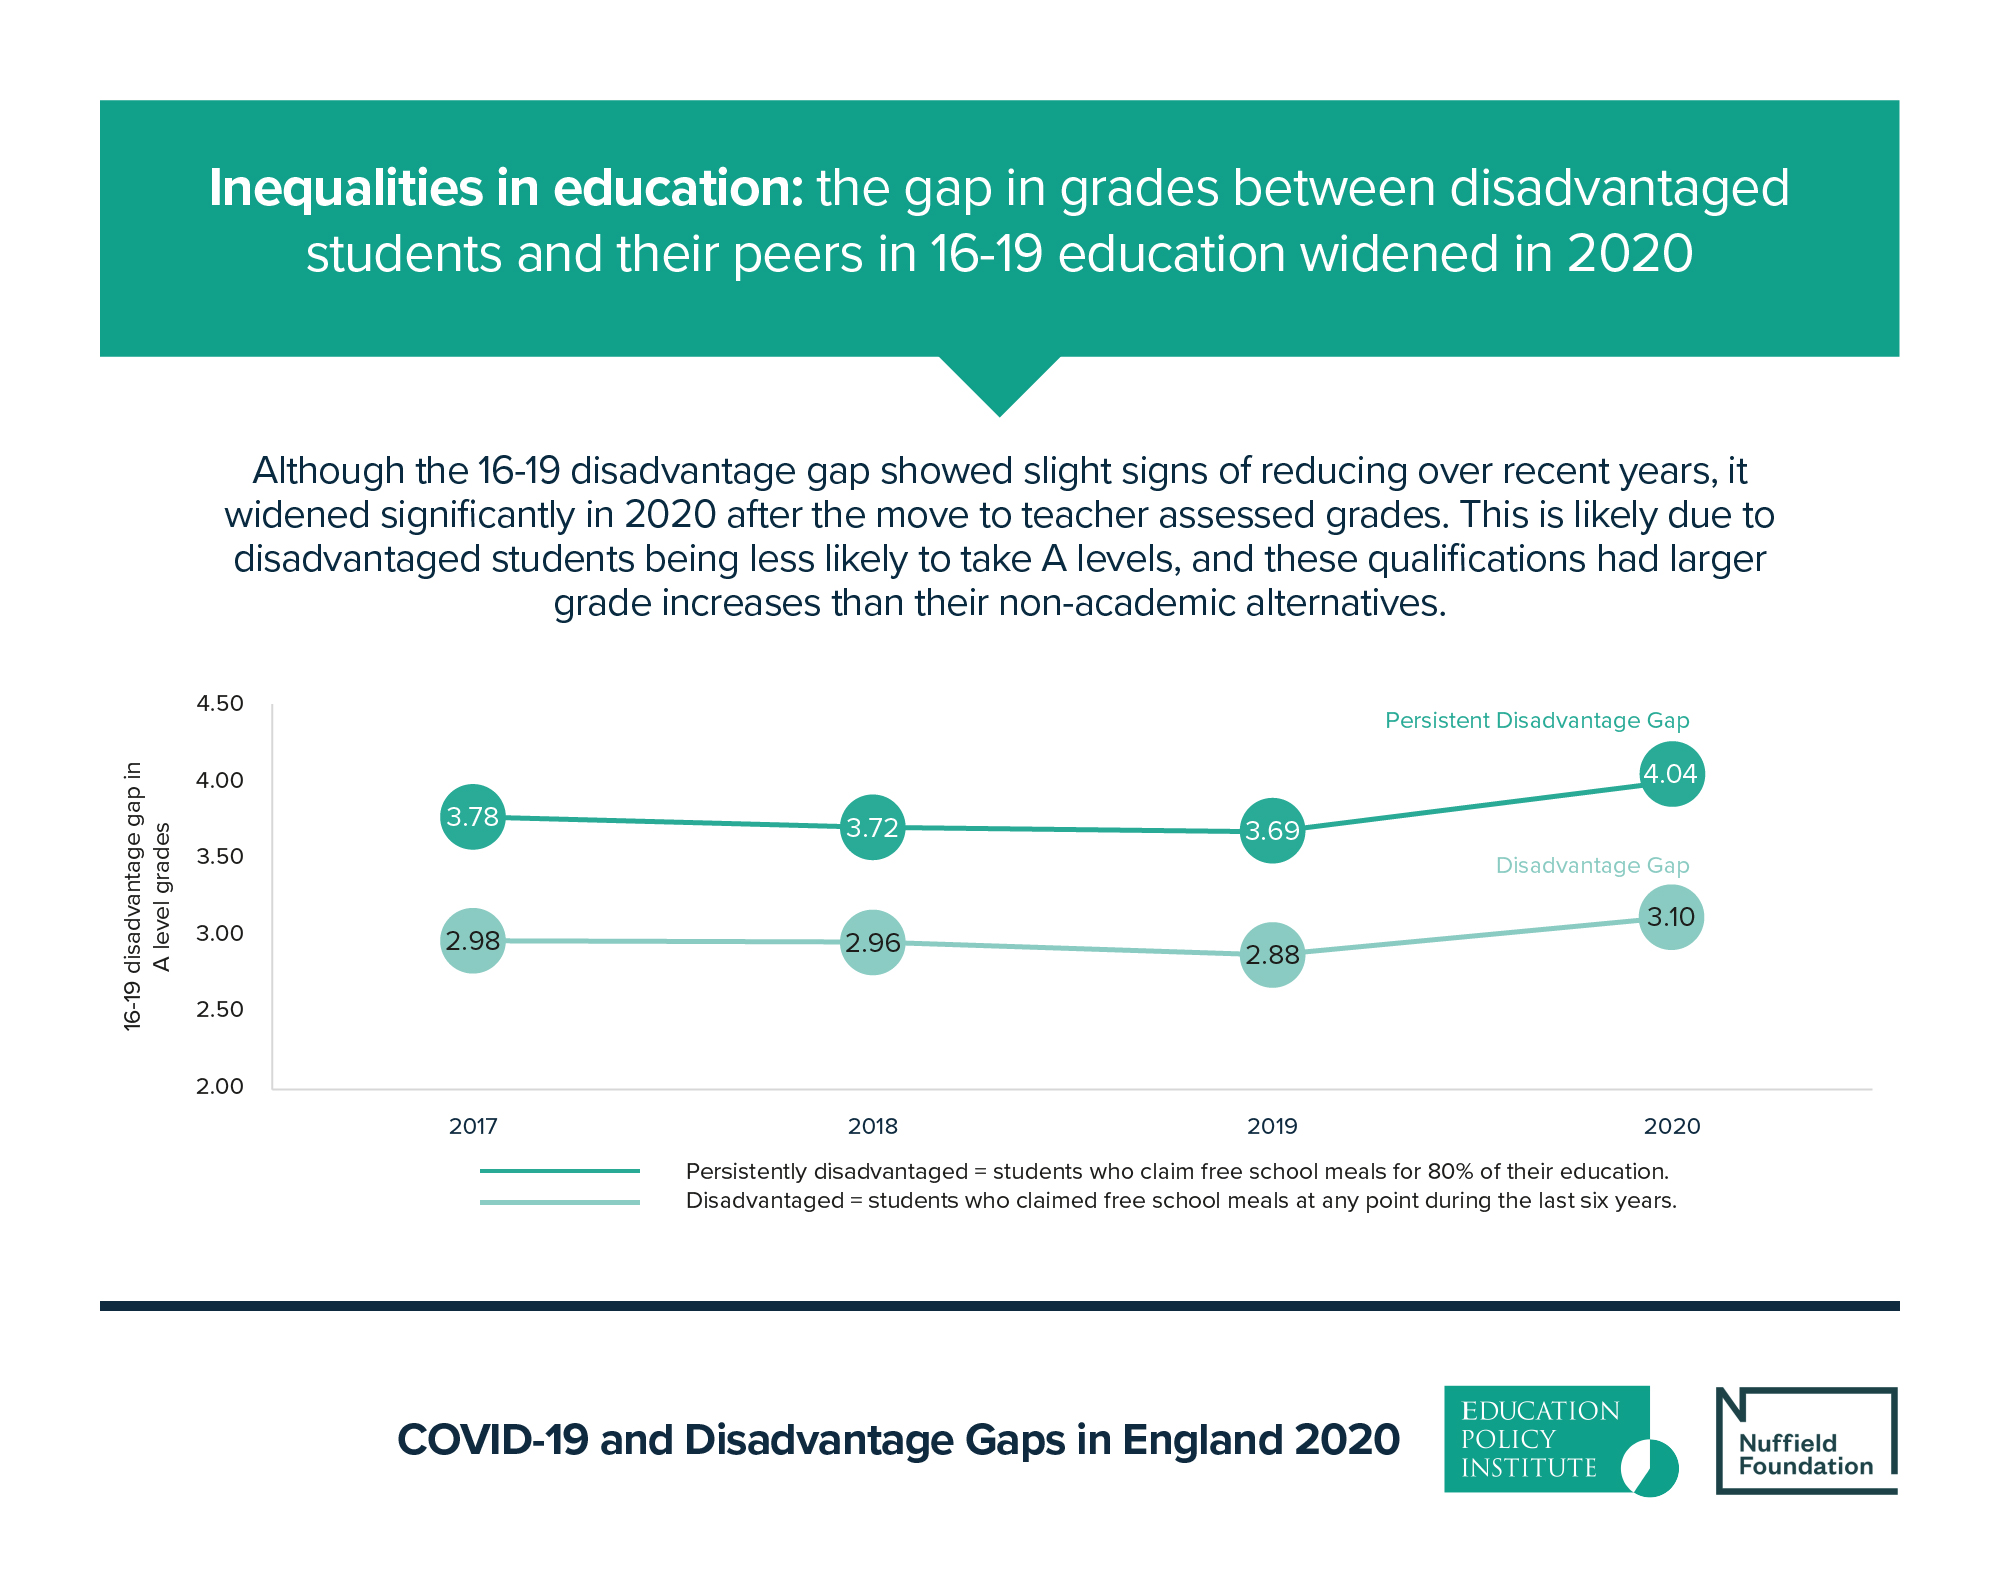
“The disadvantage gap” – the gap in grades between disadvantaged students and their peers – is a leading measure of social mobility in England and an indicator of the government’s progress in reducing inequalities in education.
The report examines the gap in 2020 at a national level, across different regions and local authorities, among varying levels of disadvantage, and at two stages of education – key stage four and five.
The research offers the first comprehensive picture of the impact of 2020 grades on different students – the year that saw the first switch to teacher assessed grades.
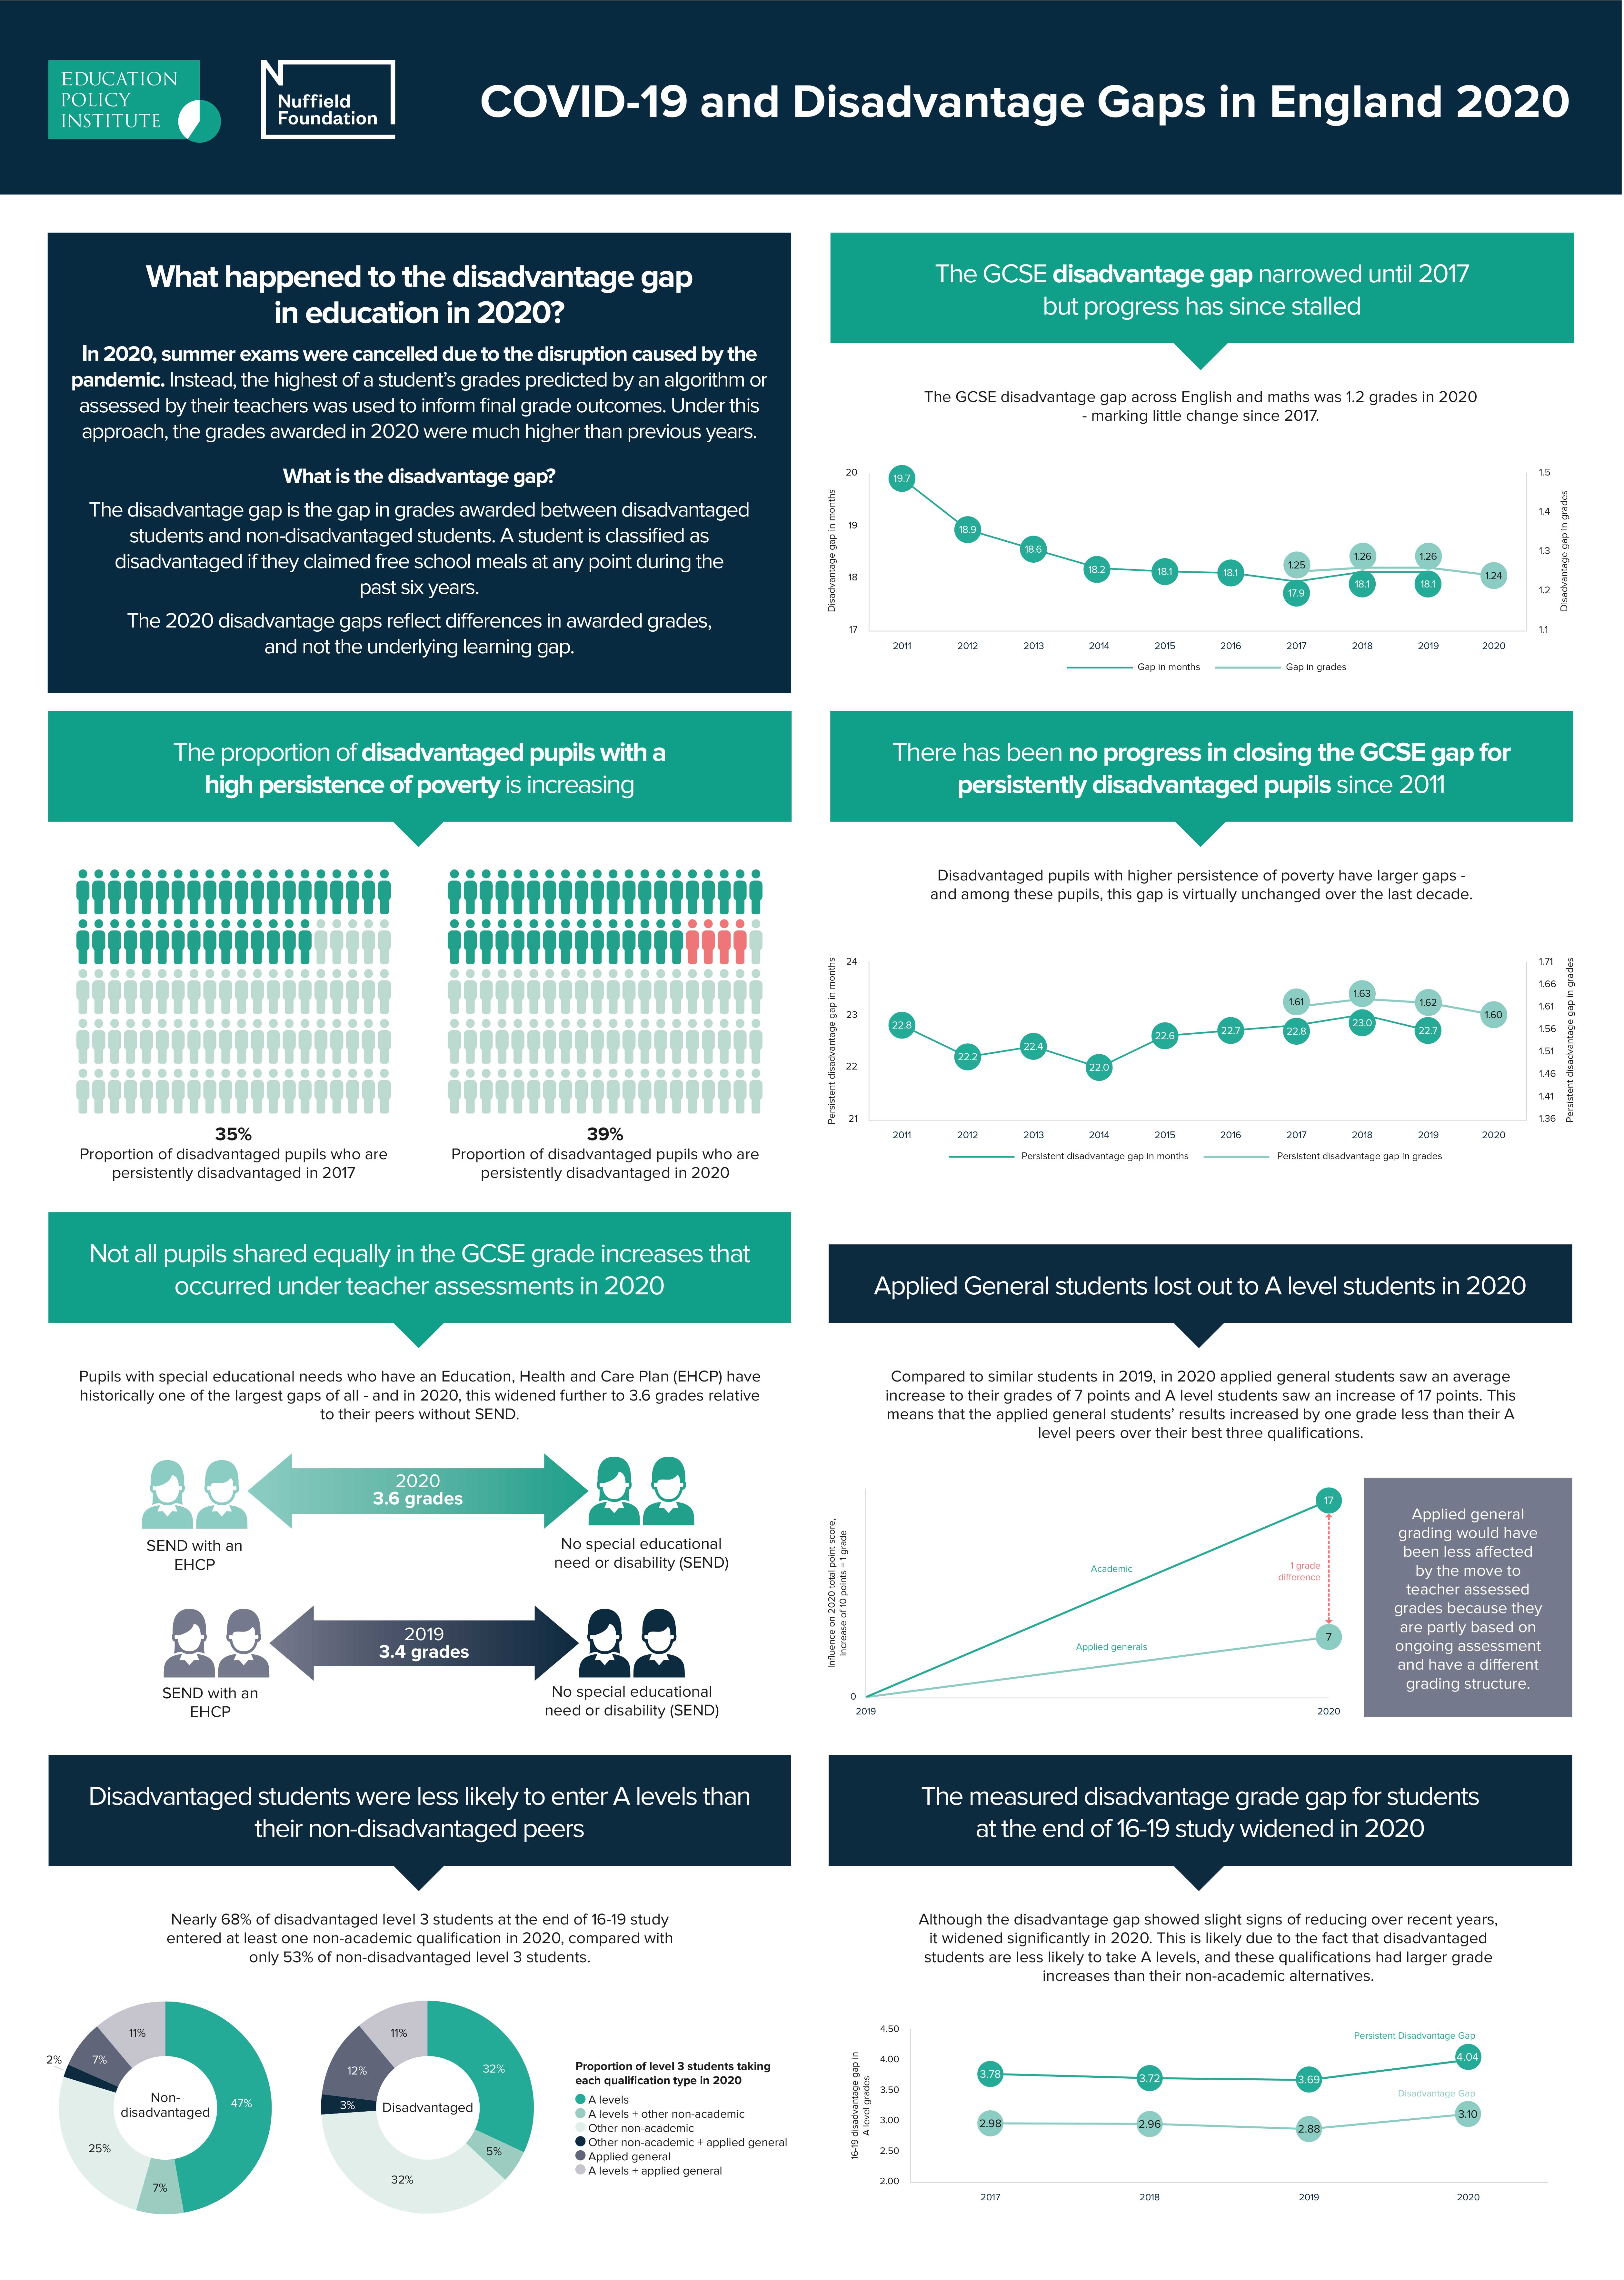
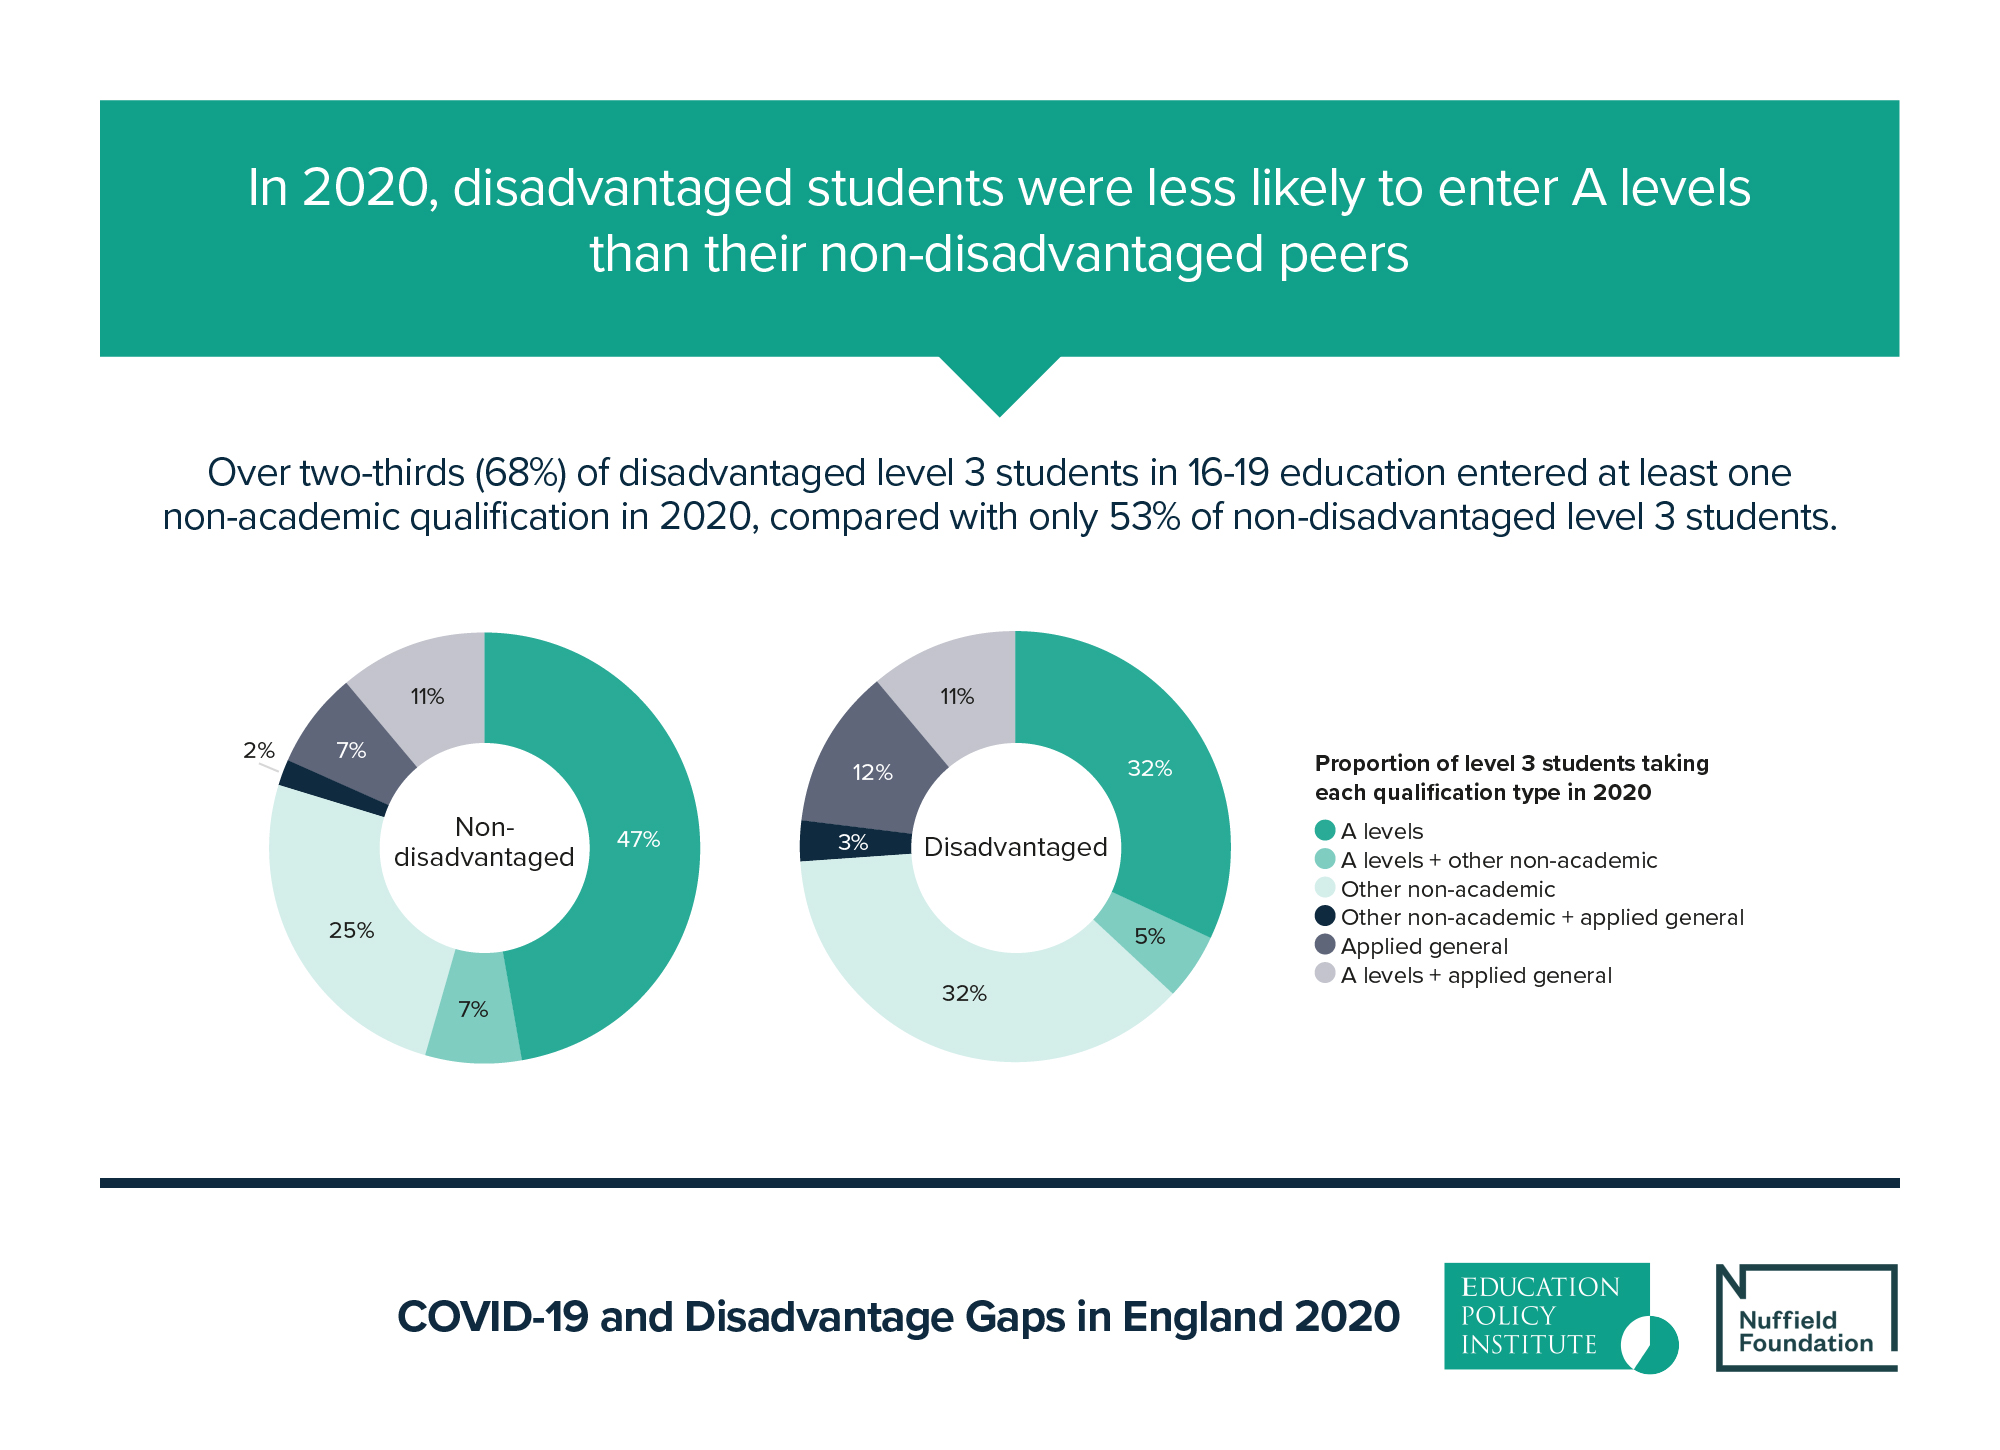
This infographic [click below to expand high-res] displays some of the key findings from the report – including the progress made in narrowing the disadvantage gap over the last ten years, the proportion of disadvantaged pupils in long-term of poverty, the GCSE gap for pupils with special educational needs and disabilities (SEND), and the disadvantage gap and qualification choices for pupils in 16-19 education.
The full report, a summary of its key findings, and all other documents can be found here.
Sharing the Infographic on social media, and just want to share individual charts and graphs?
Click on these links for separate visuals: 1 – 2 – 3 – 4 – 5 – 6 – 7. We tweet at @EduPolicyInst
