Recent EPI analysis of widening participation data published by the Department for Education has shown that inequalities remain within progression to higher education. This further analysis examines whether such patterns remain at the local authority level and assesses whether there is evidence of a “London effect” influencing progression to higher education. It concludes that the higher rate of progression in London can largely be explained by relative differences in prior attainment and ethnic composition.

The large differences between the rates of progression to higher education for young people from different regions appear to suggest that there is a London effect, whereby young people in London are more likely to progress to higher education than elsewhere.
Analysis by the former Department for Business, Innovation and Skills of progression rates to university of young people who sat their GCSEs in 2003 and 2008, found evidence of a raw London effect in progression to higher education.[1]
We do not seek to replicate this analysis, however, we are interested in whether such an effect seems to be still visible using more recent data. Moreover, in light of the increasing government policy and initiatives around social mobility, and with obtaining a degree on average offering a wage premium over someone without a degree, widening participation is a current policy topic.[2] Using local authority, as opposed to neighbourhood level data, will allow us to highlight the areas where more work needs to and can be done to ensure fair opportunity.
The widening participation statistical release from last month included tables for the progression rate to higher education of young people aged 19 in 2014-15 for each local authority in England.[3]
Figure 1: Local authorities ranked by rate of progression to higher education of all young people aged 19 in 2014-15
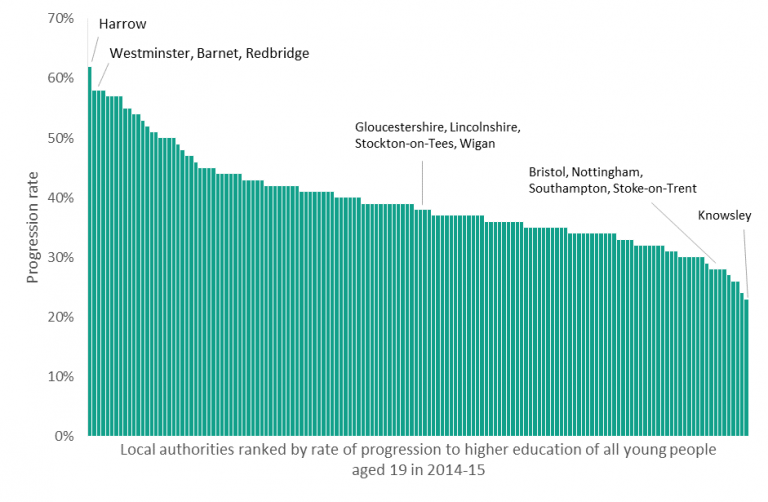
The differences between the rates of progression are even larger at the local authority than they are at the regional level: the gap between the local authorities with the highest and lowest rates of progression, Harrow and Knowsley respectively, is 39 percentage points. This contrasts with a 15 percentage point difference between the progression rate of the highest region, Outer London, and the lowest, South West.
Figure 2: Local authorities by quartile of rate of progression to higher education of all young people aged 19 in 2014-15
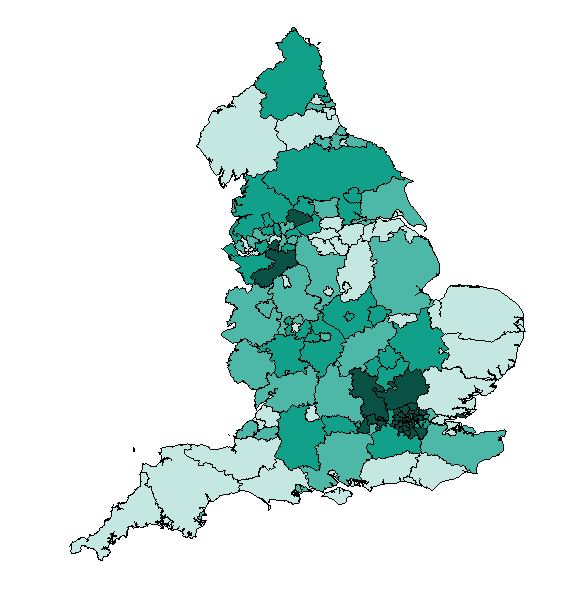

Local authorities in London have some of the highest rates of progression to higher education. 25 of the 32 London boroughs are in the top quartile, with all except for one, Havering, above the median. This indicates that the London boroughs generally seem to have similar rates of progression to higher education, although there remains a 27 percentage point difference between the top London borough, Harrow (62 per cent) and the bottom, Havering (35 per cent).[4]
When compared to the performance of other local authorities, London boroughs are over-represented at the higher end and under-represented at the lower end of the scale. Of the 35 local authorities in the top quartile, over 71 per cent of these are London boroughs, even though they only represent 21 per cent of local authorities in England.[5] Moreover, given that only three of the local authorities in the top quartile, Trafford, Calderdale, and Cheshire East, are outside the South East or East of England, a potential London effect could be influencing the progression rates in those local authorities near London.
Whilst initial examination of the data suggests there could be a London effect, there are clearly other factors which could influence the progression rate.
By controlling for these factors, we can see whether the London effect still exists or whether it is these other factors that make a difference. Note that as this analysis is taking place at the local authority rather than the individual level, we cannot determine causality with regard to the individual decision to progress to higher education.
The progression rate to higher education for each local authority refers to young people who were aged 19 in the 2014-15 academic year. This is the dependent variable in all subsequent analysis.
The raw London effect is measured by a regression of progression on a dummy variable for whether a local authority is located in Greater London. This combines Inner and Outer London boroughs, as a London effect would likely be influential across the Greater London Authority area.
We then try to explain this by including groups of control variables through which this raw effect could be mediated.
First, by including controls for both threshold and higher level attainment at level 3, we are controlling for differences in attainment, a key determinant of progression to higher education, between local authorities.[6]
The full specification then includes additional controls for income, population density, number of students per region, socio-economic class, expenditure on outreach by universities within regions, and ethnicity. All of these could reasonably influence the proportion of students from a local authority who go on to higher education.[7]
The ethnicity variable used refers to the percentage of the population of the local authority who are White British. The rationale behind this is based on findings by the former Department for Business, Innovation and Skills and UCAS that White British students are the ethnic group with the lowest rate of progression to higher education.[8]
Figure 3 presents the size and statistical significance of the London effect in each specification.
Figure 3: Size of the coefficient on the dummy variable for London in each regression specification.
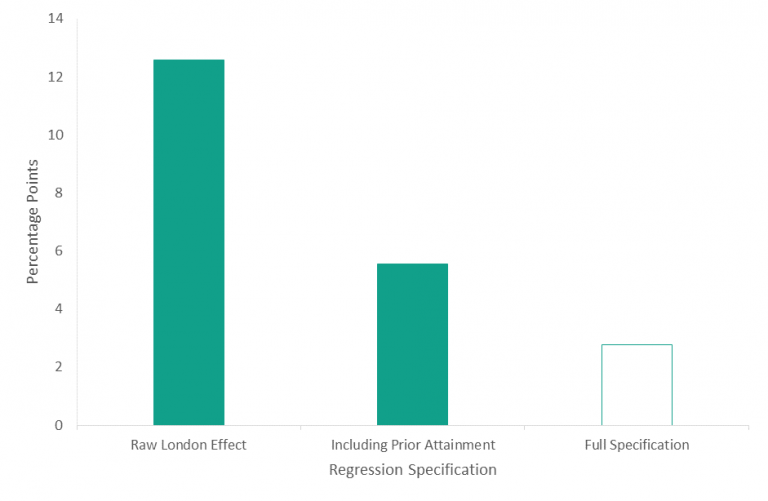
*Shading indicates statistical significance at the 5 percent level.
The raw London effect of 12.6, which is statistically significant, implies that a local authority being in London increases the progression rate by over 12 percentage points. With the addition of controls for prior attainment, the size of the coefficient more than halves to 5.6, but remains statistically significant.
In the full regression specification, the size of the London effect more than halves again to 2.8, but is no longer significant, indicating that the London effect is mediated through the control variables.
It is interesting to note that the variable for expenditure on widening participation outreach by universities in our full specification is both statistically insignificant and small in value. This could indicate that widening participation funds are not being spent as effectively as they could be. The Office for Fair Access acknowledges the gap in evaluation of access initiatives and has refined its access agreement guidance for 2018-19 to focus more on universities helping raise attainment in schools.[9] Further analysis could examine the effectiveness of widening participation expenditure in order to determine whether it could be better targeted.
Only three variables are statistically significant at the 5 percent level in the full specification: the two attainment variables and the ethnicity variable for the percentage of the population which is White British.
Whilst high attainment in A level facilitating subjects is a statistically significant variable in itself, the size of the coefficient, 0.2 is such that a 10 percentage point increase in the percentage of young people achieving this threshold implies only a 2 percentage point increase in the progression rate. The equivalent coefficient on the threshold attainment variable, 0.7, implies a 7 percentage point increase in the progression rate for a 10 percentage point increase in the percentage of young people qualified to level 3.
Given the importance of facilitating subjects and high grades to Russell Group universities, the significance of this variable is likely to differ for entry to those universities.[10] However, it is interesting to note that being qualified to level 3, which consists of passing 2 or more A level or equivalent qualifications has a larger effect than higher attainment on the rates of progression to higher education of local authorities.
Average attainment at level 3 is statistically significantly higher in London, with the percentage of young people qualified to level 3 in the capital over 9 percentage points greater than elsewhere. However, high attainment in A level facilitating subjects is not statistically significantly different between local authorities within and outside London.
The mean percentage of the population who are White British is statistically significantly lower in London boroughs compared to local authorities outside of London, with a difference of nearly 40 percentage points.
Hence it can be seen that in our model, the strong performance of London boroughs can be explained by relatively high levels of attainment at level 3 and relatively low levels of White British students.
While our findings support those of the Department for Business, Innovation and Skills, their analysis of conditional differences within ethnic minorities between those from within and outside of London shows that those from London remain more likely to progress to university even after controlling for attainment.[11] This suggests that there remain unobserved variables related to being in London which increase the likelihood of progression to higher education. Further research could isolate the source of this unobserved effect.
The limitations in our data mean that we cannot model the individual decision to progress to higher education. In addition, our data show that progression rates to higher education for young people who were previously in receipt of free school meals are lower than for those who were not.[12] Although socio-economic background and income were not statistically significant variables in our analysis at local authority level, further analysis at an individual level could usefully compare the significance of different variables in influencing progression rates for disadvantaged and non-disadvantaged young people. Nevertheless, it is useful to show that the higher rate of progression to higher education in London can largely be explained by relative differences in prior attainment and ethnic composition.
[1] Crawford, C., and Greaves, E., (2015) ‘Socio-economic, ethnic and gender differences in HE participation’, Department for Business Innovation and Skills, p. 65-76.
[2] Social Mobility Commission (2017) ‘About us’, available from: https://www.gov.uk/government/organisations/social-mobility-commission/about.; Britton, J., et al. (2016) ‘How English domiciled graduate earnings vary with gender, institution attended, subject and socio-economic background’, Institute for Fiscal Studies.
[3] Department for Education (2017) ‘Table 2: Estimated percentage of 15 year old pupils from state-funded and special schools by Free School Meal status who entered HE by age 19 by local authority’, Widening Participation in Higher Education 2017 Main Tables, SFR 39/2017, available from: https://www.gov.uk/government/statistics/widening-participation-in-higher-education-2017.
[4] There are 32 London boroughs as defined by the London Government Act 1963. These are: Barking and Dagenham, Barnet, Bexley, Brent, Bromley, Camden, Croydon, Ealing, Enfield, Greenwich, Hackney, Hammersmith and Fulham, Haringey, Harrow, Havering, Hillingdon, Hounslow, Islington, Kensington and Chelsea, Kingston upon Thames, Lambeth, Lewisham, Merton, Newham, Redbridge, Richmond upon Thames, Southwark, Sutton, Tower Hamlets, Waltham Forest, Wandsworth, and Westminster. The City of London is not legally a London borough and is excluded from this analysis due to incomplete data.
[5] There are 150 counties, unitary authorities, London boroughs or metropolitan boroughs in England, excluding the City of London and the Isles of Scilly.
[6] HEFCE (2015), ‘Young participation in higher education A-levels and similar qualifications’, p. 2.
[7] Bolton, P., (2010) ‘Higher education and social class’, House of Commons Library, SN/SG/620.; Clayton, N., (2015) ‘The education gap: how likely are young people to go on to university?’, CentreforCities.; Oliveira, T., and Zanchi, L. (2004) ‘Participation in higher education in Britain: The effect of ability and parental income’.
[8] Crawford, C., and Greaves, E., (2015) ‘Socio-economic, ethnic and gender differences in HE participation’, Department for Business Innovation and Skills.; UCAS (2015) ‘End of Cycle report 2015’.
[9] Office for Fair Access (2017) ‘Access agreements for 2018-19: key statistics and analysis’, p. 2.
[10] Russell Group (2016) ‘Informed Choices’.
[11] Crawford, C., and Greaves, E., (2015) ‘Socio-economic, ethnic and gender differences in HE participation’, Department for Business Innovation and Skills, p. 65-76.
[12] Department for Education (2017) ‘Table 2: Estimated percentage of 15 year old pupils from state-funded and special schools by Free School Meal status who entered HE by age 19 by local authority’, Widening Participation in Higher Education 2017 Main Tables, SFR 39/2017, available from: https://www.gov.uk/government/statistics/widening-participation-in-higher-education-2017.