⏱️ Estimated Read: 1 min
How have A level subjects evolved over the last two decades?
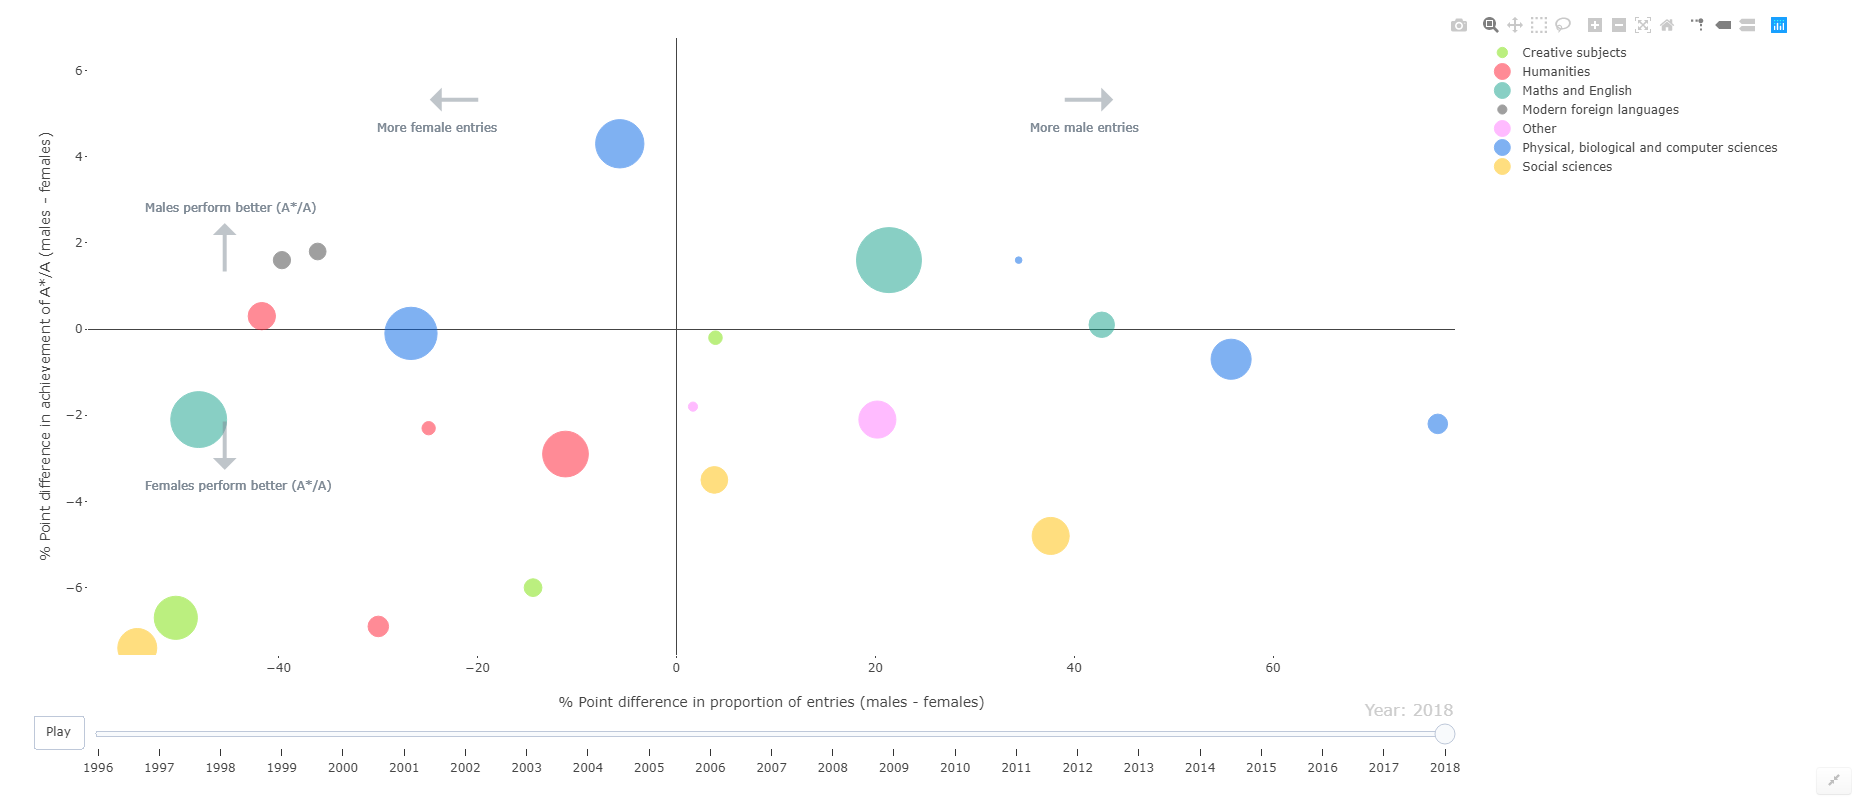
This interactive chart illustrates the gender gap between males and females in A level subject entries and attainment for each year between 1996 and 2018.
It is based on published Department for Education statistics covering students at the end of Key Stage 5 in England.
Click on the image below to begin using the chart.
Our full analysis of 2019’s A level results can be found here.


