Students have today been awarded their A level, vocational and applied level 3 qualification results. Standards have now been held constant for several years, following the higher grades awarded during the pandemic under centre and teacher assessed grades.
The number of 18-year-olds in the country increased this year, yet there was a fall in the number taking A levels. This may reflect the return to normal grading for GCSEs two years ago, making those receiving their results today the first post-pandemic year group not to benefit from higher GCSE grades when choosing their post 16 courses.
Key findings:
- The proportion of A levels awarded top grades (A/A*) increased to 28.2 per cent in 2025, from 27.6 per cent in 2024 and 25.2 per cent in 2019.
- The proportion awarded grade C or above in 2025 (77.7 per cent) was also higher than in 2024 (76 per cent), and the overall pass rate (97.4 per cent) was only marginally higher than in 2024 and similar to 2019 (97.5 per cent)
- There was a decrease in the proportion of A levels awarded top grades in independent schools in 2025 (48.4 per cent) compared to 2024 (49.4 per cent), meaning the gap between independent schools and other provider types, such as FE colleges and sixth form colleges, narrowed this year.
- The gender gap in the proportion obtaining top A level grades has reversed this year, meaning male students received marginally more top grades than females. This is the first time since 2019 that this has been the case under usual grading arrangements.
- Female students were more likely to achieve grade C and above, but this lead has narrowed to 3.5 percentage points in 2025, from 4.3 percentage points in 2024.
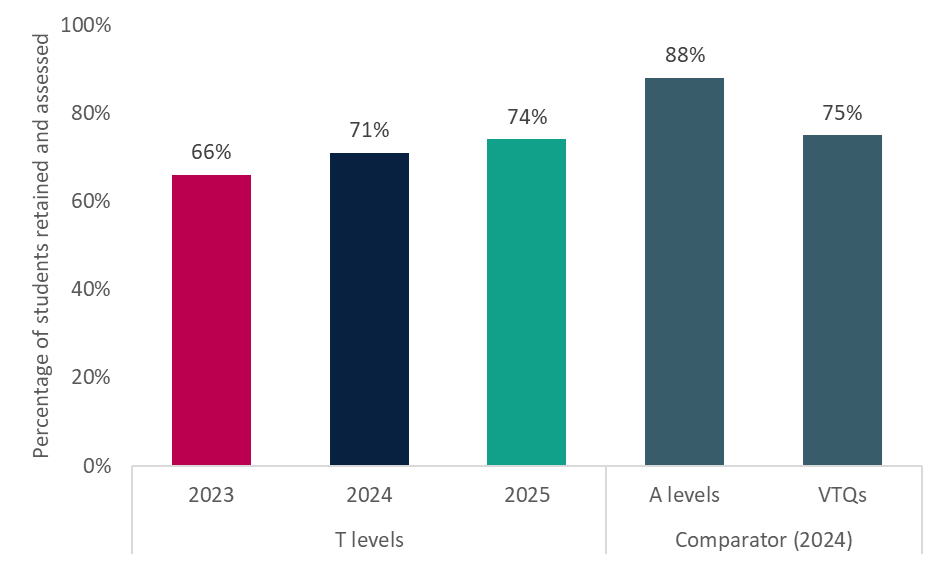
- T level retention rates rose for a third year in a row, from 66 per cent in 2023 to 74 per cent in 2025. This brings T level retention rates closer to similar sized alternative vocational and technical qualifications. However, retention is still significantly below that of A levels.
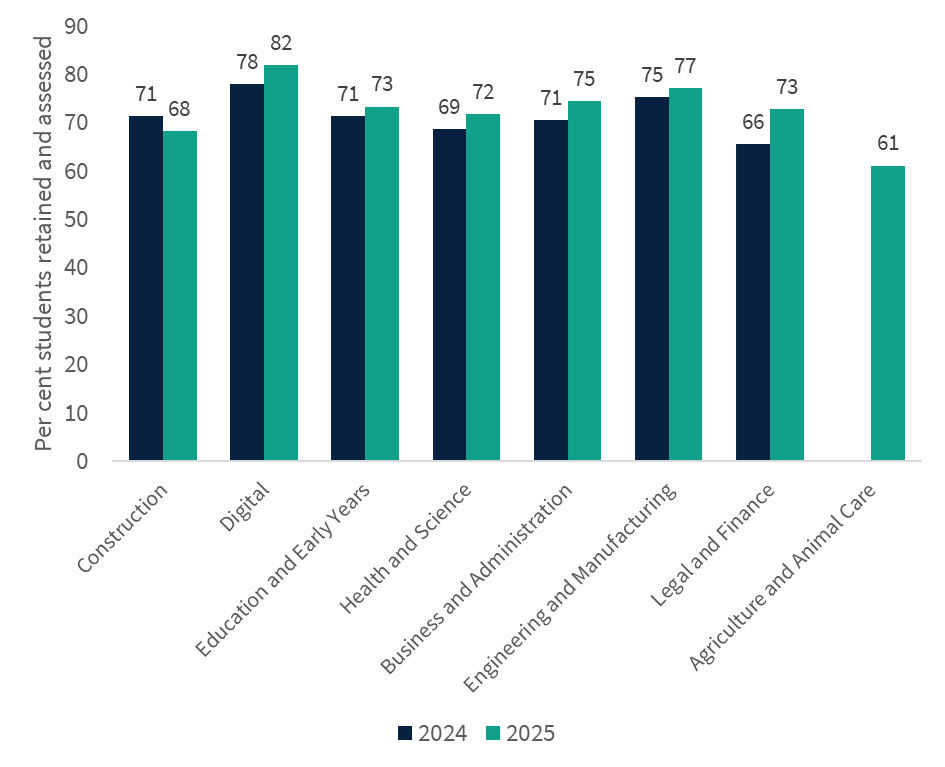
- T level retention differs by pathway. The digital route continues to have the best retention (82 per cent) while the new agriculture and animal care pathway had the lowest retention rate (61 per cent). This highlights that new T levels continue to have retention issues in their first year of delivery.
- The number of university applications from 18-year-olds in England increased this year due to population growth, but the proportion of 18-year-olds applying has decreased for the third year in a row.
- University applications from international students increased this year, driven by non-EU applicants. Applications from the EU remained at a similar level to recent years.
- The university application rate for students in London was considerably higher than in all other English regions, although this gap has narrowed slightly since last year. Meanwhile, the North East is the only English region where the application rate in 2025 was lower than the rate in 2019, before the pandemic.
Figure 1: A level grade distribution by year
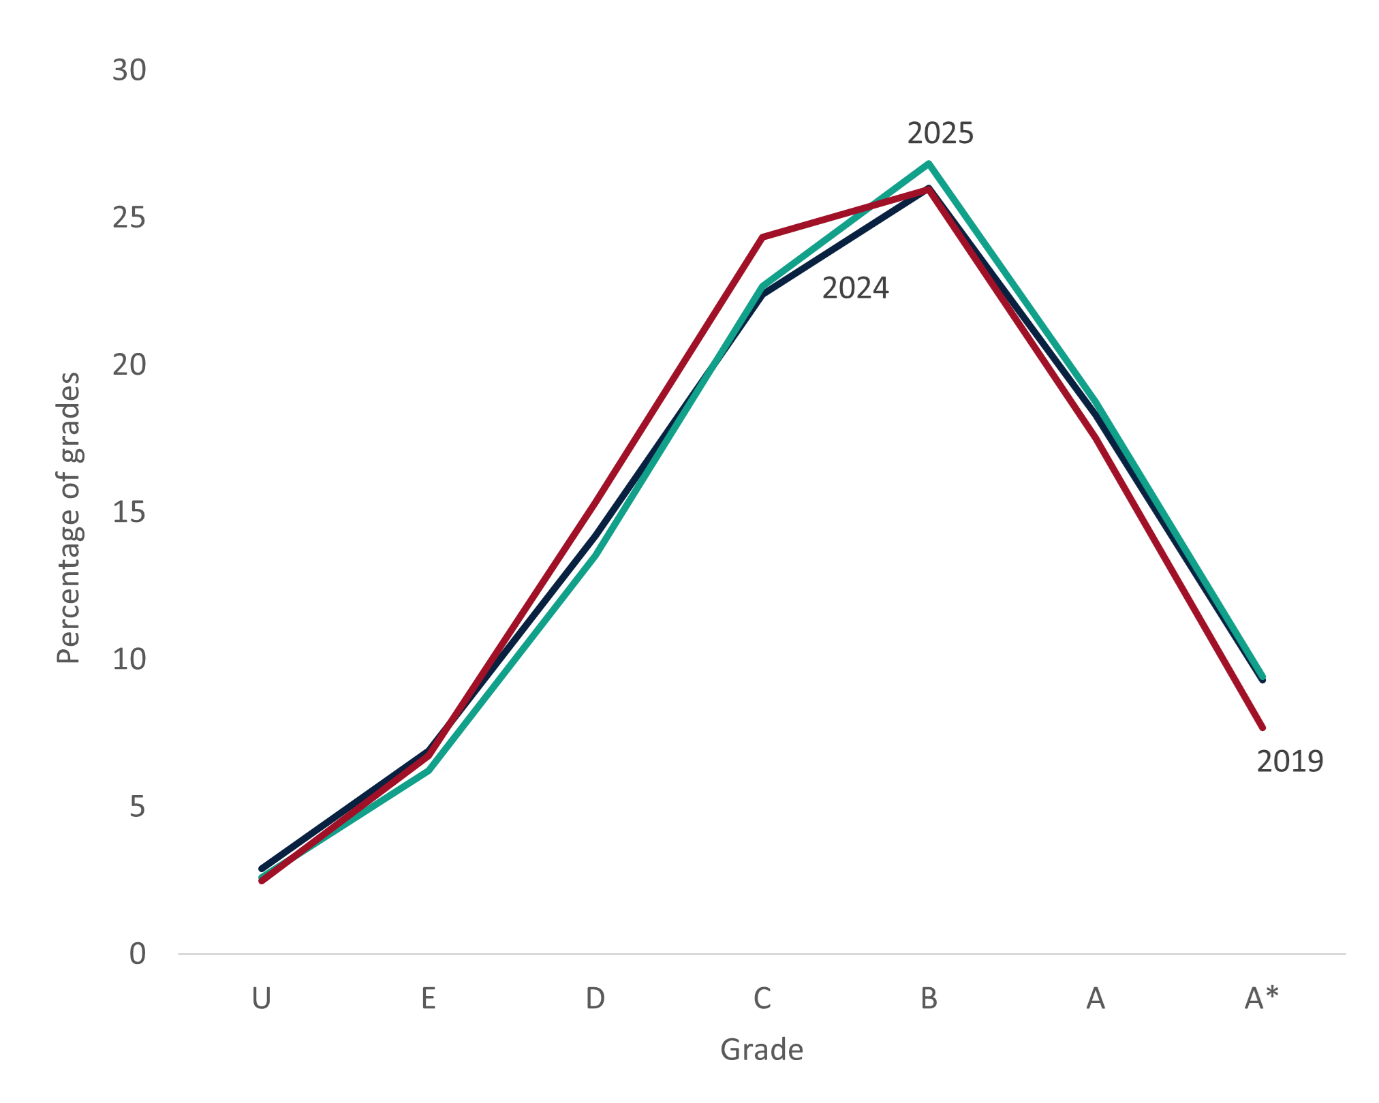
Figure 1 shows that, as expected, the 2025 grading distribution is similar to last year. A slightly higher proportion of A levels were awarded A/A* grades in 2025 (28.2 per cent) compared to 2024 (27.6 per cent) and 2019 (25.2 per cent). More than three quarters (77.7 per cent) of entries were awarded grade C or above, again a slight increase on 2024 (76.0 per cent). Although more students achieved top grades this year, the overall pass rate in 2025 (awarded grade E or above) was only marginally higher than in 2024 (97.4 per cent compared to 97.1 per cent). Compared to 2019, more A levels were awarded grade B, and fewer were awarded grade C and D.
Figure 2: Proportion of A level entries awarded top grades, by centre type
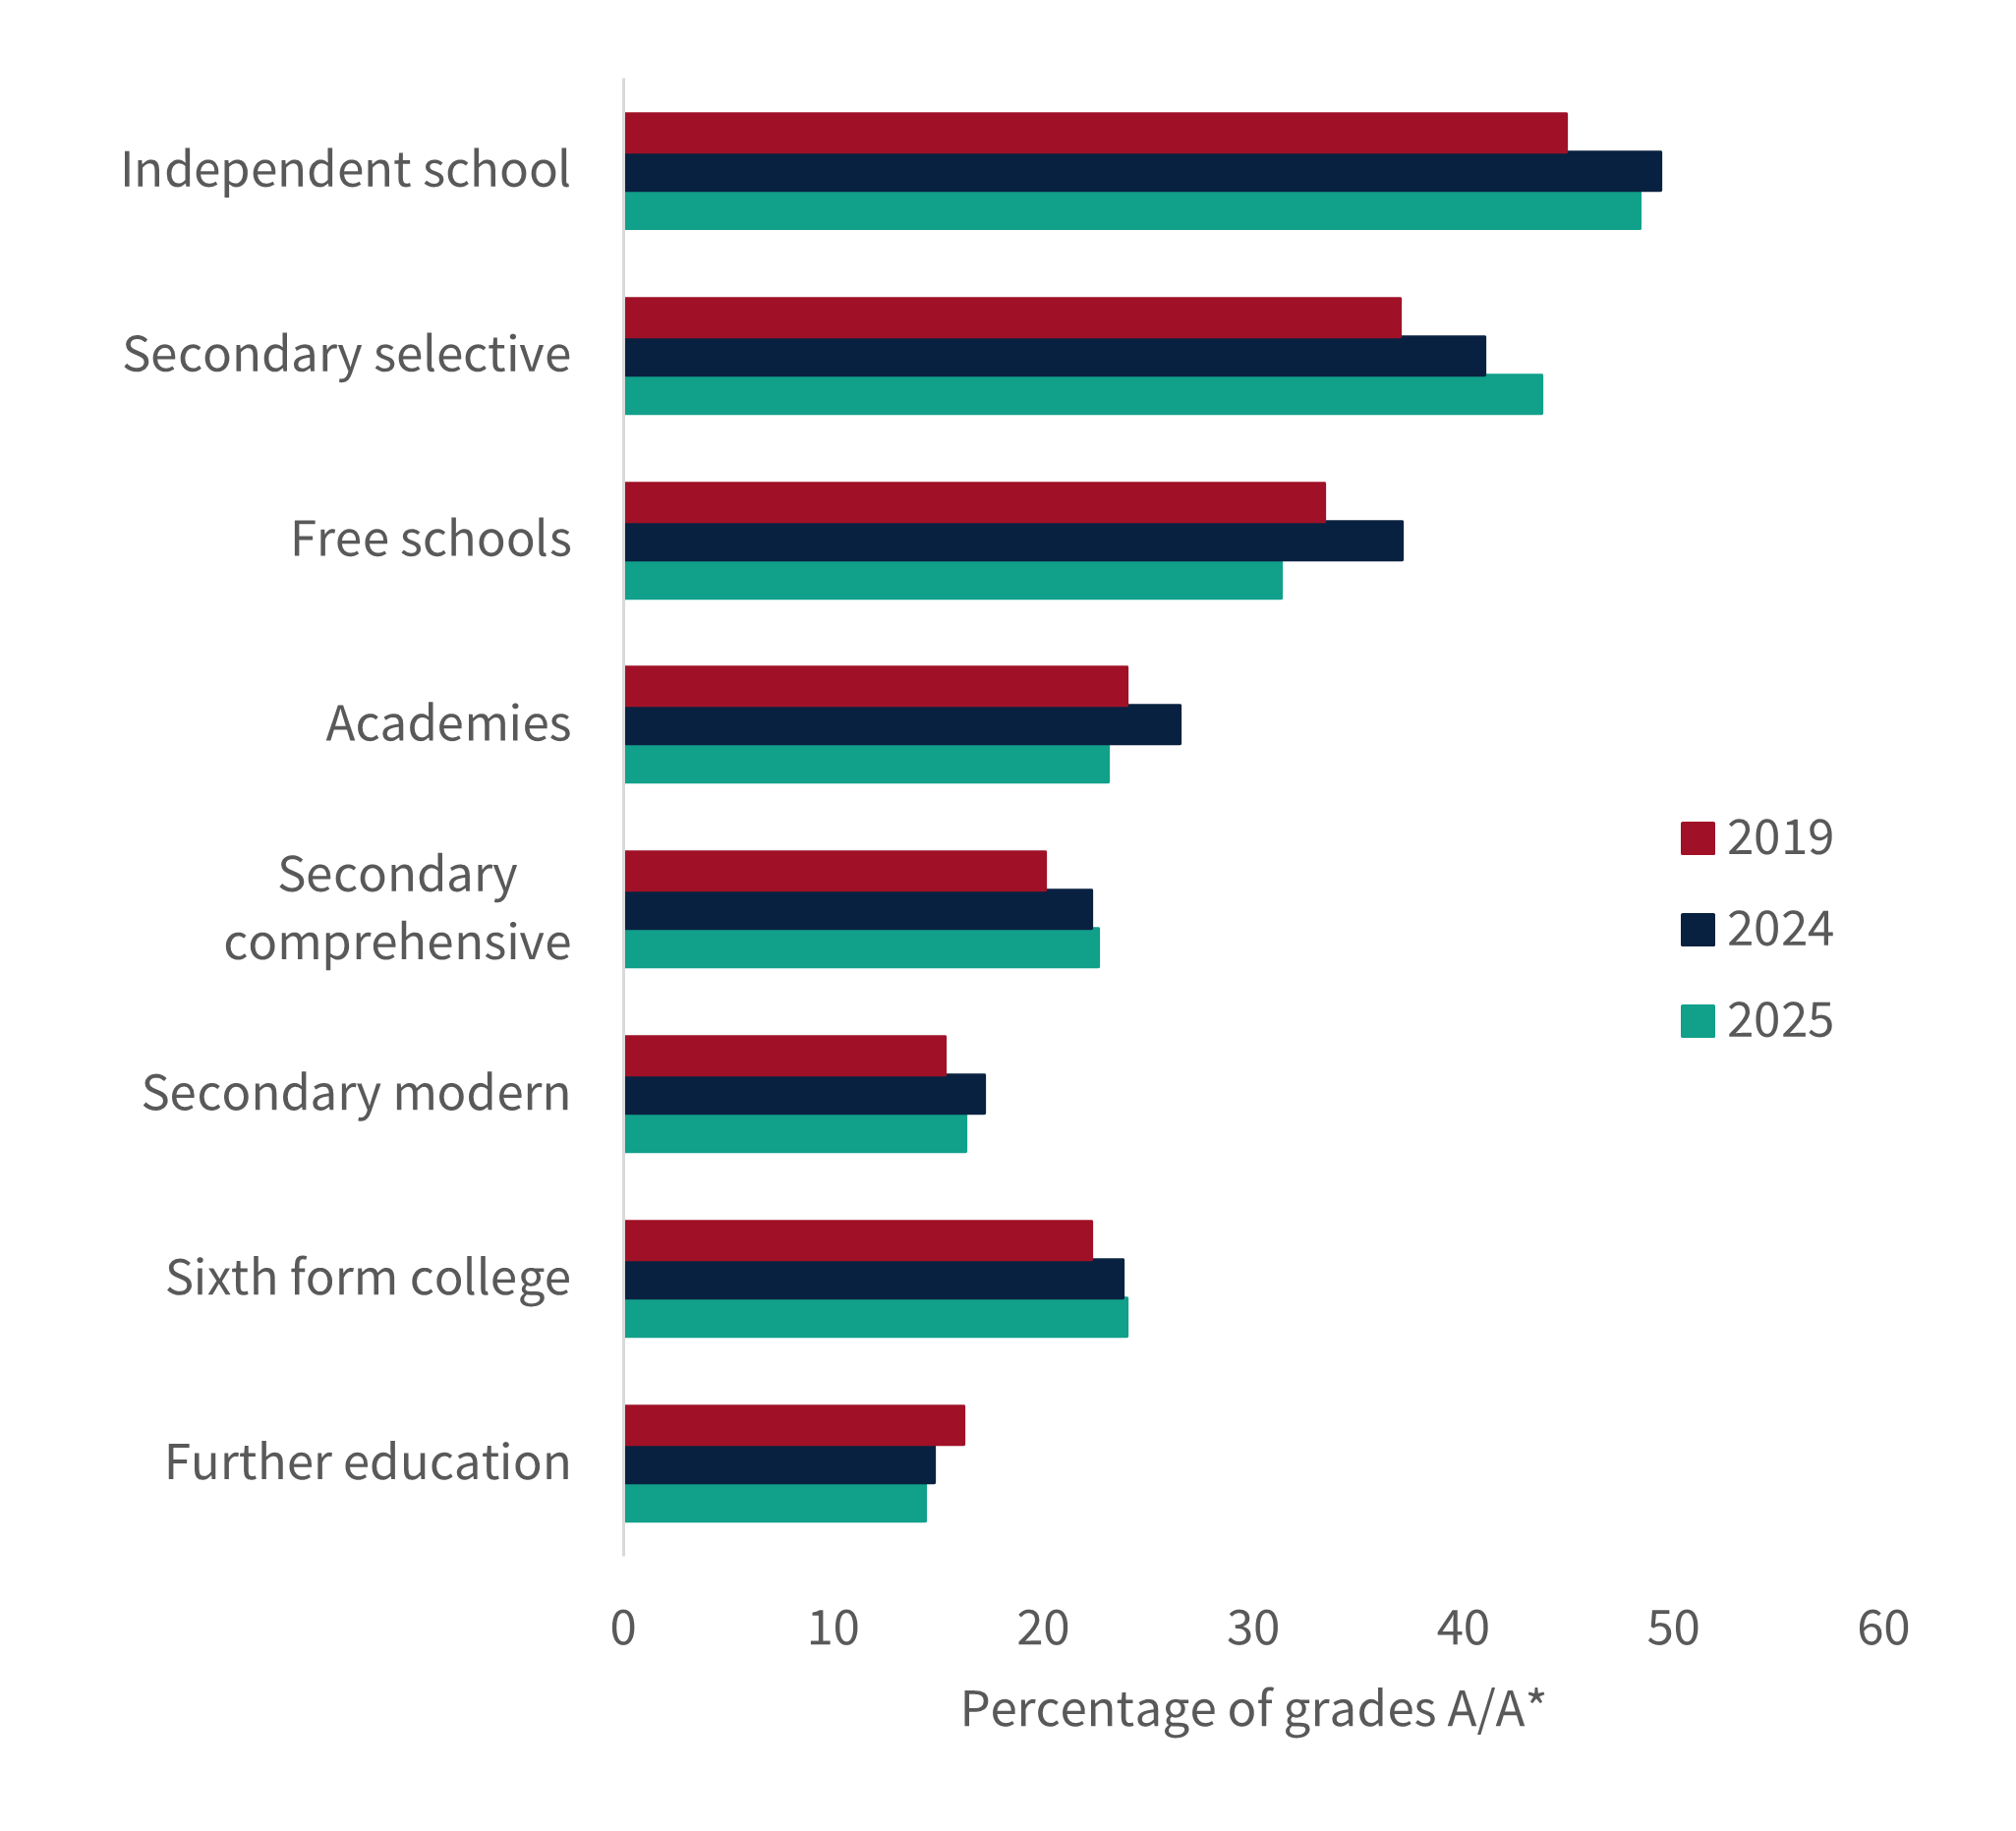
Figure 2 shows the proportion of A levels awarded A or A* grade by centre type. The biggest increase since 2025 was seen in selective secondary schools, from 41.0 to 43.7 per cent, whilst the provider type with the overall highest grades were independent schools, which has consistently been the case in recent years.
In FE colleges, the proportion achieving top grades in 2025 decreased to 14.4 per cent from 14.8 per cent in 2024. This remains below the 2019 proportion of 16.2 per cent.
This variation is likely to be related to the differences in intake between institution types, rather than a simple reflection of quality of provision. Independent and selective schools tend to take on more students with higher prior attainment and far fewer students from economically deprived backgrounds, while FE colleges typically serve a higher proportion of disadvantaged students. A student premium payment, as detailed in our research last year, would help to address the inequality observed between provider types.
Figure 3: Gender gap in A level grades
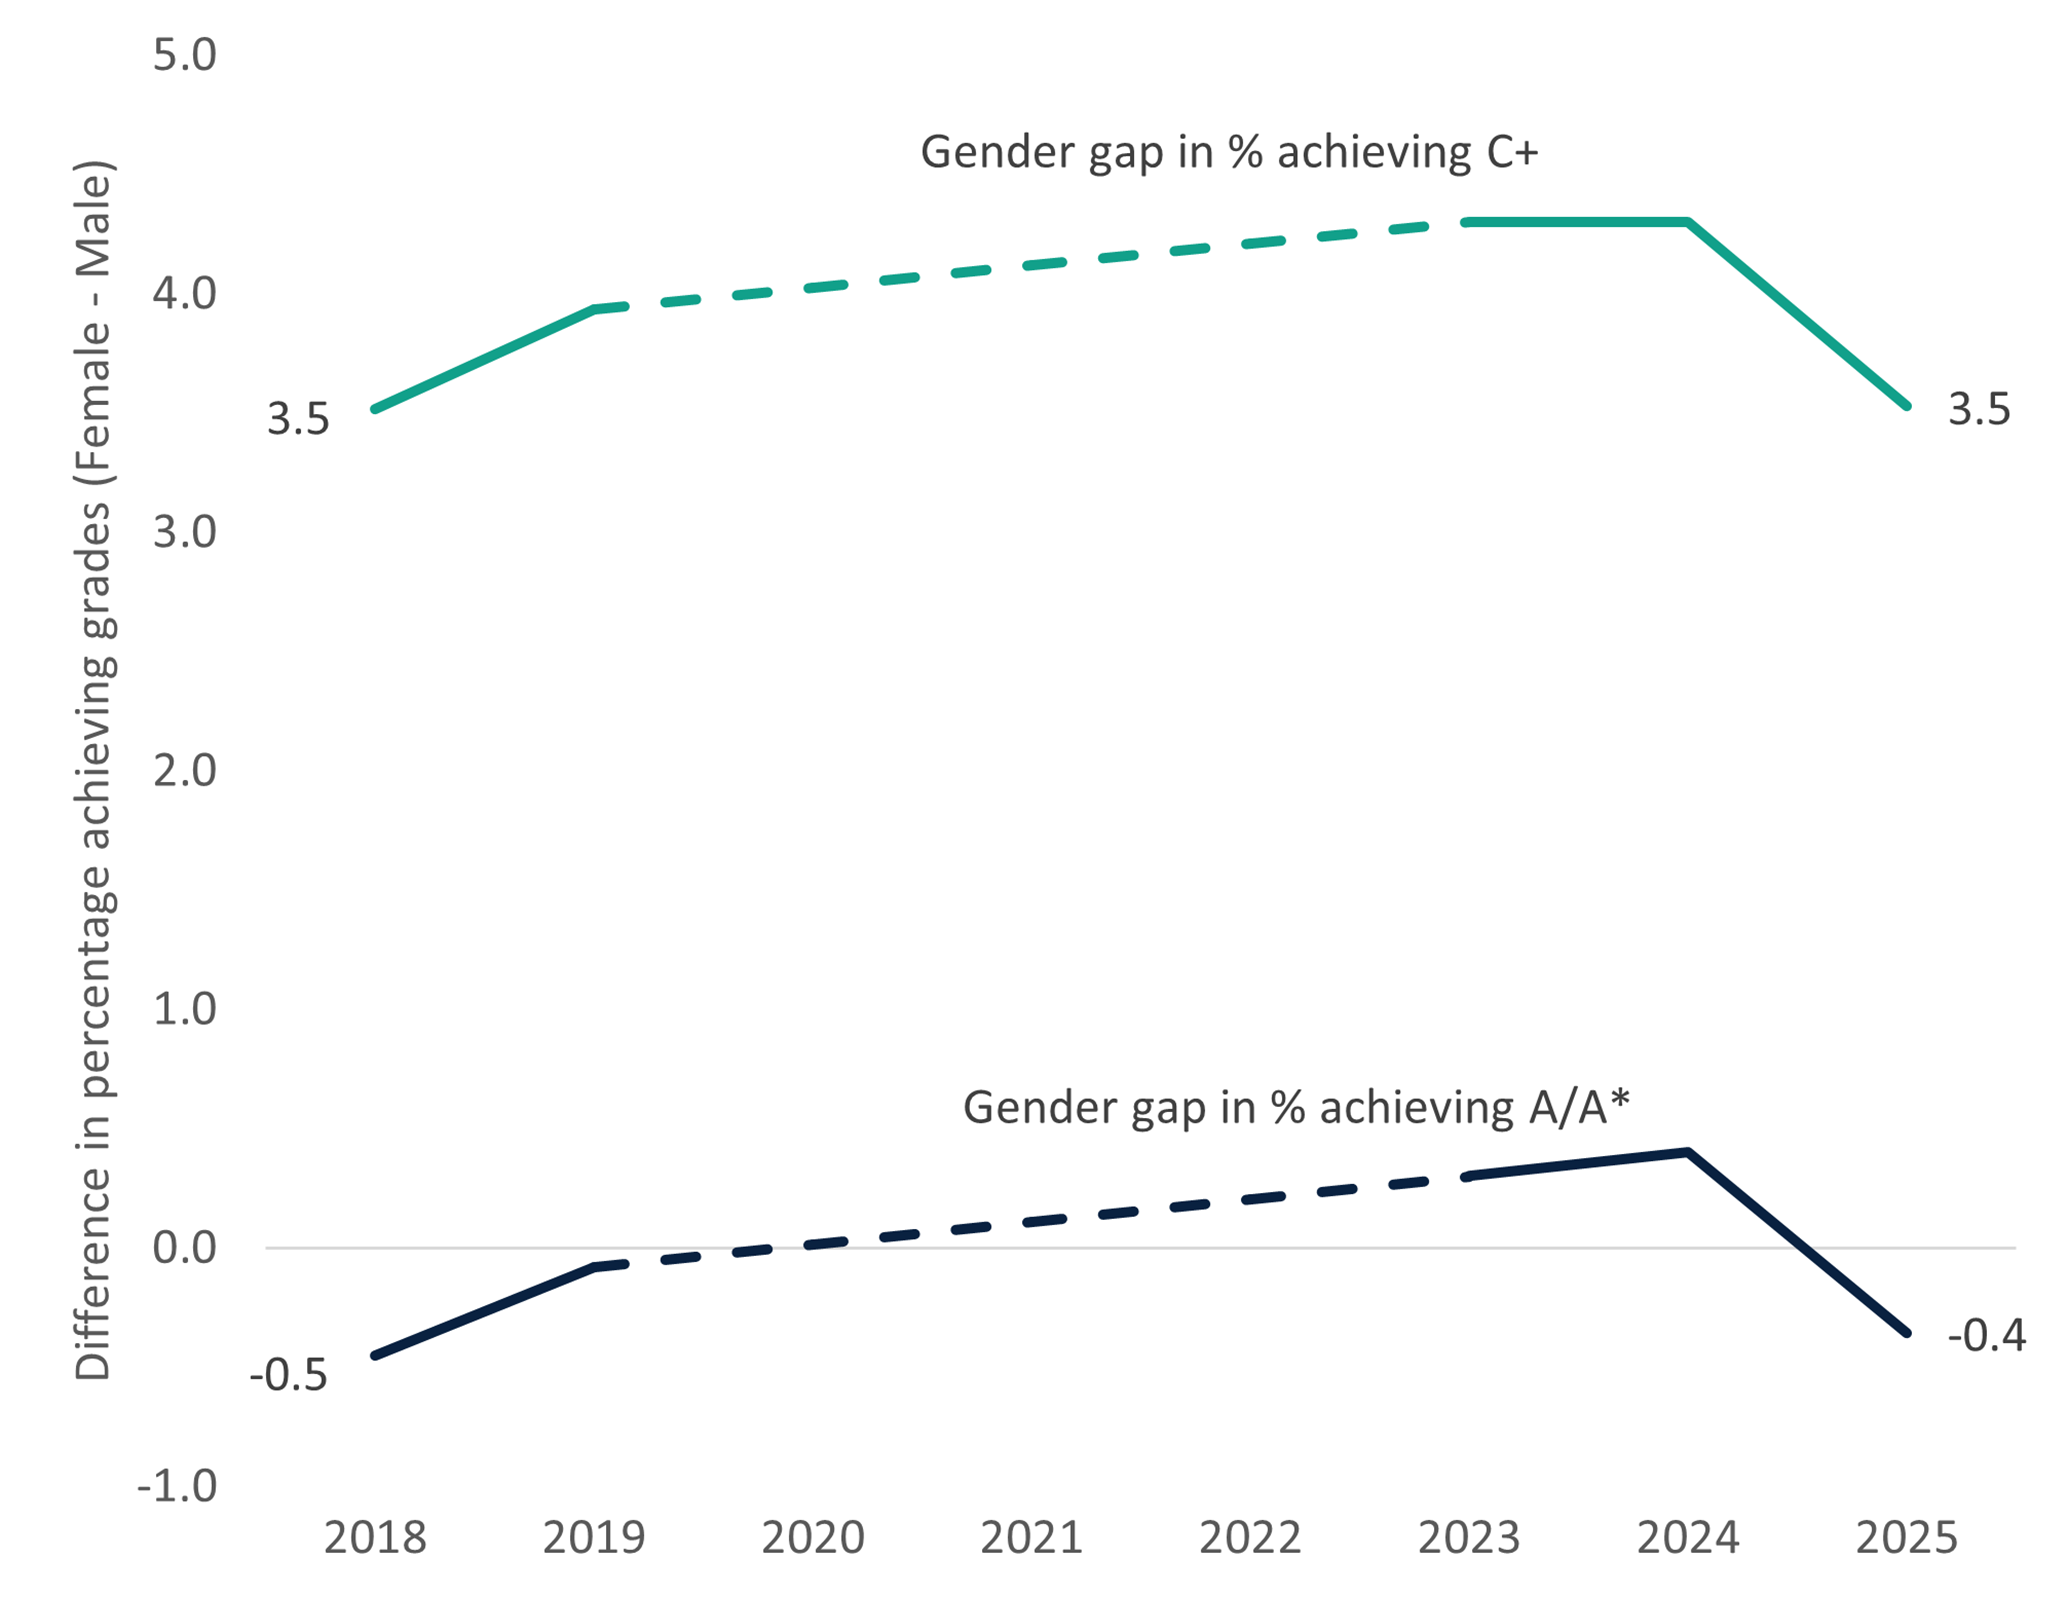
Figure 3 shows that although gender gaps initially widened since the pandemic in favour of female students, this trend has since reversed. Female students were 3.5 percentage points more likely to be awarded grade C or above in 2025. However, male students were more likely to be awarded top grades. The gender gaps in 2025 were similar to those observed before the pandemic.
The narrowing of the gender gap we see in 2025 was driven by increased grades (on average) for all students, which were slightly larger for males.
Figure 4: The A level gender gap: attainment and entries in 2025
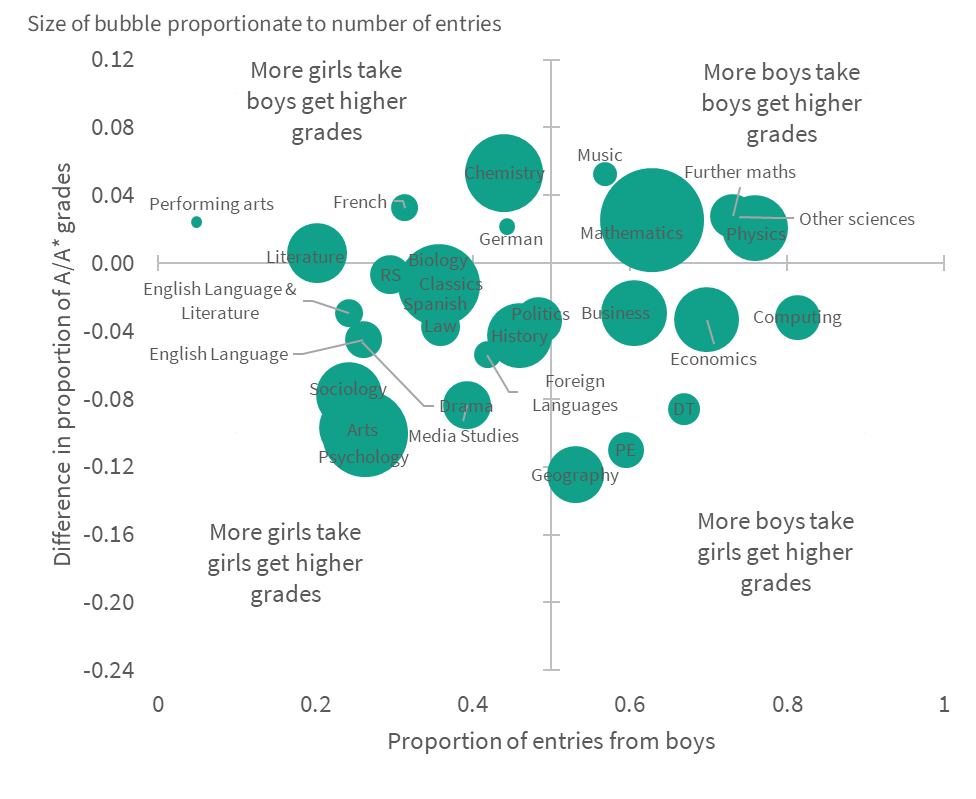
Figure 4 shows that the subjects most commonly entered by male students are not necessarily the ones where they achieve higher grades, and vice versa. The top left and bottom right quadrants show the subject areas where this is the case.
Subjects such as economics, computing and business were more commonly entered by male students in 2025, however female students were more likely to achieve top grades. This pattern is similar to 2024.
Conversely, subjects such as Chemistry, French and German were more commonly entered by female students, but male students were more likely to be awarded top grades.
Overall, there are more subjects (68 per cent) where female students achieve the higher proportion of top grades.
Students taking level 3 technical and vocational qualifications also received their results today, including the fourth cohort of T level students. These new qualifications were designed as high-status technical alternatives to A levels.
The fourth cohort of T level students began their qualifications in 2023. Of the 16,085 students that began a T level two years ago, 11,909 students completed their T level and received a grade today (74 per cent). This is a continuing improvement in the retention rate for T levels, rising from 66 per cent in 2023 to 71 per cent in 2024 and now 74 per cent in 2025 (figure 5).
This brings the T level retention closer to the retention rate for similar sized alternative vocational and technical qualifications (78 per cent in 2024). This is a positive sign for the qualification that has struggled with low student retention during the early stages of the rollout. However, T level retention is still significantly lower than students taking 3 or more A levels (the academic “equivalent” of T levels), where retention sat at 90 per cent last year.
Figure 5: Retention rates of T levels over time
Retention rates differ considerably across T level pathways. Figure 6 shows the retention rates by pathway over the last two cohorts. Most existing pathways saw improvements in their retentions rate. The exception to this was the construction pathway which saw a decline in retention (moving from 71 per cent to 68 per cent).
Encouragingly, the health and science route saw continued improvements in retention – this is important progress for the pathway that had one of the lowest recorded retention rates in its first year.
Retention rates remain the highest in the digital pathway (82 per cent) and the lowest retention was observed in the new agriculture and animal care pathway. This highlights that new T levels are continuing to have retention issues in their first cohort of delivery.
Figure 6: Retention rates of T levels by pathway
As shown in figure 6, the number of 18-year-olds applying for higher education courses from England has reached an all-time high this year, up slightly from the previous record in 2022, when changes to examinations as a result of the COVID pandemic resulted in considerable growth to student numbers.
The continued increase in the size of the 18-year-old population, however, has meant the application rate – the proportion of 18-year-olds who apply to university – has decreased for the third year in a row. Although university application rates peaked in the pandemic, they are still considerably higher than they have been for most of the last decade.
University applications and offers
Figure 7: 18-year-olds UCAS applications, England
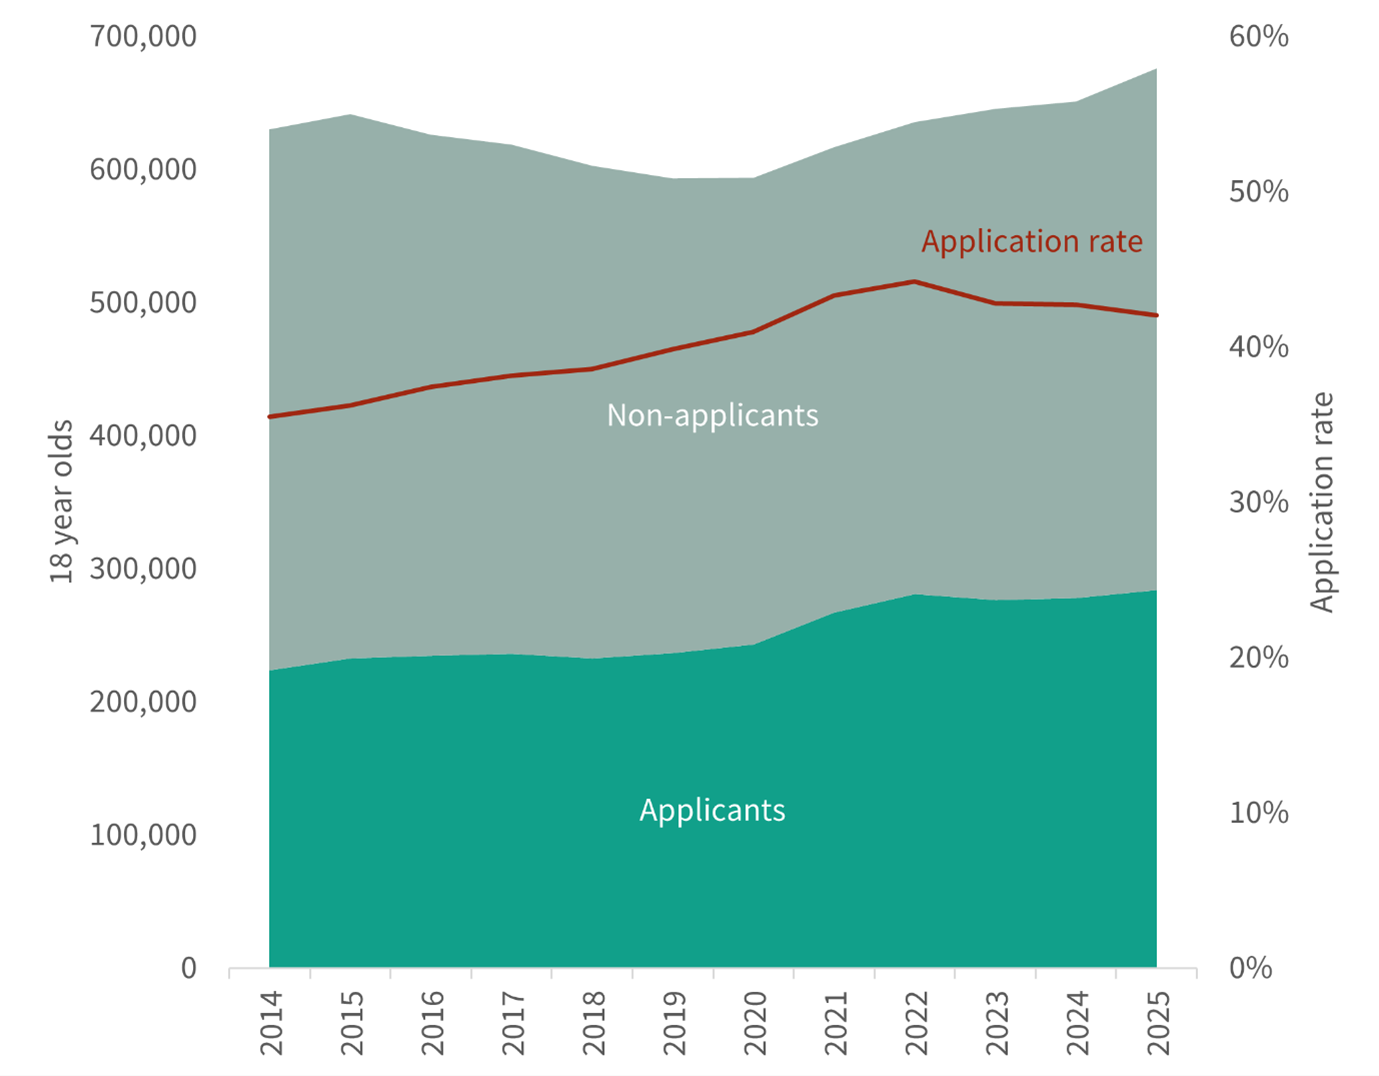
NB: Total applicant numbers in figures 7-11 include all applications made through UCAS. This constitutes the overwhelming majority of students in England, Wales, and Northern Ireland, but does not include around one third of young full-time students in Scotland.
As shown in figure 7, the number of 18-year-olds applying for higher education courses from England has reached an all-time high this year, up slightly from the previous record in 2022, when changes to examinations as a result of the COVID pandemic resulted in considerable growth to student numbers.
The continued increase in the size of the 18-year-old population, however, has meant the application rate – the proportion of 18-year-olds who apply to university – has decreased for the third year in a row. Although university application rates peaked in the pandemic, they are still considerably higher than they have been for most of the last decade.
Figure 8: UCAS applications for UK nations and international students, all ages
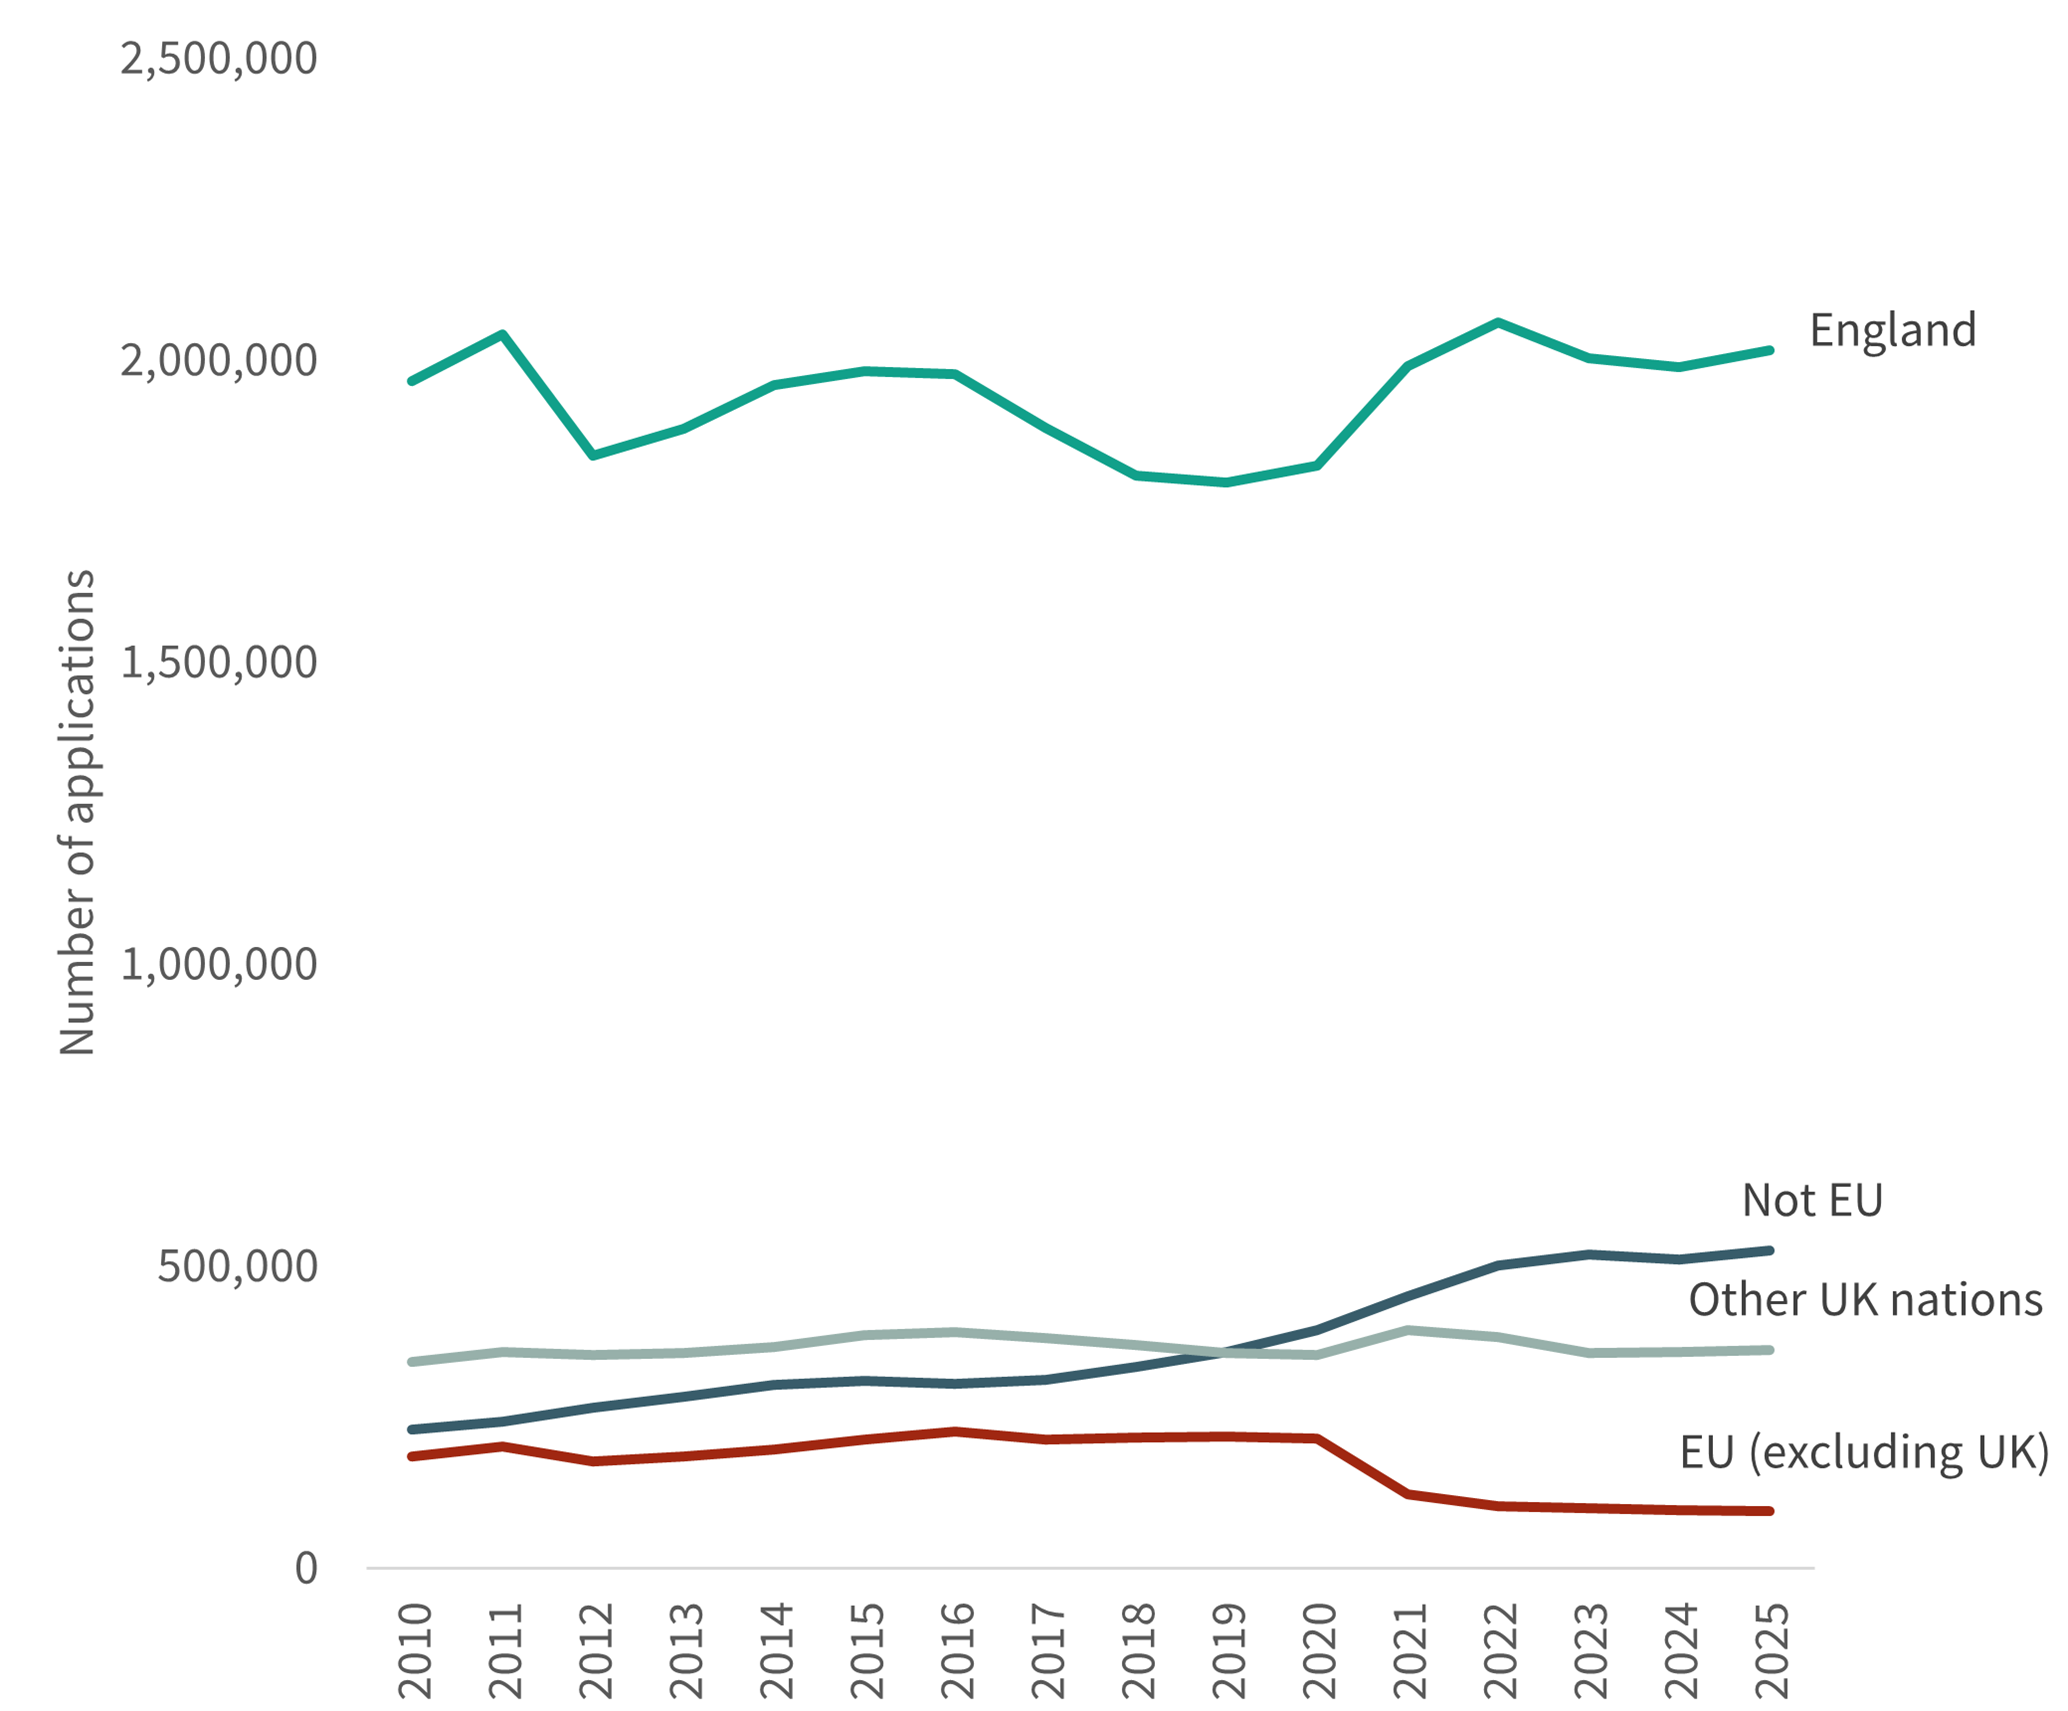
Figure 8 shows the end-of-cycle (including clearing) acceptance rate by provider tariff group (a categorisation based on the average number of UCAS points held by entrants) up to 2024.
2024 saw a growth in the high tariff acceptance rate, meaning a greater proportion of students who applied to these universities ended up having their offer accepted. This jump in acceptance puts the rate back at similar levels to 2021, following the large rise in acceptances in the height of the pandemic, when student caps were temporarily lifted in some subjects. Growth was also seen in medium tariff acceptance rates, which have climbed steadily since 2010, and little change in the high acceptance rates for lower-tariff providers.
Last year’s higher-tariff rise also coincided with uncertainty around international student numbers, which left these institutions aiming to increase their share of domestic students in response.
Figure 9: Acceptance rate by provider tariff (all ages, all UK nations and international students)
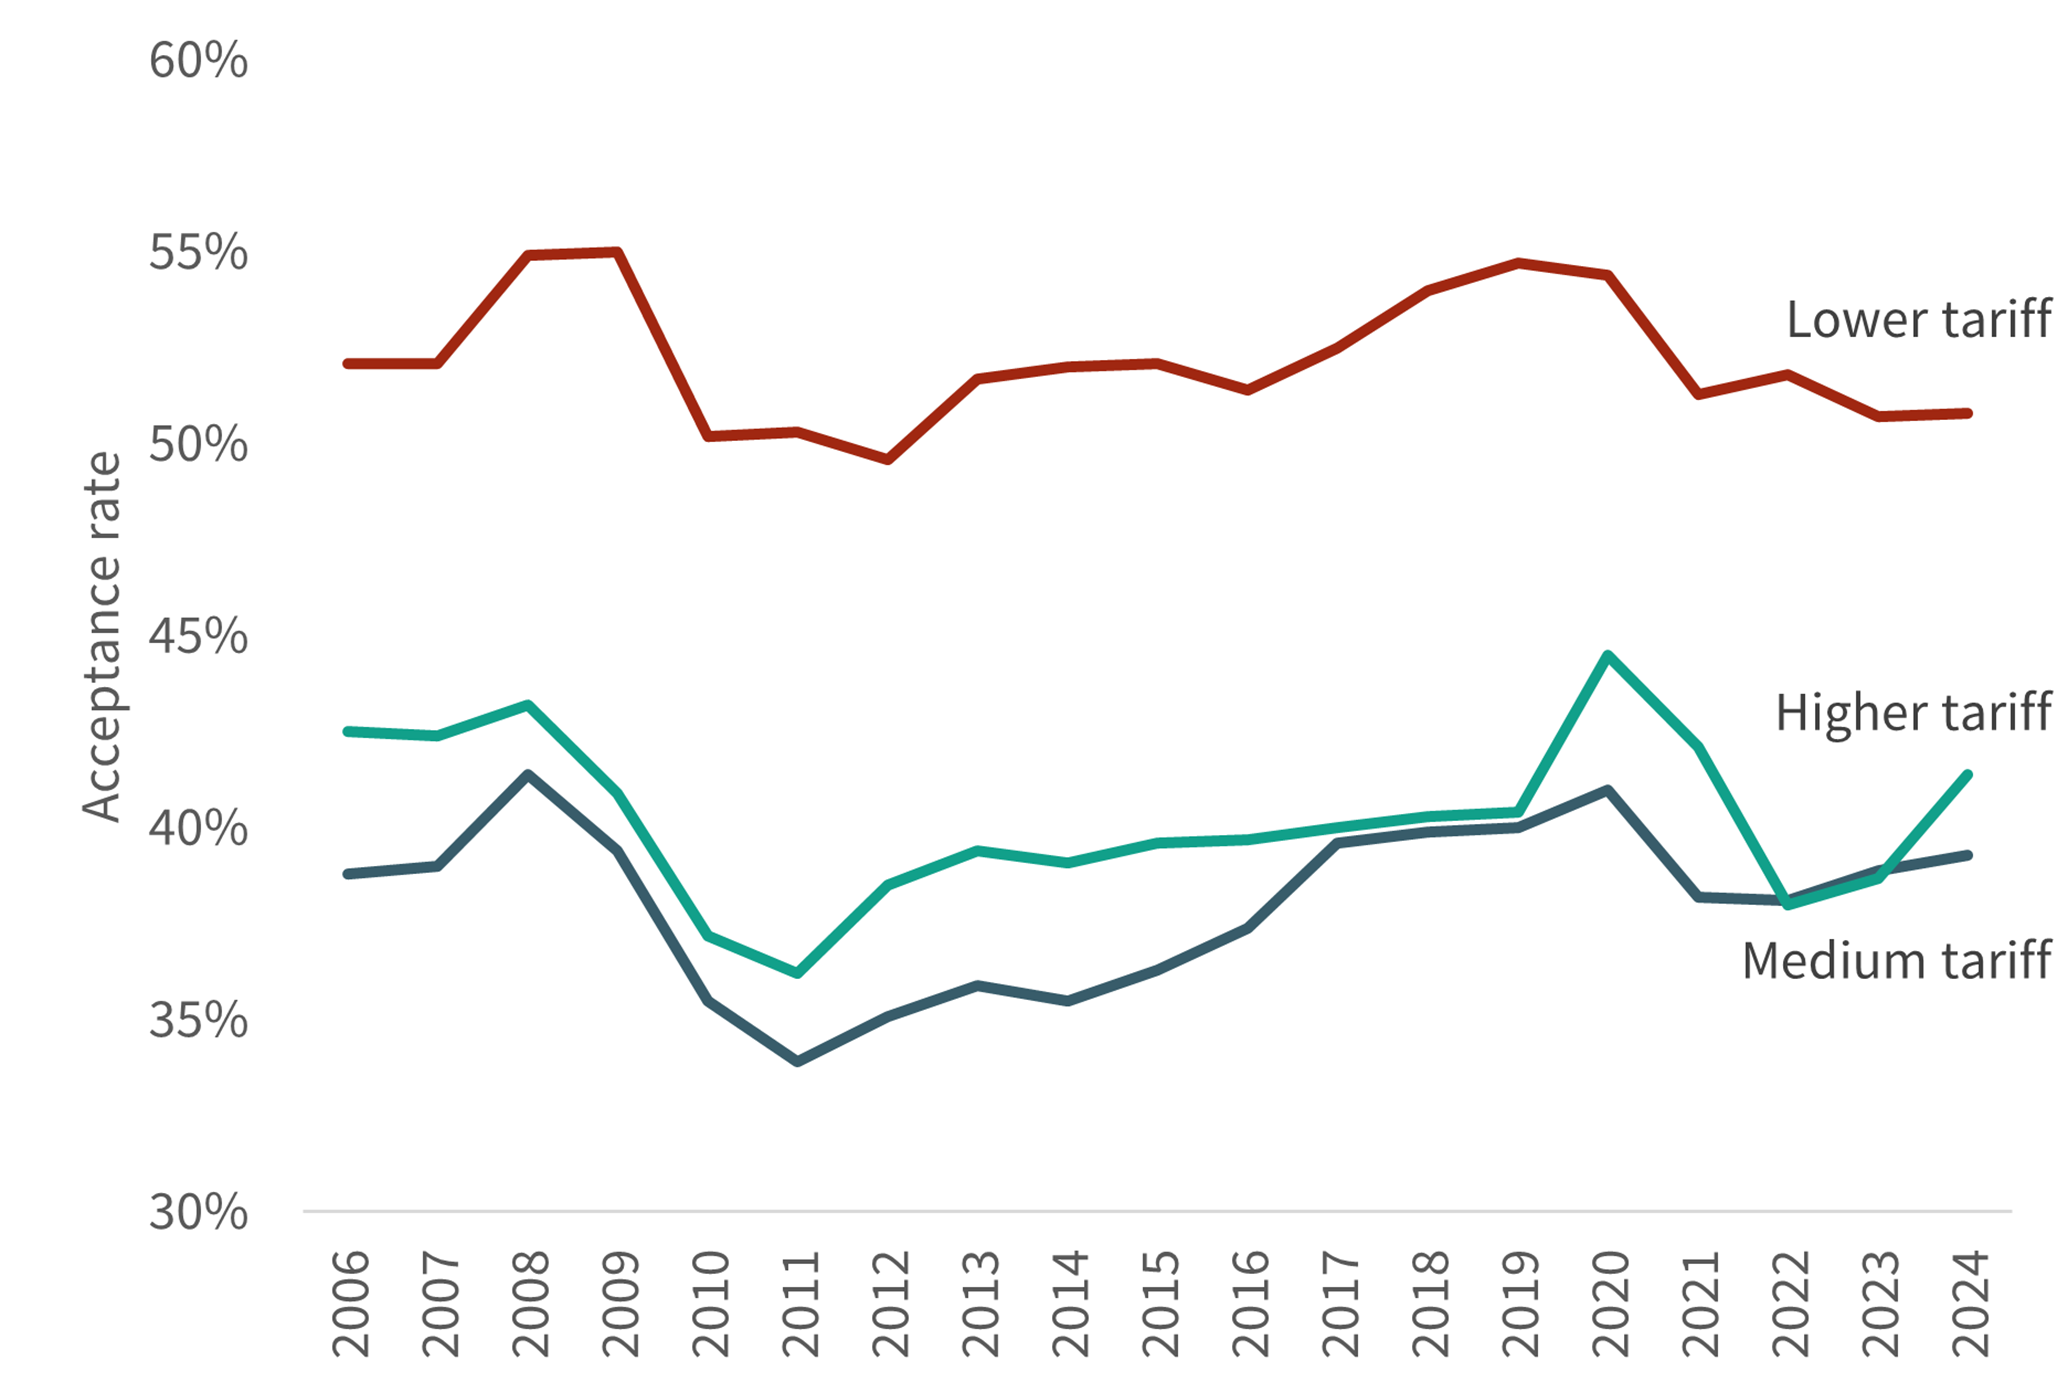
Figure 9 shows the end-of-cycle (including clearing) acceptance rate by provider tariff group (a categorisation based on the average number of UCAS points held by entrants) up to 2024.
2024 saw a growth in the high tariff acceptance rate, meaning a greater proportion of students who applied to these universities ended up having their offer accepted. This jump in acceptance puts the rate back at similar levels to 2021, following the large rise in acceptances in the height of the pandemic, when student caps were temporarily lifted in some subjects. Growth was also seen in medium tariff acceptance rates, which have climbed steadily since 2010, and little change in the high acceptance rates for lower-tariff providers.
Last year’s higher-tariff rise also coincided with uncertainty around international student numbers, which left these institutions aiming to increase their share of domestic students in response.
Figure 10: Offer rate by provider tariff (all ages, all UK nations and international students)
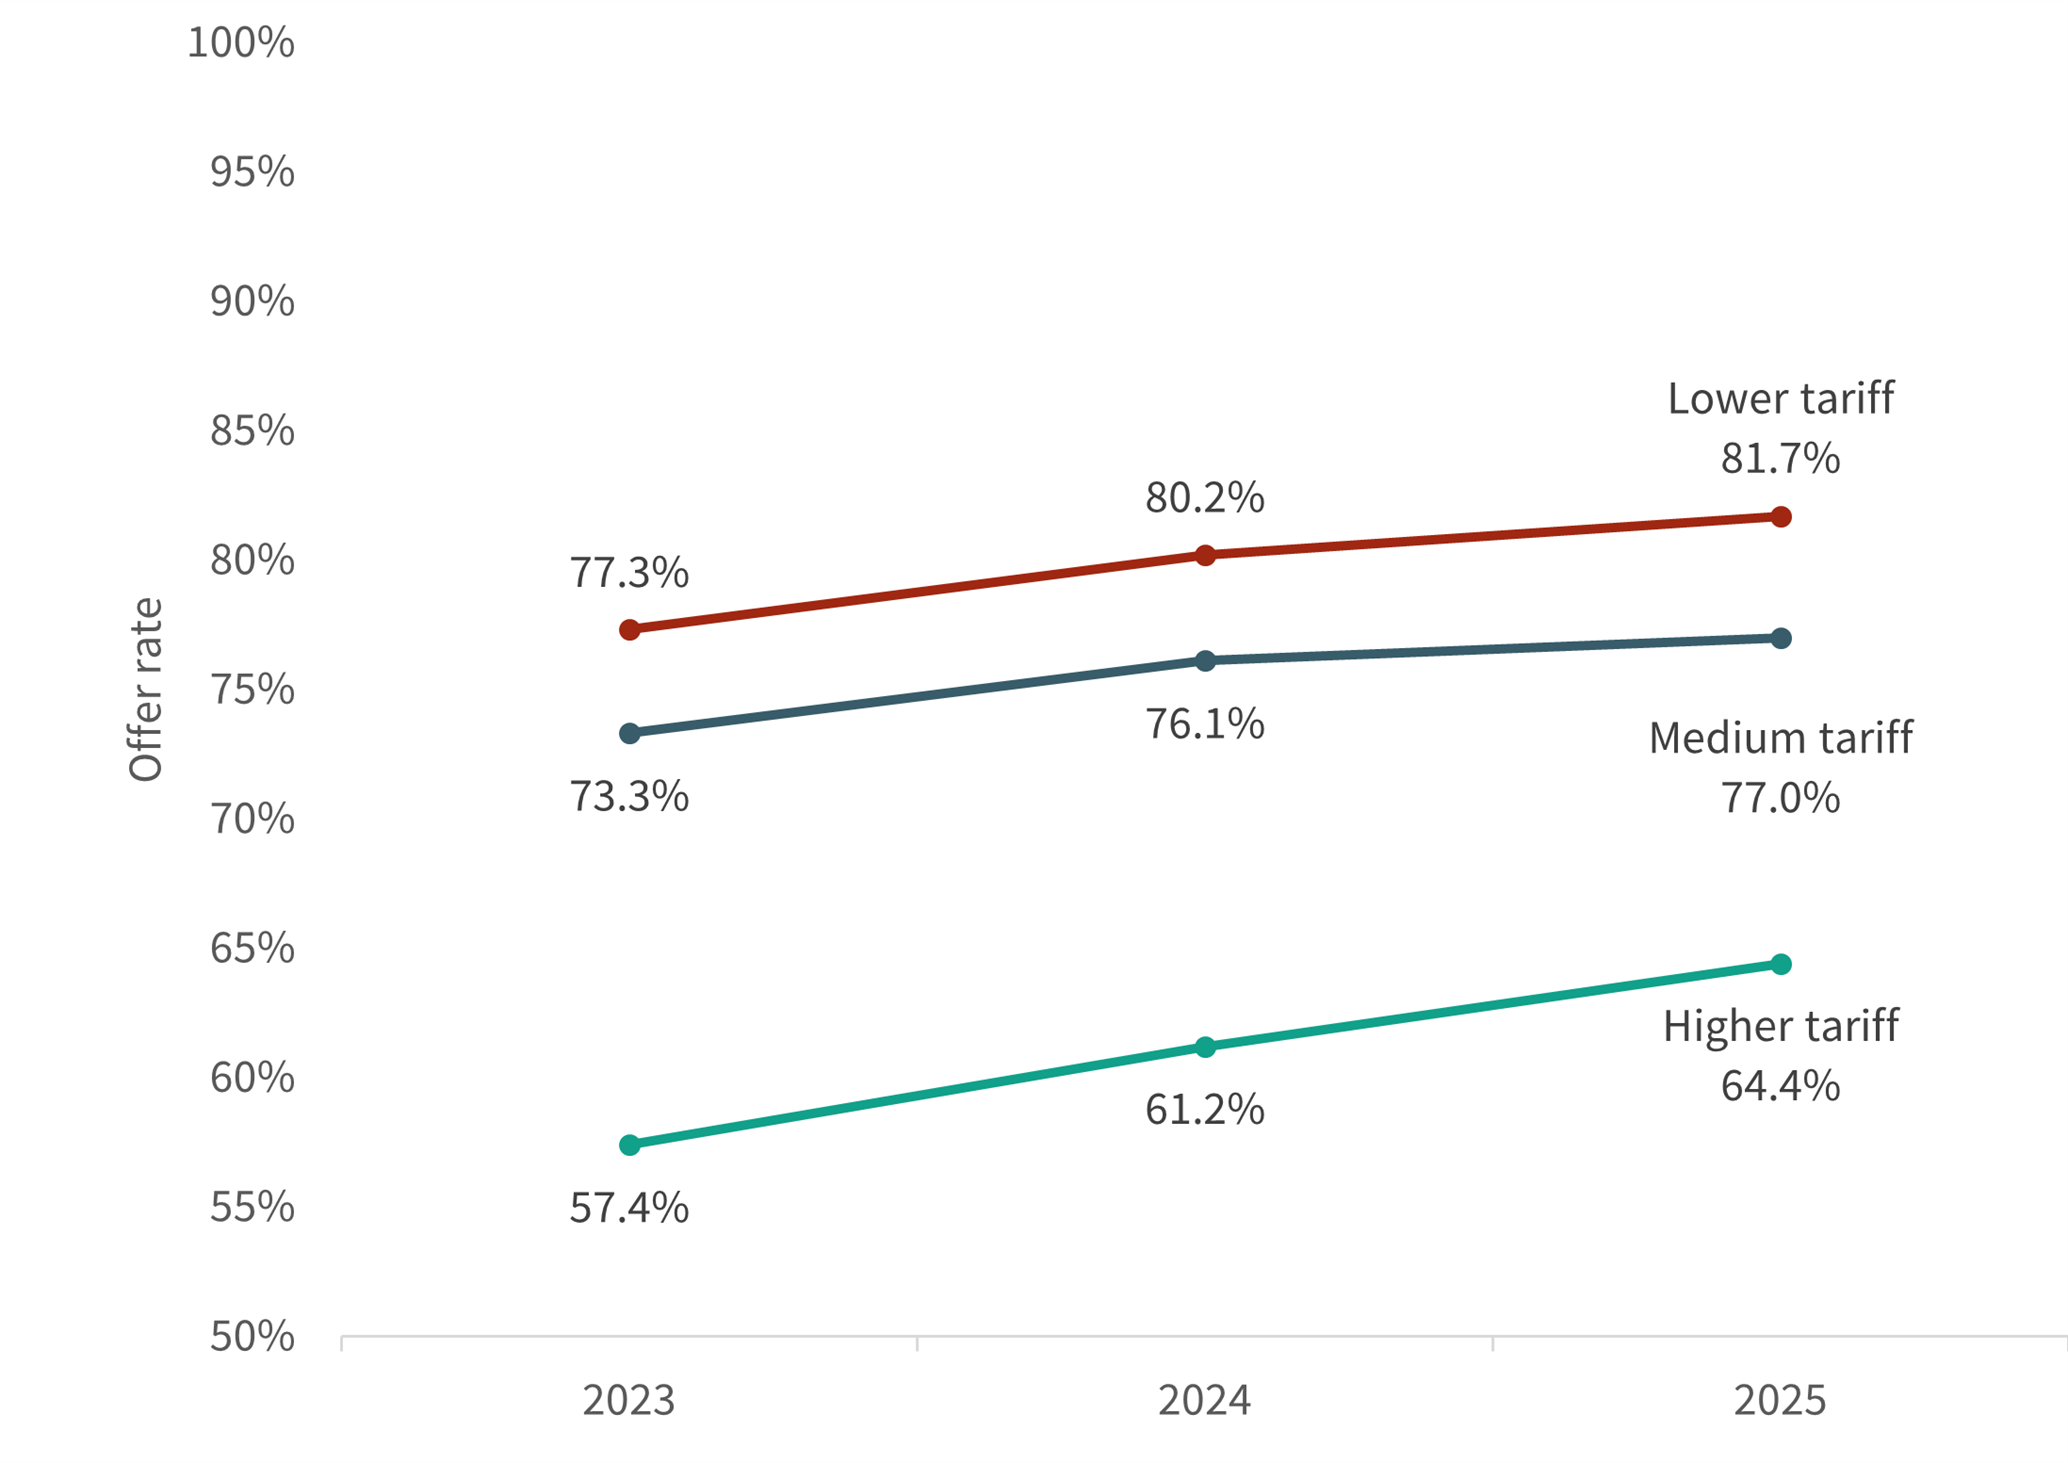
Early signs suggest this trend may continue, with UCAS data showing across-the-board rises in offer rates, particularly in higher-tariff providers. Figure 10 shows this rate over the past three years, with the higher-tariff rate having jumped from 57.4 per cent in 2023 to 64.4 per cent in 2025. Such increases in offer numbers are usually associated with increases in acceptances, meaning that students applying to high-tariff universities are more well-placed to secure their spot this year.
Figure 11: 18-year-olds UCAS application rates by English region
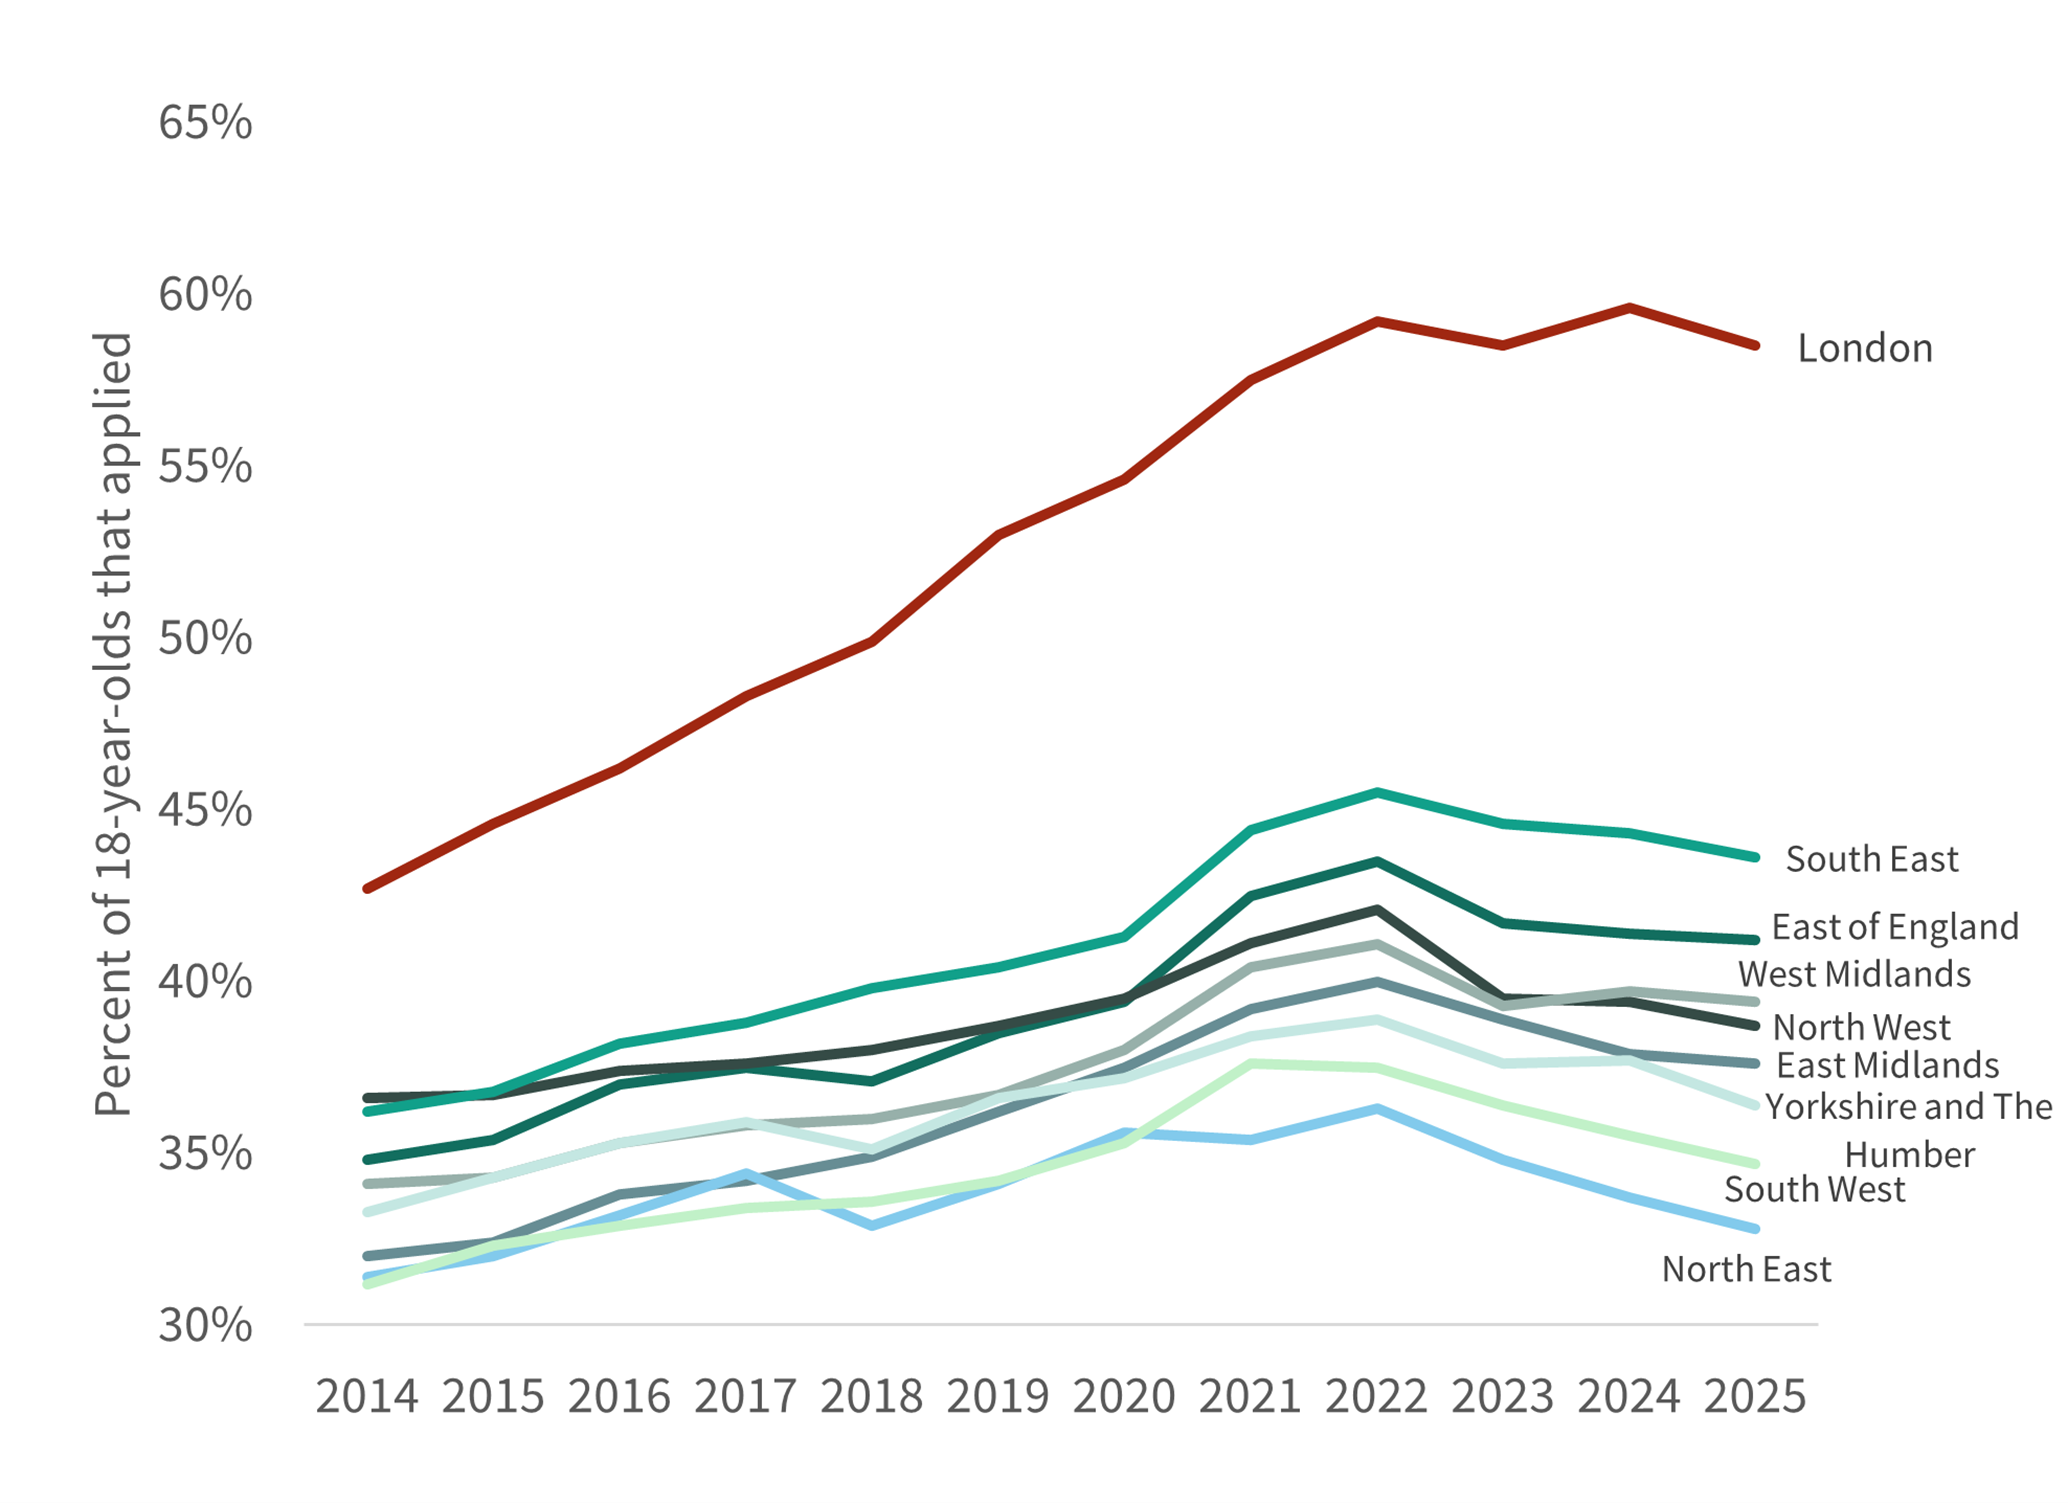
Figure 11 shows a breakdown of the application rate among 18-year-olds from different regions over the past decade.
All regions saw an increase in applications through the pandemic. These increases have largely subsided, but application rates in 2025 were still higher than they were in 2019 across all regions except the North East.
While this trend persists across all regions in England, variations in the degree of this growth have produced increasing regional inequalities.
There is a significant disparity between application rates among students coming from London and their counterparts in all other English regions. In 2024, London bucked the national trend and saw its application rate grow despite falls in all other regions of England. This year however, the trend has reversed: London has seen the second largest fall in acceptance rate (behind Yorkshire and the Humber), while other regions experienced a more modest decline.
Despite this shift, the gap between application rates from London and the North East, which had the lowest application rate, remains large; it has increased from 19 per cent in 2019 to 26 per cent in 2025.