The Education Policy Institute (EPI) has published a major report, funded by the Nuffield Foundation, on the disadvantage gap in education.
“The disadvantage gap” – the gap in grades between disadvantaged students and their peers – is a leading measure of social mobility in England and an indicator of the government’s progress in reducing inequalities in education.
The report examines the gap in 2020 at a national level, across different regions and local authorities, among varying levels of disadvantage, and at two stages of education – key stage four and five.
The research offers the first comprehensive picture of the impact of 2020 grades on different students – the year that saw the first switch to teacher assessed grades.
The study finds that:
- The gap in GCSE grades between students in long-term poverty and their better off peers has failed to improve over the last ten years.
- More students have now fallen into longer-term poverty.
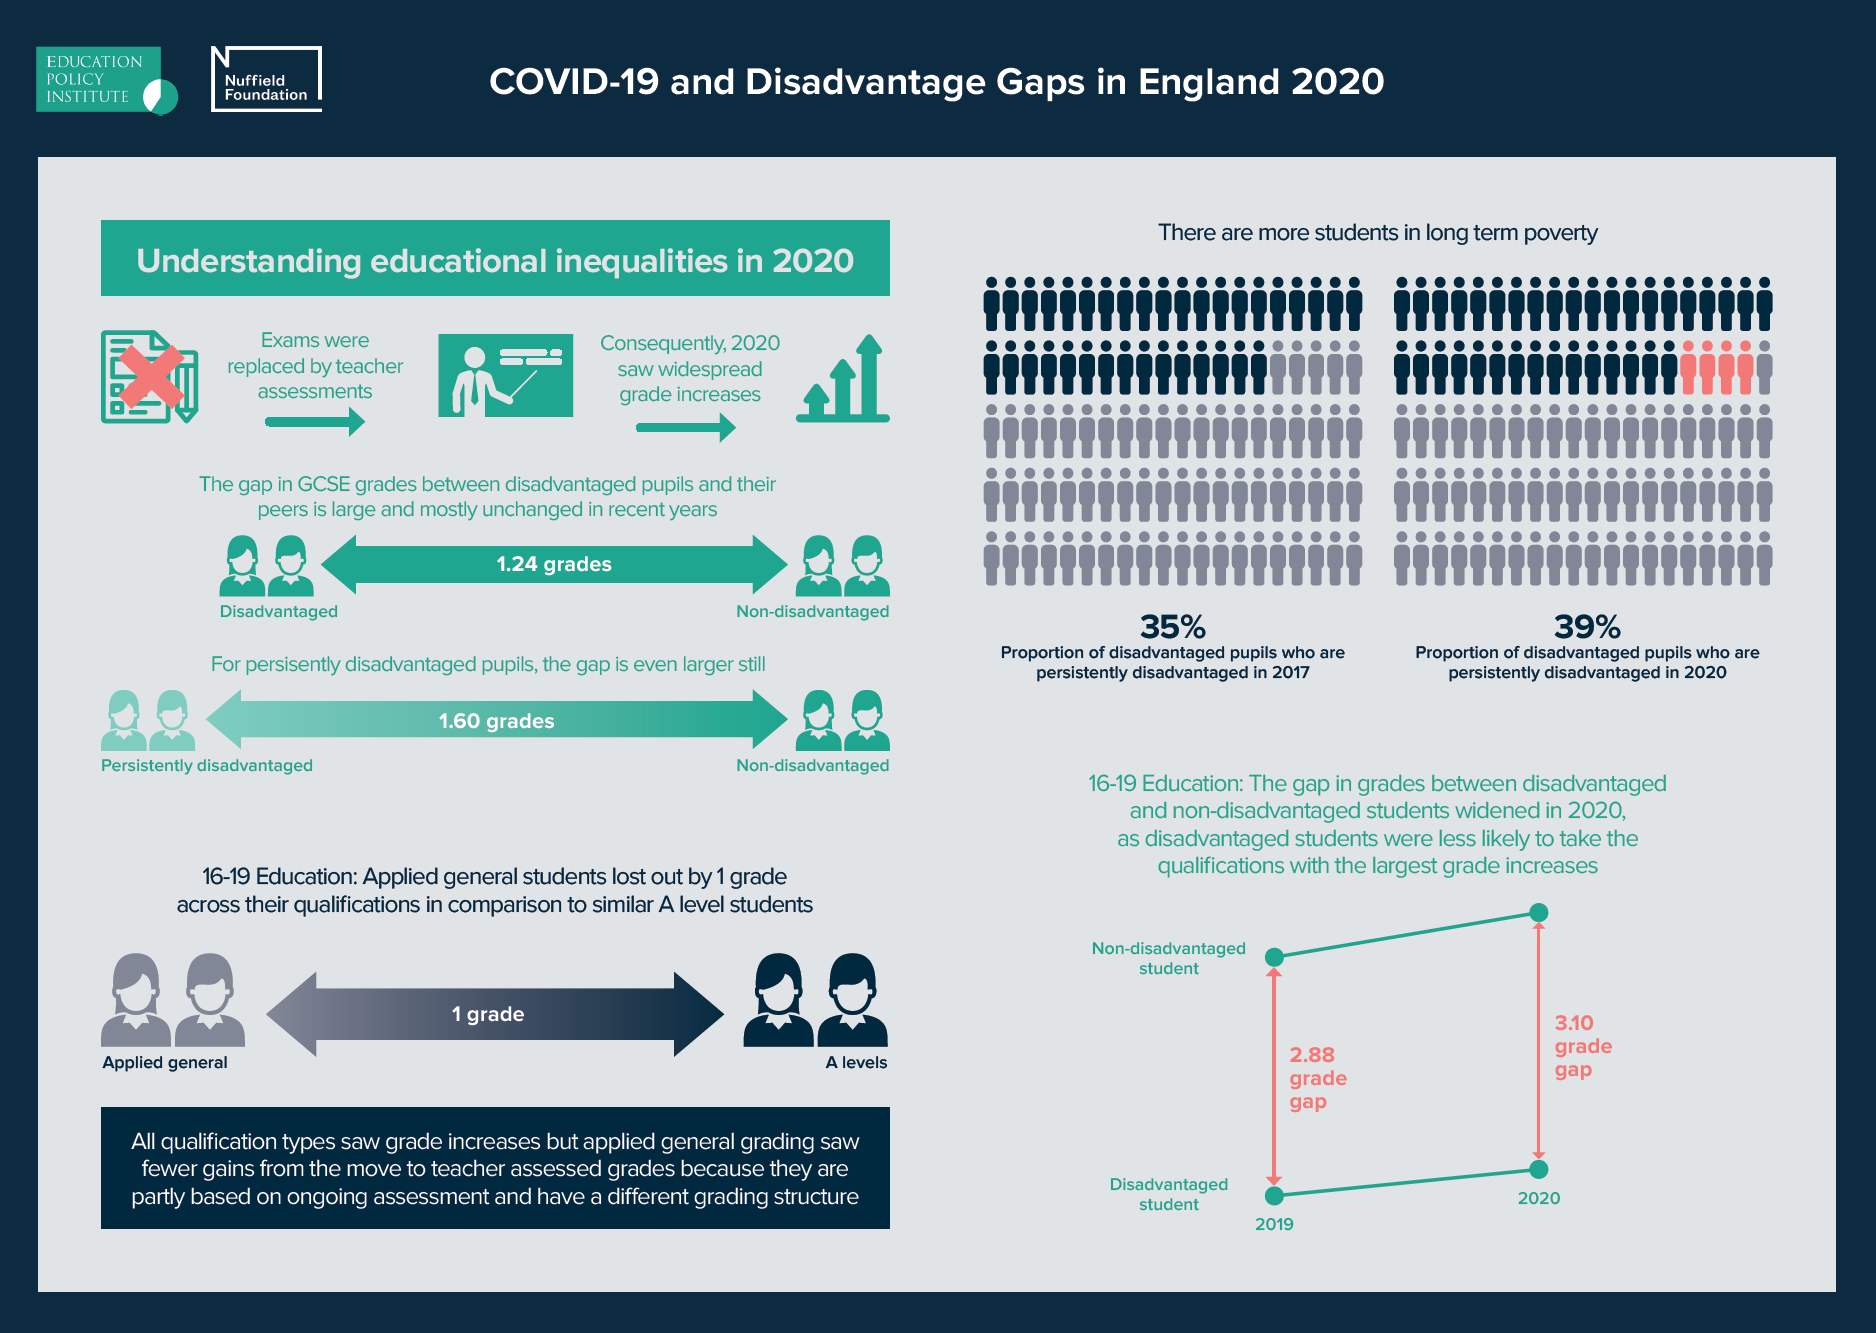
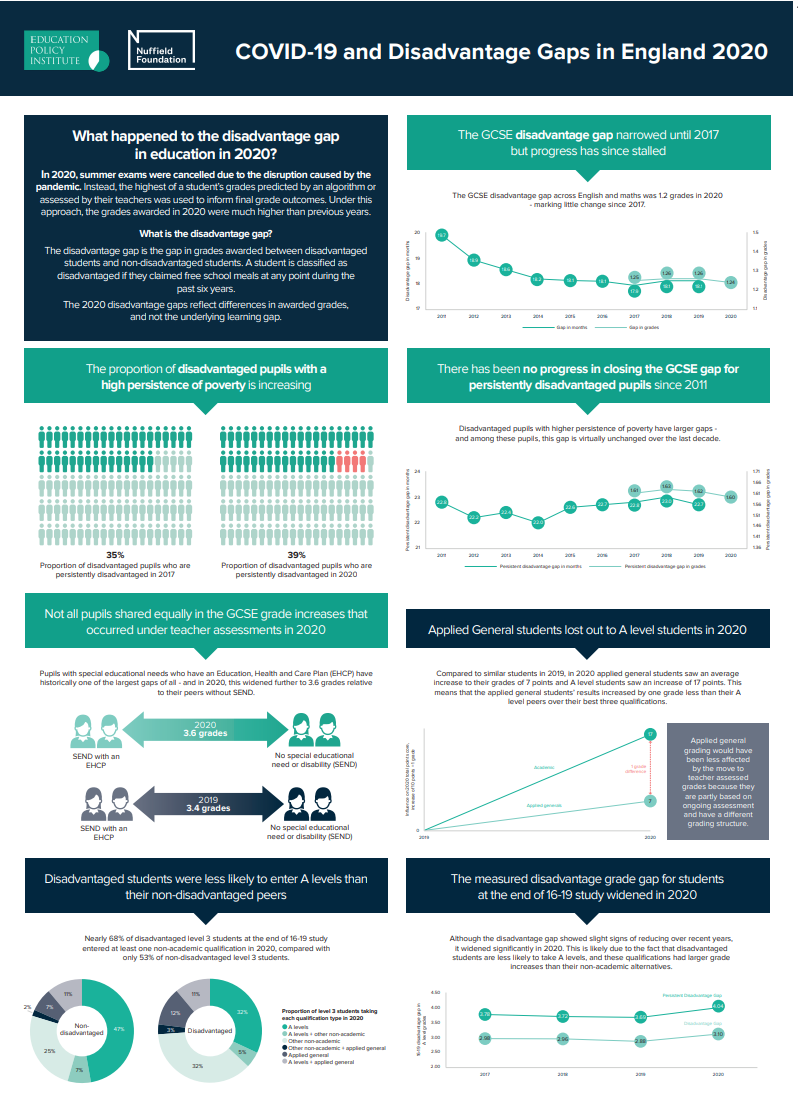
- Fears that the switch to teacher assessed grades for GCSEs in 2020 would penalise students from disadvantaged backgrounds are largely unfounded – with no evidence poorer GCSE students lost out under this system.
- But for students in college and sixth form (16-19 education), the gap in grades between poorer students and their better off peers widened in 2020.
- This was driven by A level students gaining a whole grade more from teacher assessments than those who studied qualifications such as BTECs.
The full report can be accessed here.
Key findings
The disadvantage gap at GCSE is large, and outcomes for the very poorest students in long-term poverty have failed to improve after a decade
- The disadvantage gap – the gap in GCSE grades between students on free school meals (at any point over the last six years) and their better off peers – was on average 1.24 grades in 2020. This compares to 1.26 grades in 2019, and is little changed since 2017, marking a stalling of progress in reducing educational inequalities.
- The disadvantage gap is even wider for students who are in long-term poverty (those who spend at least 80% of their school lives on free school meals), who trail their better off peers by as many as 1.6 grades on average at GCSE.
- For this group of the very poorest students who are in long-term poverty, the disadvantage gap has now failed to improve since 2011, despite government interventions.
- There are now more students falling into this long-term poverty 80% FSM group. The proportion of all disadvantaged students that fall into this long-term poverty group increased to 39% in 2020, up from 35% in 2017.
- The proportion of students confined to poverty for their entire school lives – those on FSM for 100% of the time – has also risen, from 19% of all disadvantaged students in 2017 to 25% in 2020.
Disadvantage gaps are much larger in certain areas of England, often where many students spend most of their lives confined to poverty
- There is considerable geographic variation in the disadvantage gap. The five local authorities with the largest grade gaps in 2020 are: Knowsley (poorer students are 1.76 GCSE grades behind); Blackpool (1.69); Salford (1.66); Derby (1.65) and Sheffield (1.61).
- The smallest GCSE grade gaps are in: Kensington and Chelsea (0.10); Westminster (0.29); Newham (0.33); Tower Hamlets (0.34); and Barnet (0.36). Of the 30 areas with the smallest gaps in England, almost all of them are areas in London.
- Areas with the largest disadvantage gaps in the country are more likely to have a large proportion of students in long-term poverty (80% FSM). Several areas have over half of their disadvantaged students in this long-term poverty group, including Kirklees (58%), Sunderland (54%), Halton (53%), Tower Hamlets (53%), Middlesbrough (53%), Knowsley (52%), Kingston-Upon-Hull (52%), and Hartlepool (51%).
- Poverty therefore plays a decisive role, and large disadvantage gaps do not necessarily represent poor educational provision: after controlling for long-term poverty rates, many of these areas see their disadvantage gaps reduce.
- Likewise, controlling for poverty also exposes many areas with low levels of long-term poverty that have underlying poor educational performance. Newham, North Yorkshire, Slough, Rutland, Windsor, Maidenhead, and Milton Keynes all see higher GCSE disadvantage gaps than would be expected.
Geographic disadvantage gap data breakdowns, including by local authority and parliamentary constituency – access.
Despite disadvantage gaps failing to narrow, in 2020 poorer students did not lose out from teacher assessed grades, contrary to fears at the time
- There is no evidence of bias against disadvantaged students in teacher assessed grades in 2020, as was feared; these students made equal grade gains.
- There was even some progress in closing the measured grade gap in 2020 for many minority ethnic groups, including Black Caribbean and other black students, who had been losing ground to White British students prior to 2020.
- But other groups, such as students with special educational needs (SEND), did lose out under teacher assessed grades. The gap between SEND students with severe needs and non-SEND students rose from 3.4 grades in 2019 to 3.6 grades in 2020.
- There is a risk that teacher assessed grades have masked underlying learning losses as a result of the pandemic. There is evidence beyond awarded grades that “real” learning losses for disadvantaged students and other groups have been greater than their peers.
But the disadvantage gap for students in 16-19 education did widen, as more poorer students took qualifications with lower grade increases
- Disadvantaged students in 16-19 education – those attending sixth form and college – were on average the equivalent of 3.1 A level grades behind their more affluent peers across their best three qualifications in 2020, compared to 2.9 grades in 2019.
- Similar to GCSE level, students in 16-19 education in long-term poverty – those who spend at least 80% of their school lives on FSM – saw much larger gaps, and they have now widened significantly. The 16-19 disadvantage gap for students in this long-term poverty group stood at 4 grades in 2020, compared to 3.7 in 2019.
- Sixth form and college students in some regions saw greater increases than in others. Grades increased the most in London and the East Midlands, but students in the North West, Yorkshire and The Humber and the North East only saw modest rises. These regional differences have significant implications for the government’s “levelling up” agenda.
- The widening of the gap at 16-19 is driven by a lower proportion of disadvantaged students taking up A levels, which saw larger grade increases than Applied General Qualifications – which include BTECs.
- All qualifications saw increases in 2020, but A levels increased by one grade more than Applied General grades for otherwise similar students. Applied Generals did not receive a similar boost from the move to teacher assessments as they are partly based on ongoing assessment, practicals and projects – largely completed before the pandemic.
- Because disadvantaged students are more likely to take Applied General qualifications, they may have lost out when competing for university places.
Recommendations for government
- Given that grades awarded under teacher assessments in 2020 may not fully represent students’ underlying learning, government policy must focus on interventions targeted at groups most affected by learning loss during the pandemic.
- The government should prioritise closing gaps for the lowest attaining and most vulnerable students and ensure that the grade increases of 2020 do not distract from the urgent task of tackling deep-rooted educational inequalities, which have failed to improve for several years.
- The government should work with the HE sector to ensure students taking alternatives to A levels do not lose out when competing for university places. This is especially critical for disadvantaged students who already face significant hurdles in accessing HE.
- If the government is serious about reducing educational inequalities, its new Levelling Up Strategy must tackle the social determinants, such as poverty. There is little evidence in current government policy of plans to confront these underlying causes
Additional documents and resources
Geographical analysis pack (PDF|Excel) which includes the following data breakdowns:
- Disadvantage gap by local authority, secondary school students
- Percentage of disadvantaged and persistently disadvantaged students by local authority, secondary school students
- Disadvantage gap by local authority, students in 16-19 education
- Percentage of disadvantaged students by local authority, students in 16-19 education
- Disadvantage gap by parliamentary constituency, secondary school students
- Percentage of disadvantaged and persistently disadvantaged students by parliamentary constituency, secondary school students
- Data by Opportunity Area, secondary school students
- Data by Regional School Commissioner area, secondary school students
Infographic 1: A visualisation of headline findings from the report
Infographic 2: A more detailed visualisation of key findings from the report
This report is funded by the Nuffield Foundation.
The Nuffield Foundation is an independent charitable trust with a mission to advance social well-being. It funds research that informs social policy, primarily in Education, Welfare, and Justice. It also funds student programmes that provide opportunities for young people to develop skills in quantitative and scientific methods. The Nuffield Foundation is the founder and co-funder of the Nuffield Council on Bioethics and the Ada Lovelace Institute. The Foundation has funded this project, but the views expressed are those of the authors and not necessarily the Foundation.
![]()