The students that received their level 3 results today represent the second cohort for which grading has been back to ‘normal’, following centre and teacher assessments and a gradual return to pre-pandemic grade boundaries.
As such, this represents the first time since 2019 that results can be compared to the previous year on a like-for-like basis. In this analysis piece, we therefore focus on comparisons to 2023, and to 2019.
Ofqual’s approach in 2024 was to maintain 2023 standards. This means that higher/lower grades in a given subject in 2024 indicate that this year’s students achieved more/less highly than in 2023. This is in contrast to how grade boundaries were set last year, which had additional protections built in to prevent grades dropping below 2019 levels (so the proportion of grades awarded were set to be similar). This means that while we can compare grades to 2019, this is not quite equivalent to comparing standards.
Students in 2024 did not have their GCSEs or 16-19 exams cancelled because of the pandemic, however they still had two years of their secondary study severely disrupted. Although exam based, their GCSEs sat in 2022 were marked more generously than a usual year, which may have influenced some students’ choice of 16-19 study programmes.
Entries to A levels were at a record high for the second year in a row, with 816,948 A levels awarded today. The numbers have increased in recent years as we continue to see a rise in the number of 18-year-olds progressing through the education system.
FIGURE 1: A level grade distribution by year
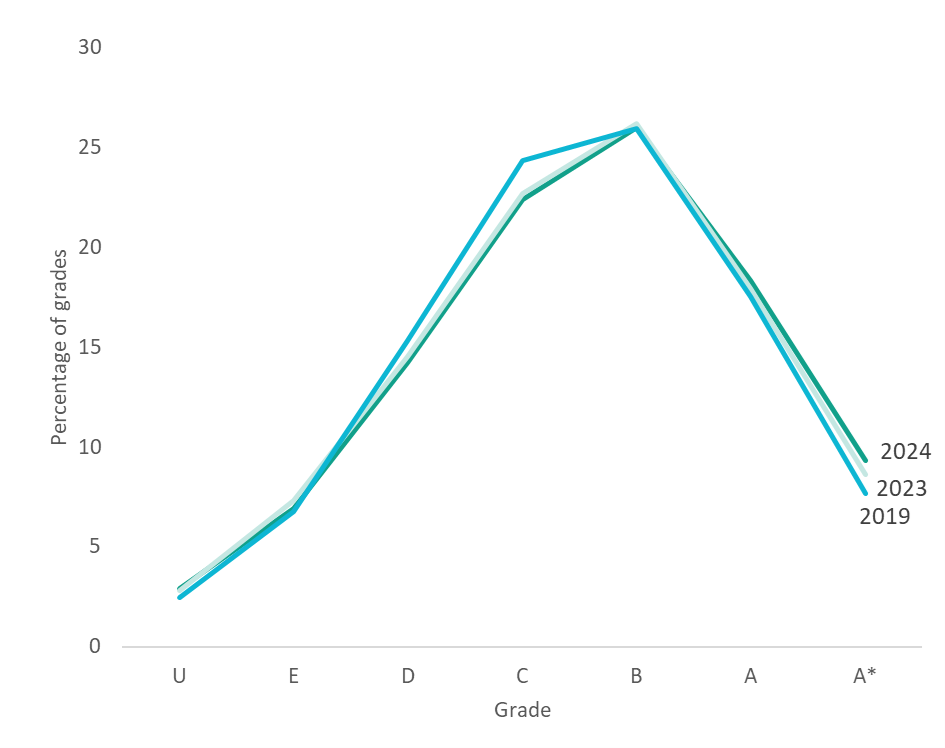
Figure 1 shows that, as expected, the 2024 grading distribution is very closely aligned to that of last year. A slightly higher proportion of students achieved A/A* grades in 2024 (27.6 per cent) than in 2023 (26.5 per cent). More than three quarters (76 per cent) of entries were awarded grade C or above, again a slight increase on 2023 (75.4 per cent). Although more students achieved top grades this year, the overall pass rate (those achieving grade E or above) was similar to 2023 (97.1per cent compared to 97.2 per cent).
FIGURE 2: Proportion of A level entries awarded top grades, by English region
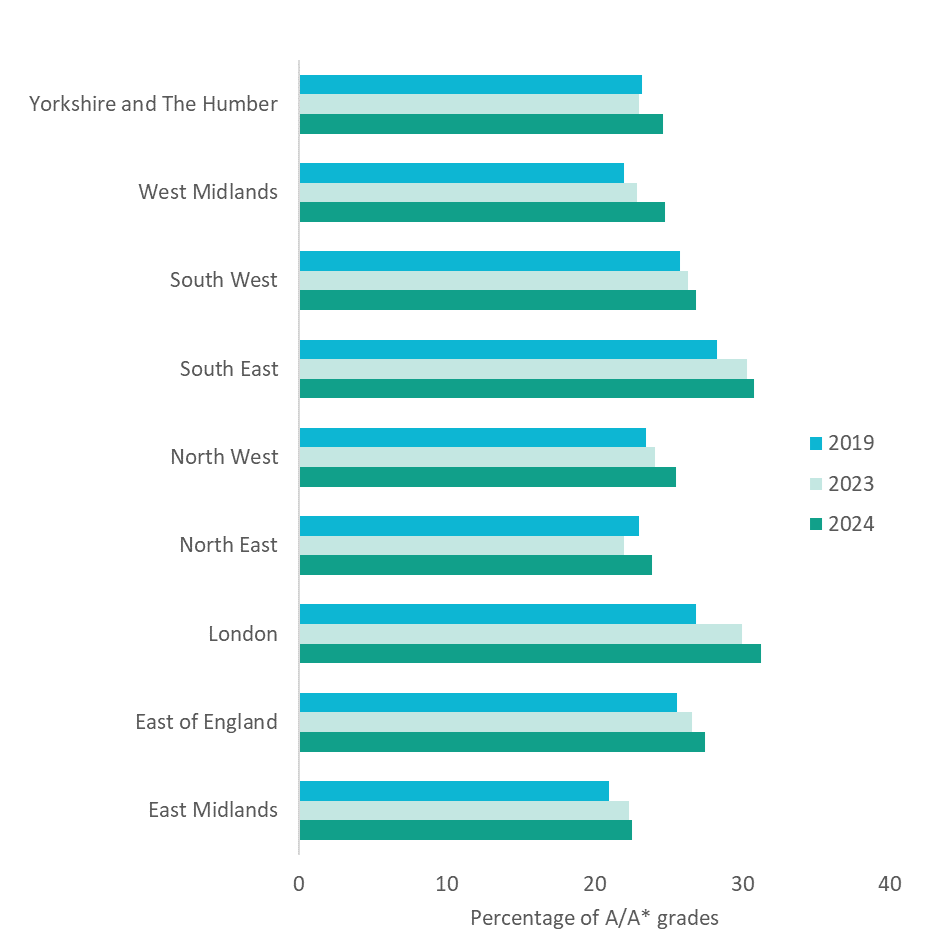
Figure 2 shows that although the proportion of top grades achieved increased in all regions compared to 2023, there was substantial variation around the country. Notably, the biggest increases were in the West Midlands and North East where 24.8 and 23.9 per cent of students received top grades respectively this year, compared to 22.9 and 22.0 per cent in 2023.
The next greatest increase was in London, which was also the region where most students received top grades (31.3 per cent), an increase of 1.3 percentage points since 2023. Although London was still the highest performing region in terms of A/A* grades, there are signs that the rate at which its students are pulling away from those in other regions is starting to slow.
The region where the lowest proportion of students received top grades was the East Midlands (22.5 per cent), a relatively small increase of 0.2 percentage points since 2023.
FIGURE 3: Proportion of A level entries awarded top grades, by centre type
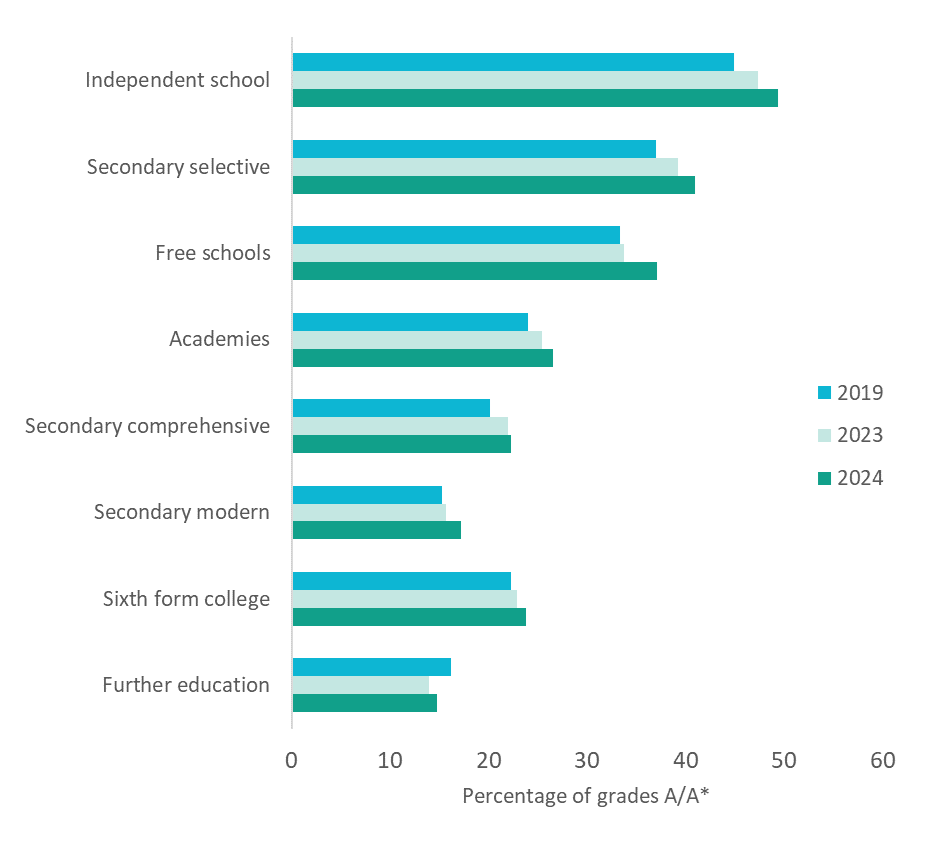
Figure 3 shows the proportion of students achieving A or A* grade A levels by centre type. The biggest increase since 2023 was seen in free schools, from 33.8 to 37.1 per cent of students, whilst the provider type with the overall highest grades were independent schools, which has consistently been the case in recent years.
In FE colleges, the proportion of students achieving top grades in 2024 increased to 14.8 from 14.0 per cent in 2023. However, this is still below the 2019 proportion of 16.2 per cent.
This variation is likely to be related to the differences in intake between institution types, rather than a simple reflection of quality of provision. Independent and selective schools tend to take on more students with higher prior attainment and far fewer students from economically deprived backgrounds, while FE colleges typically serve a higher proportion of disadvantaged students.
Recent EPI research has set out details of how a student premium could be implemented in the 16-19 phase to better support disadvantaged students in their sixth form or college study[1].
[1] https://epi.org.uk/publications-and-research/implementing-a-16-19-student-premium/
FIGURE 4: Male v female A level grade increases 2024 compared to 2023
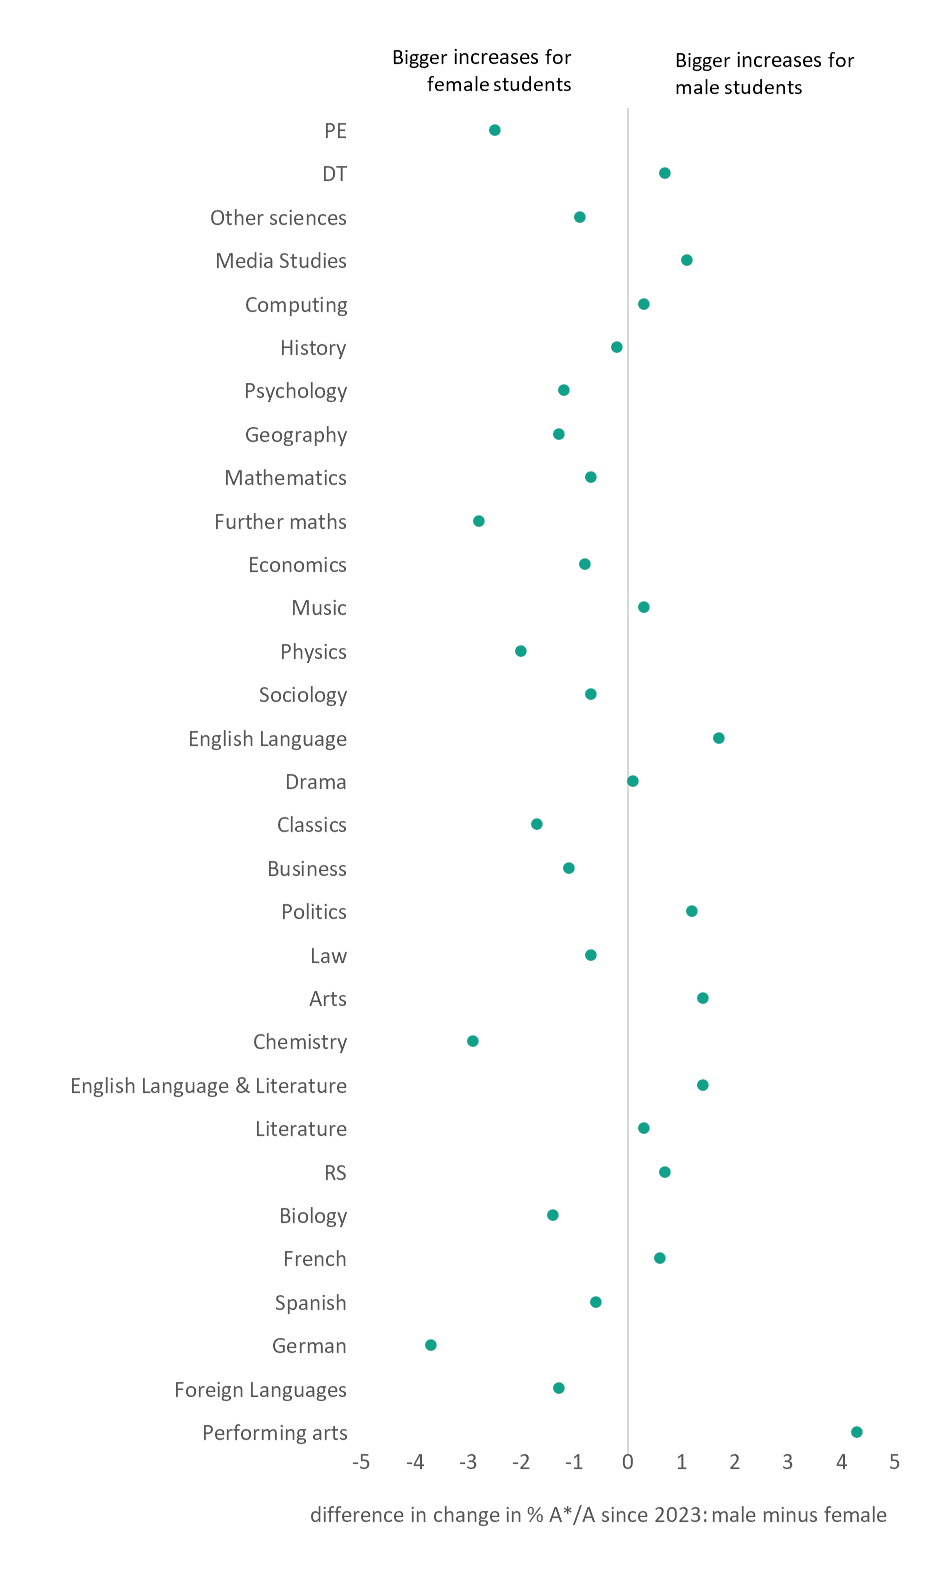
Figure 4 shows that since last year, there is variation in the subjects for which male or female students had biggest increases in top grades.
There has been a bigger increase in the proportion of female students receiving top grades since 2023 in many STEM subjects, notably maths and further maths, physics, chemistry, and biology. There have also been sharp increases in the proportion of students entering these subjects this year.
FIGURE 5: The A level gender gap: attainment and entries in 2024
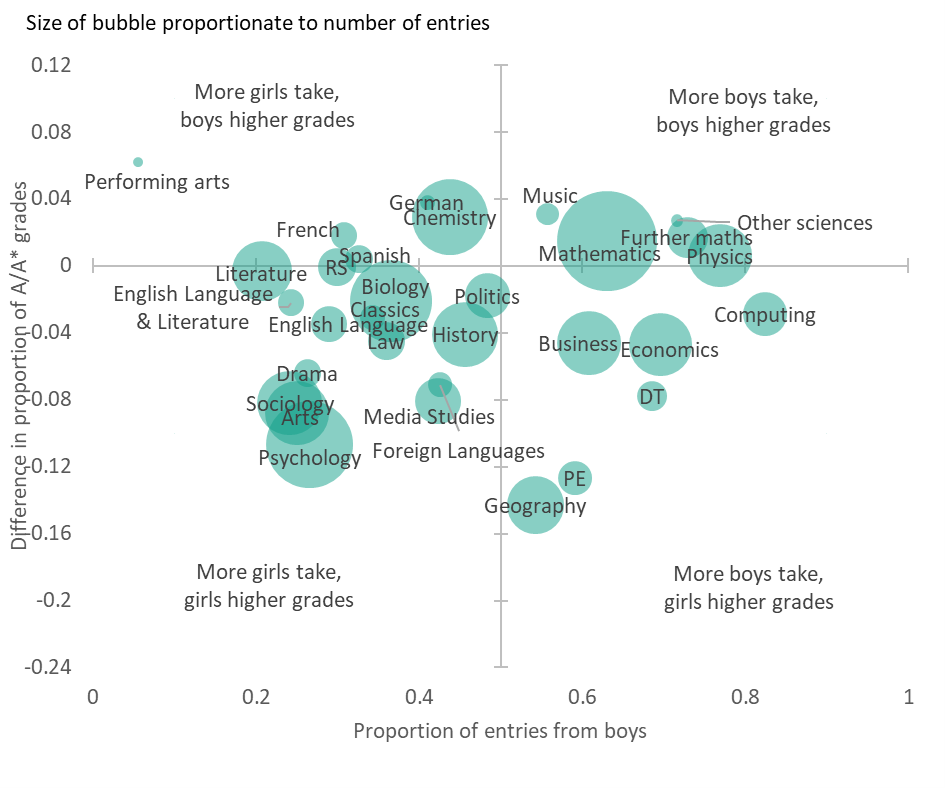
Figure 5 shows that the subjects most commonly entered by male students are not necessarily the ones where they achieve higher grades, and vice versa. The top left and bottom right quadrants show the subject areas where this is the case.
While female students had bigger increases in the proportion achieving the top grades since 2023 in maths, further maths and physics (as shown in Figure 4), male students still achieved a greater proportion of A and A* grades in absolute terms.
Conversely, although more male students entered computing, it is female students that achieved the higher grades. Overall, there are more subjects (68 per cent) where female students achieve the higher proportion of top grades, including STEM subjects such as biology and chemistry.
Students taking level 3 technical and vocational qualifications also received their results today, including the third cohort of T level students. These new qualifications were designed as high-status technical alternatives to A levels. For a short period, it looked as though T levels might never become established as they were set to be replaced under the planned Advanced British Standard (ABS). However, now that it is confirmed that the ABS will not go ahead, it appears as though T levels will be here to stay.
The third cohort of T level students began their qualifications in 2022, and this cohort have again been graded favourably to recognise that these qualifications are still in their roll-out phase. Figure 6 shows that, although 10,253 students began a T level two years ago, only 7,262 completed their T level and received a grade today, equivalent to 71 per cent. This is an increase from 66 per cent in 2021. This figure is also lower than the completion rates of 75 per cent for similar sized vocational or technical qualifications (the existing alternatives to A levels) and 88 per cent for those taking three A levels last year. It appears then that T levels students are becoming almost as likely to complete T levels as students taking similar sized VTQs. This figure may continue to increase as T levels complete their roll-out, and providers become more familiar with these new qualifications. However, it is also worth bearing in mind that T levels are more selective than VTQs, with around 95 per cent of T levels students having a good pass in GCSE English and maths, compared with around 70-75 per cent for students taking existing VTQs.
FIGURE 6: Completion rates of T levels, similar sized A level and VTQ programmes
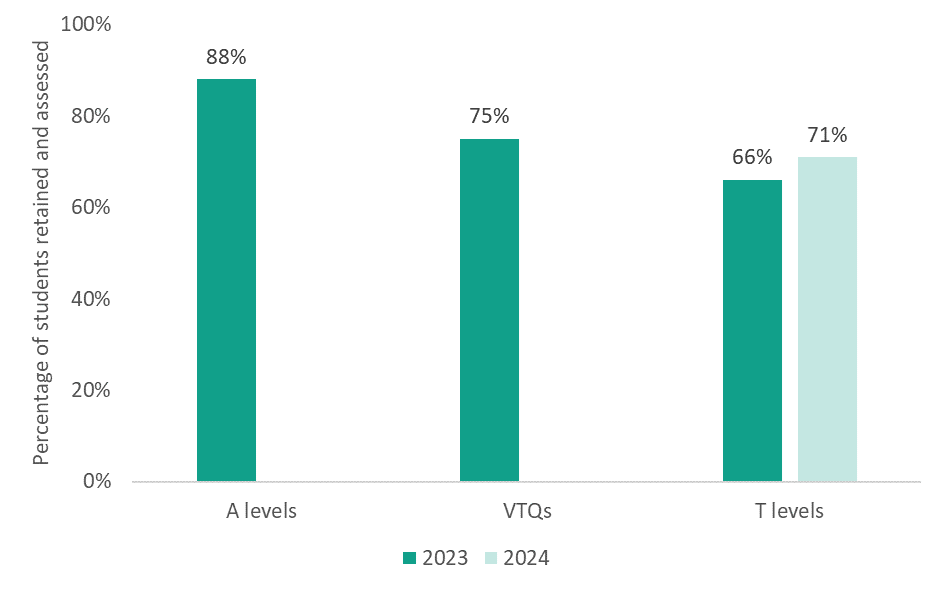
FIGURE 7: Completion rates of T levels by pathway
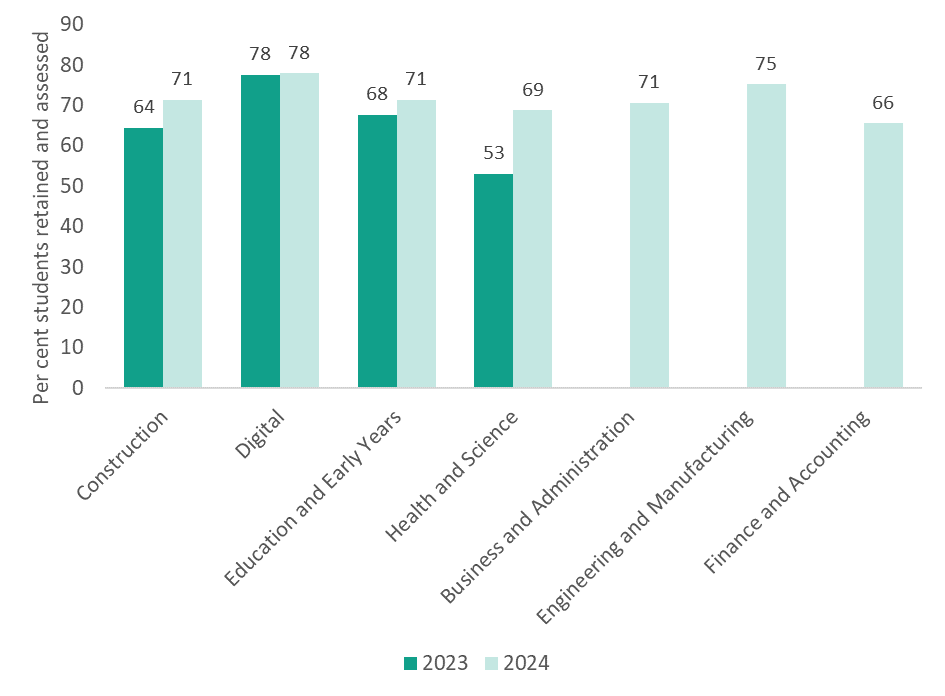
However, the completion rate differs considerably across T level pathways. Using statistics from the T level action plans, Figure 7 shows that all existing pathways saw improvements in their completion rate. Notably, the Health and Science pathway saw a significant improvement in their completion rate (moving from just over 50 per cent to over 70 per cent). This is encouraging given the major challenges that were highlighted with the Health and Science pathway by Ofsted and others.[1] It appears that many of these challenges have been addressed, at least in part, which is good news for students and providers. Of the 2024 pathways, the Finance and Accounting pathway saw the lowest completion rate (but this was not too far off the average).
[1] See T-level thematic review: final report – GOV.UK (www.gov.uk) and Information on IfATE’s review of the Health and Science 2022 T Level core assessments / Institute for Apprenticeships and Technical Education
Given completion rates are still low in some pathways (and lower than other similar VTQs and A levels), it will be important to investigate which students are dropping out and why across the different T level pathways. EPI are currently working on a project examining the wider drivers of T level completion (within each pathway) which will be published next month.
FIGURE 8: 18-year-olds UCAS applications, England
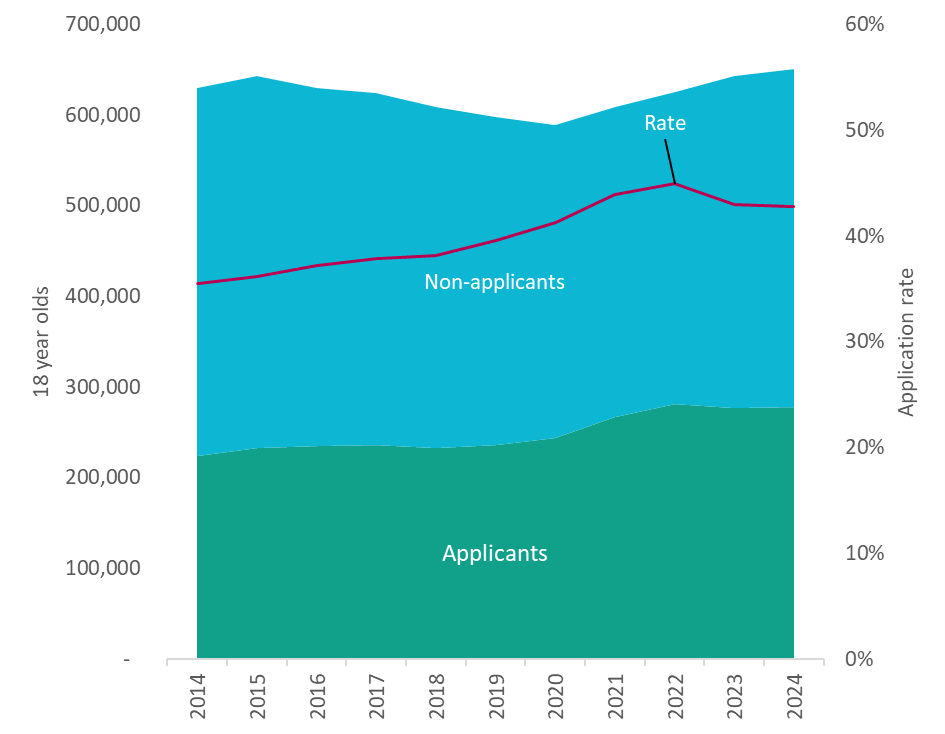
The number of 18-year-olds applying for higher education courses from England remained at a comparable level to 2023 (43 per cent), having peaked in 2022 (45 per cent). As we can see from Figure 8, this comes together with a continued increase in the size of the 18-year-old population, meaning that there are slightly more 18-year-olds in England entering higher education this year than last.
Although university application rates peaked in the pandemic, they are still considerably higher than they have been for most of the last decade.
FIGURE 9: UCAS applications for each UK nation and international students, all ages
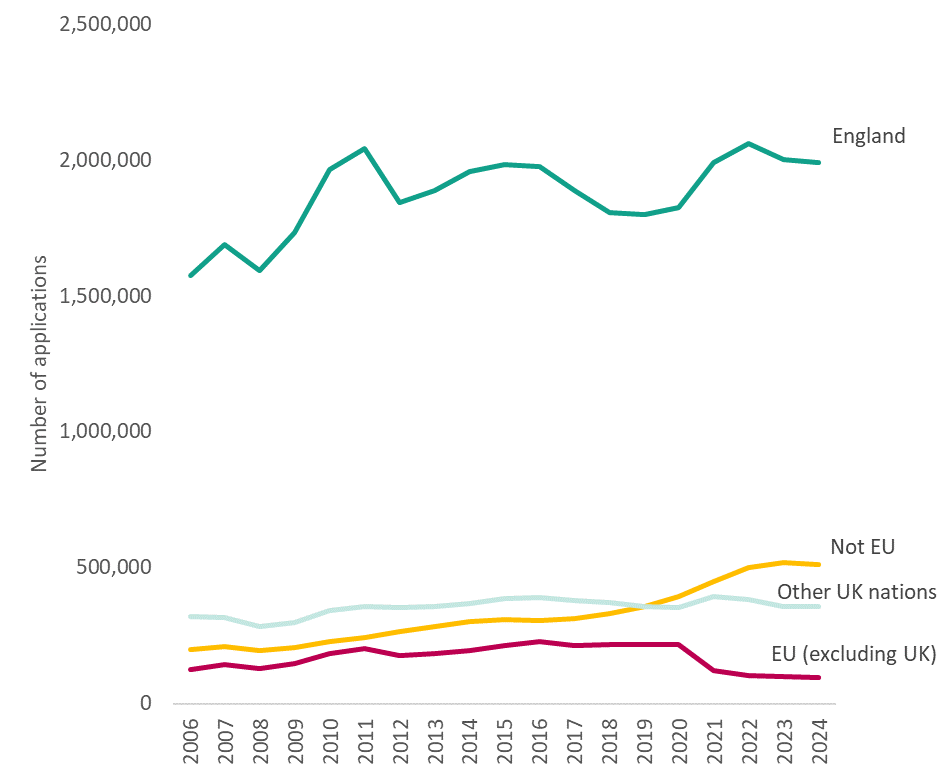
While the number of 18-year-olds in England applying for university has not decreased this year, Figure 9 shows that the number of applications in England by students off all ages is lower than it was in 2023. Combined with slight decreases in the number of applications from international students, this could result in more places being offered to 18-year-olds in England this year. This may suggest that university places could be a little less competitive in 2024, however Figure 10, below, shows that the trend in applications is different for lower/medium and higher tariff universities.
FIGURE 10: UCAS applications and acceptance rate by provider/university tariff (all ages, all UK nations and international students)
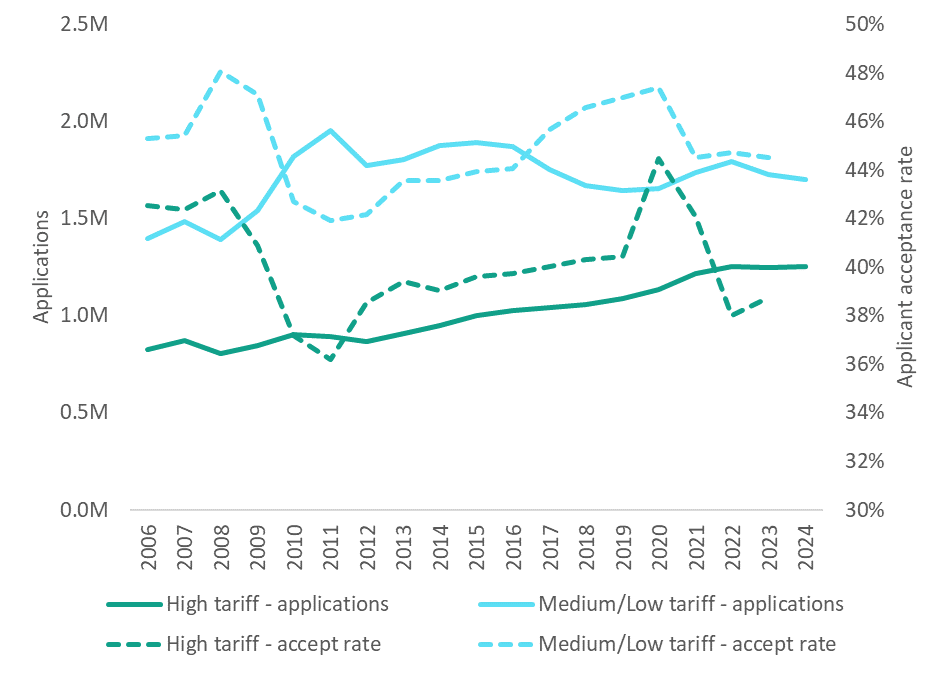
As we can see from Figure 10, whilst the number of applications for medium and low tariff universities is similar to pre-pandemic levels and has fluctuated over the last decade, the number of applications for high tariff universities has grown consistently over the same period. The applicant acceptance rate for high tariff universities increased substantially during the pandemic, when student caps were temporarily lifted in some subjects, and demand was at a record level. However, in more recent years the high tariff acceptance rate has returned back to levels last seen at the start of the 2010s, so it remains likely that competition for places in more selective universities will remain high in 2024.
Figure 10 shows the end of cycle acceptance rate, after clearing so only goes up to 2023. However, UCAS statistics today show that the initial number of accepted applicants in England has gone up from 303,460 to 312,920 applicants compared to the same day last year. Looking at 18-year-olds only, the number of accepted applicants on results day increased from 196,650 to 208,960 since last year. This reflects an entry rate of 32 per cent of the 18-year-old population, up one percentage point since last year.
FIGURE 11: 18-year-olds UCAS application rates by English region
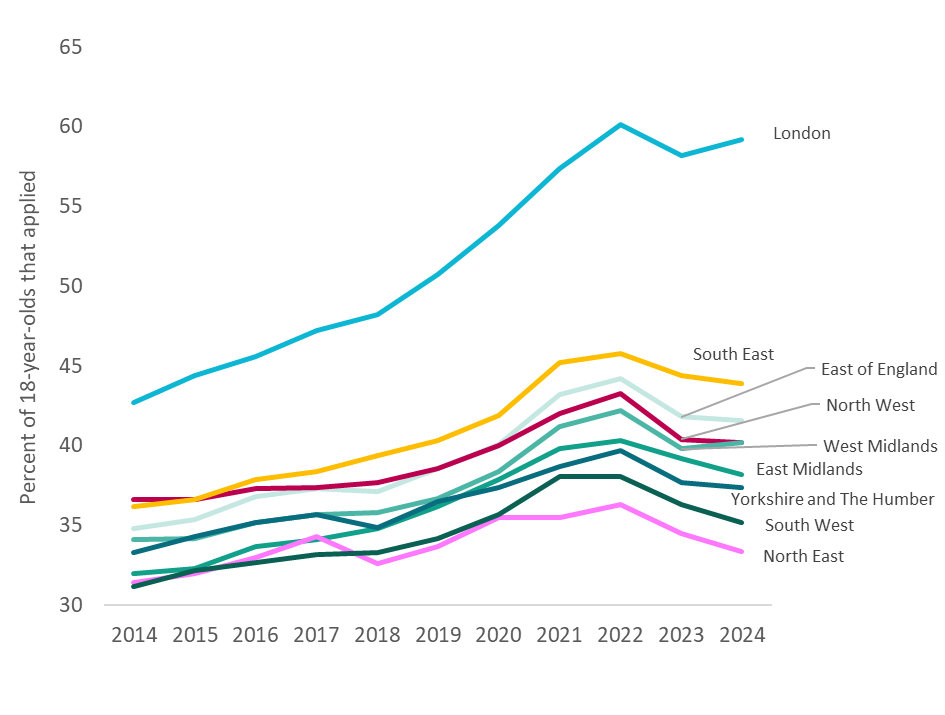
Figure 11 shows a breakdown of the application rate among 18-year-olds from different regions over the past decade.
All regions saw an increase in applications through the pandemic. These increases have largely subsided, but application rates in 2024 were still higher than they were in 2019 across all regions except the North East.
While this trend persists across all regions in England, variations in the degree of this growth have produced increasing regional inequalities.
Evidently, there is a significant disparity between application rates among students coming from London and their counterparts in all other English regions. Most notably, applications in London increased in 2024, compared to 2023, at a time when the rate in all other regions except the West Midlands decreased.
The gap between application rates from London and the North East, which had the lowest application rate, has increased from 17 per cent in 2019 to 26 per cent in 2024.
FIGURE 12: POLAR 4 application rates in England
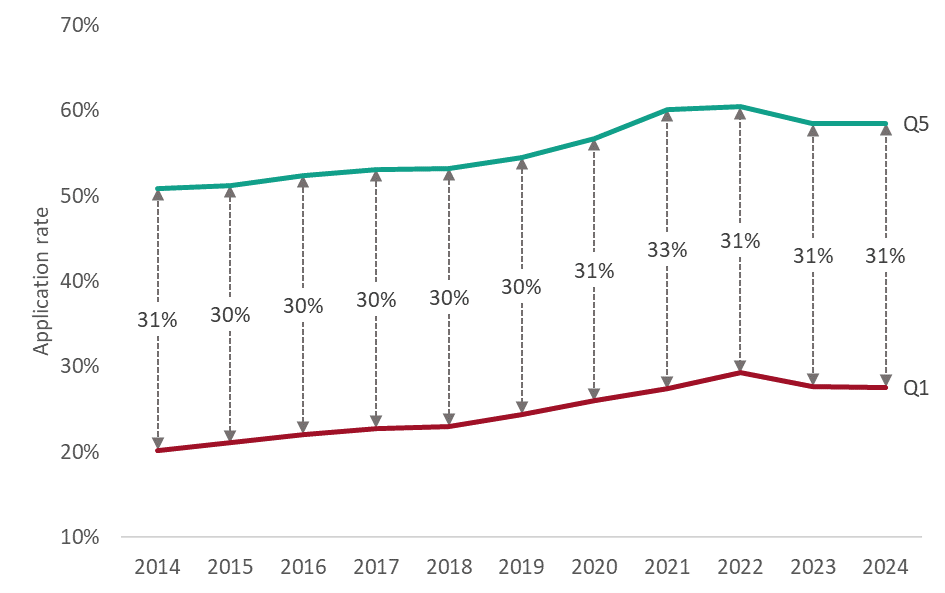
Figure 12 shows the application rate for students from areas with historically high and low participation rates in higher education, using the POLAR4 quintiles. Quintile 1 indicates the areas with lowest levels of participation, while quintile 5 indicates the highest.
The disparity between the quintiles was at its highest in 2021, at the height of the pandemic. The gap has since decreased but remains slightly higher than pre-pandemic levels. More broadly there has been no change in this gap in the last decade.