With today marking the release of A-level results, students throughout the country will receive their grades and begin to feel their effect upon access to work and further study. This analysis will explore the policy background, before examining what 2018 tells us about entries and grades, student demographics, and access to higher education.
Policy Background
A-level qualifications have been the focus of significant reform, with the implementation ongoing over the last few years. There are four key areas of reform: restructuring qualifications, assessment structures, subject content, and the number of qualifications.[1] These A-levels correspond to the second cohort taking some courses and the first cohort for others (we will see the first cohorts in a further range of subjects next year).
In terms of subject content, reforms attempted to increase the amount of quantitative work in relevant subjects and increase the breadth of knowledges for arts and humanities. Assessment structure reforms saw coursework reduced to only assess non-examinable skills – examples include in-depth studies in history and fieldwork in geography. It also saw the creation of stand-alone pass/fail qualifications for practical work in science subjects which sit alongside the exam-tested A-levels. A-levels are also being made linear, so the whole A-level is assessed at the end of the course, with the AS solely a standalone qualification which contributes less in terms of UCAS tariffs and do not count towards the A-level result.
In addition to the specific reforms of qualifications, students receiving A-level results today are likely to be leaving a school landscape with an increasingly diverse number of education providers. New forms of education provision join well-established academic-focused 16-18 providers: sixth form colleges and comprehensive, selective & faith schools. Around half of providers are academies, including free schools, many of which will be part of a multi-academy trust (MAT).
The cohort of students receiving their grades today were in secondary education during a time of reforms to school accountability such as the introduction of the EBacc and Progress 8. Indeed, this was the first cohort in which all schools were judged by Progress 8. These are likely to have shaped subject choices at Key Stage 4 with implications for choices post-16.
Grades
Overall, results have remained stable, possibly reflecting that for many courses this is the second cohort of students who have studied under the new system but also the application of ‘comparable outcomes’ which means that students are not unfairly penalised for being the first cohort taking a qualification. The percentage of A-levels at grades A*-C is 76.8 per cent, down 0.5 percentage points from the previous year, with a decrease of 0.2 percentage points for grades A*-B. The proportion achieving A*/A has remained flat.
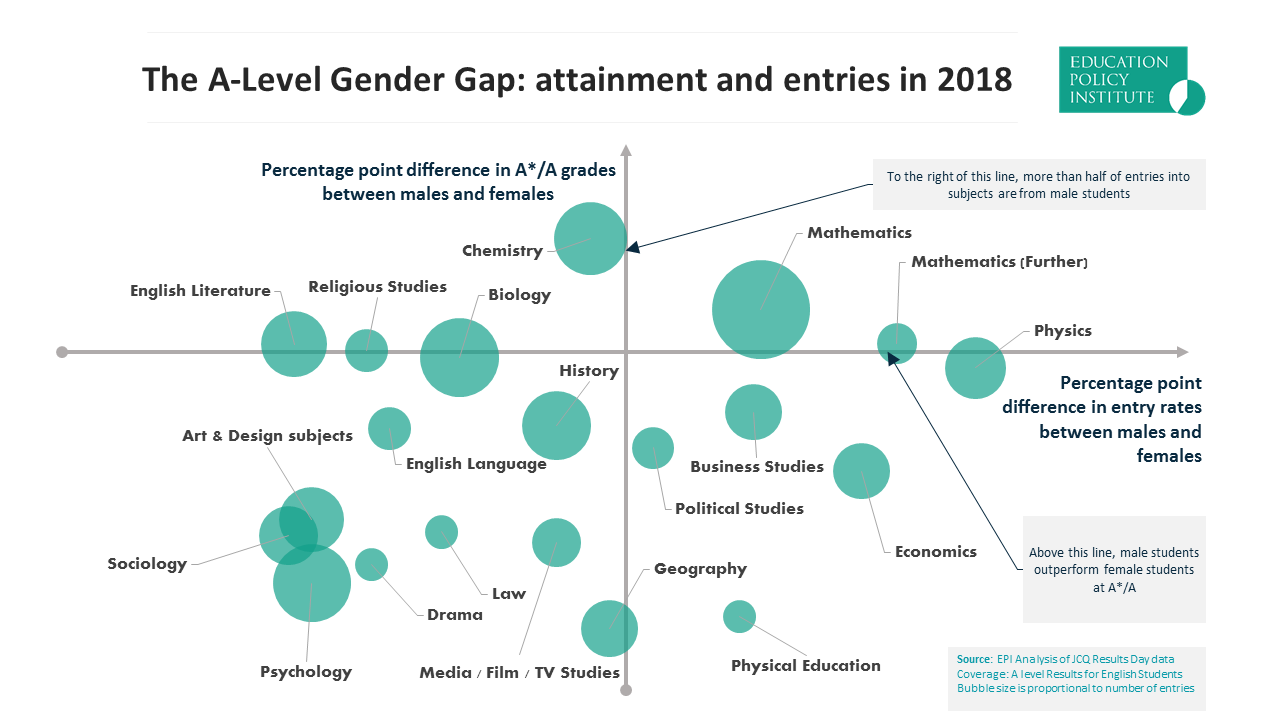
In terms of grades, the percentage of A-levels at A* level is 8.5 per cent among male students vs 7.6 per cent among female students. This may partially reflect the relative levels of male students studying mathematics and further mathematics, both subjects with high rates of A*s. Female students, however, are more likely to achieve qualifications at levels A*/B. As the majority of university places have tariffs which do not require A* grades (especially outside of science subjects), this may link to the underrepresentation of males taking undergraduate degrees.
The proportion of students achieving the highest grades varies quite significantly by regions – 29.3 per cent of A-level results are at A/A* in the South East, compared with 22.6 per cent in West Midlands. In terms of grades A/A*, the gap between the highest and lowest achieving English regions has increased by 0.8 percentage points.
Entries
There has been a net fall of 1.8 per cent in the number of entries into A-levels, 745,500 compared to 759,000 in 2017. There are potentially a number of reasons for the fall. The simplest is that this cohort has fewer students in it overall than last year’s. We may also see some impact from the linearisation of A-levels and a possible increase the workload of individual A-levels, leading to students taking fewer options, to maximise their grades.
Alternatively, changes to funding for post-16 education may mean that providers are no longer able to offer students the opportunities to study as many subjects as they would have done before. This is concerning as the UK already has a uniquely narrow post-16 education system compared to other countries, as discussed in a recent EPI report.
In terms of individual subjects, the greatest percentage increase in terms of entries is computing, increasing by 25.4 per cent from approximately 7,600 to approximately 9,500. There was also an 8.9 per cent increase for entry rates in business studies.
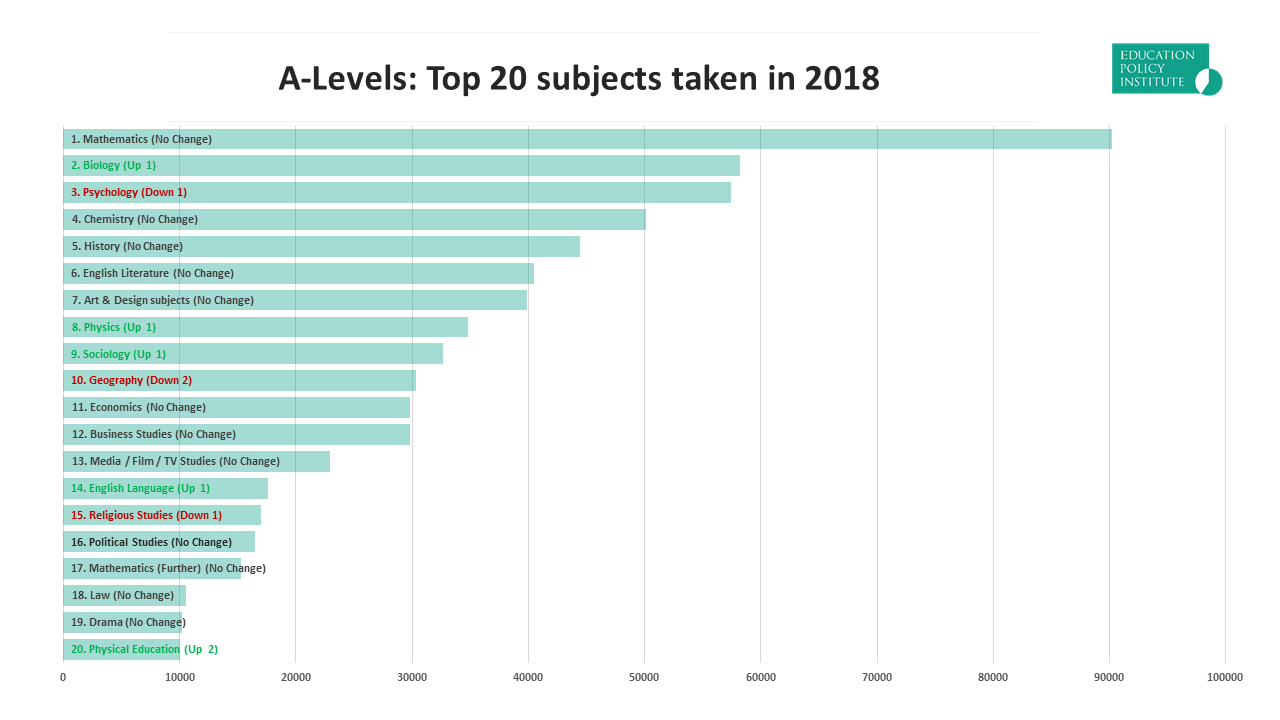
Subjects with significant drops in entry rates include ICT, 26.5 per cent down to 4,000 and religious studies down 23 per cent to 17,000. It is interesting to note the increasingly popularity of computer science coincides with falling entry rates for ICT. The most popular subjects are mathematics, biology and psychology, representing 12.1 per cent, 7.8 per cent and 7.7 per cent of entries into A-levels – the first two of which are facilitating subjects.
Entries in mathematics and physics remain disproportionate male, with men representing 78 per cent and 61 per cent of the entries respectively. This is a slight decrease in the levels seen in previous years, a reduction of 0.9 and 0.4 percentage points respectively. This is likely to be disappointing reading for those who working on initiatives to increase the gender balance within STEM subjects. Subjects with disproportionately female cohorts include biology, art & design subjects, and English language and/or literature.
Entrance to University
The headline result of 170,030 English students aged 18 being placed represents a modest decrease from the previous years – the number dropped 0.76 per cent from the previous year’s 171,330.[2]
There is a moderate increase in the number of English students placed to study medicine and dentistry (6,200 compared to last year’s 5,540). This may partially represent a decision, influenced by complaints from some areas of understaffing within the NHS, to increase the number of medical students, a decision which led to the approval this year for five new medical schools alongside plans to increase capacity at existing medical schools.
Attempts to raise the number of students qualified in certain subjects has seen mixed results. Year-on-year increases in students taking places on computer sciences courses has stalled, the number of places taken is a decrease from 2017 of 80 to 14,330 from 14,410. Similarly, the number of students placed on courses on European and non-European languages have both seen small decreases.
Just as with A-level entry, there remains significant gender differentials in terms of entry to degrees. The overall gender difference has remained mostly stable, with female students still making up 57 per cent of students placed.
On a day with significant focus on students studying A-levels, it is important to consider that in 2017, only 52 per cent of students take A-level qualifications, with remaining students taking level 3 vocational or other academic qualifications, studying at lower levels or NEET. This means that to consider educational attainment as a whole we need to look at broader metrics of pupil outcome, and recognise that increased support needs to be available to those who don’t wish to pursue continued academic study.
[1] https://www.aoc.co.uk/sites/default/files/A%20Level%20Reform%20Guidance%20Document.pdf
[2] https://www.ucas.com/data-and-analysis/undergraduate-statistics-and-reports/statistical-releases-daily-clearing-analysis-2018