EPI’s David Robinson and Sam Tuckett explore 2022’s A level, BTEC and T level results.
Summer exams in 2022 were the first to go ahead since 2019. However, although exams may be back, it is far from business as usual as this year’s students faced yet another unique series of challenges. Most students finishing 16-19 study in 2022 will have been among the cohort that were awarded teacher assessed GCSE grades in 2020, meaning that most of these students won’t have taken a formal exam before this year.
This cohort also faced severe disruption and will have lost out on a lot of face-to-face teaching time throughout 2020 and 2021. To account for this widespread disruption, a number of adjustments were made to exams such as more notice of exam content, allowing formula sheets and giving students greater choice over which exam questions they answered. More significantly, this year’s grading distributions were designed to be somewhere between pre-pandemic levels, and those of 2021, when teacher assessed grading led to record levels of high grades. This represents the first step in the government’s plan to gradually return exam results to pre-pandemic levels and avoid a large drop in results for a single cohort.
Figure 1: A level grade distributions, by year
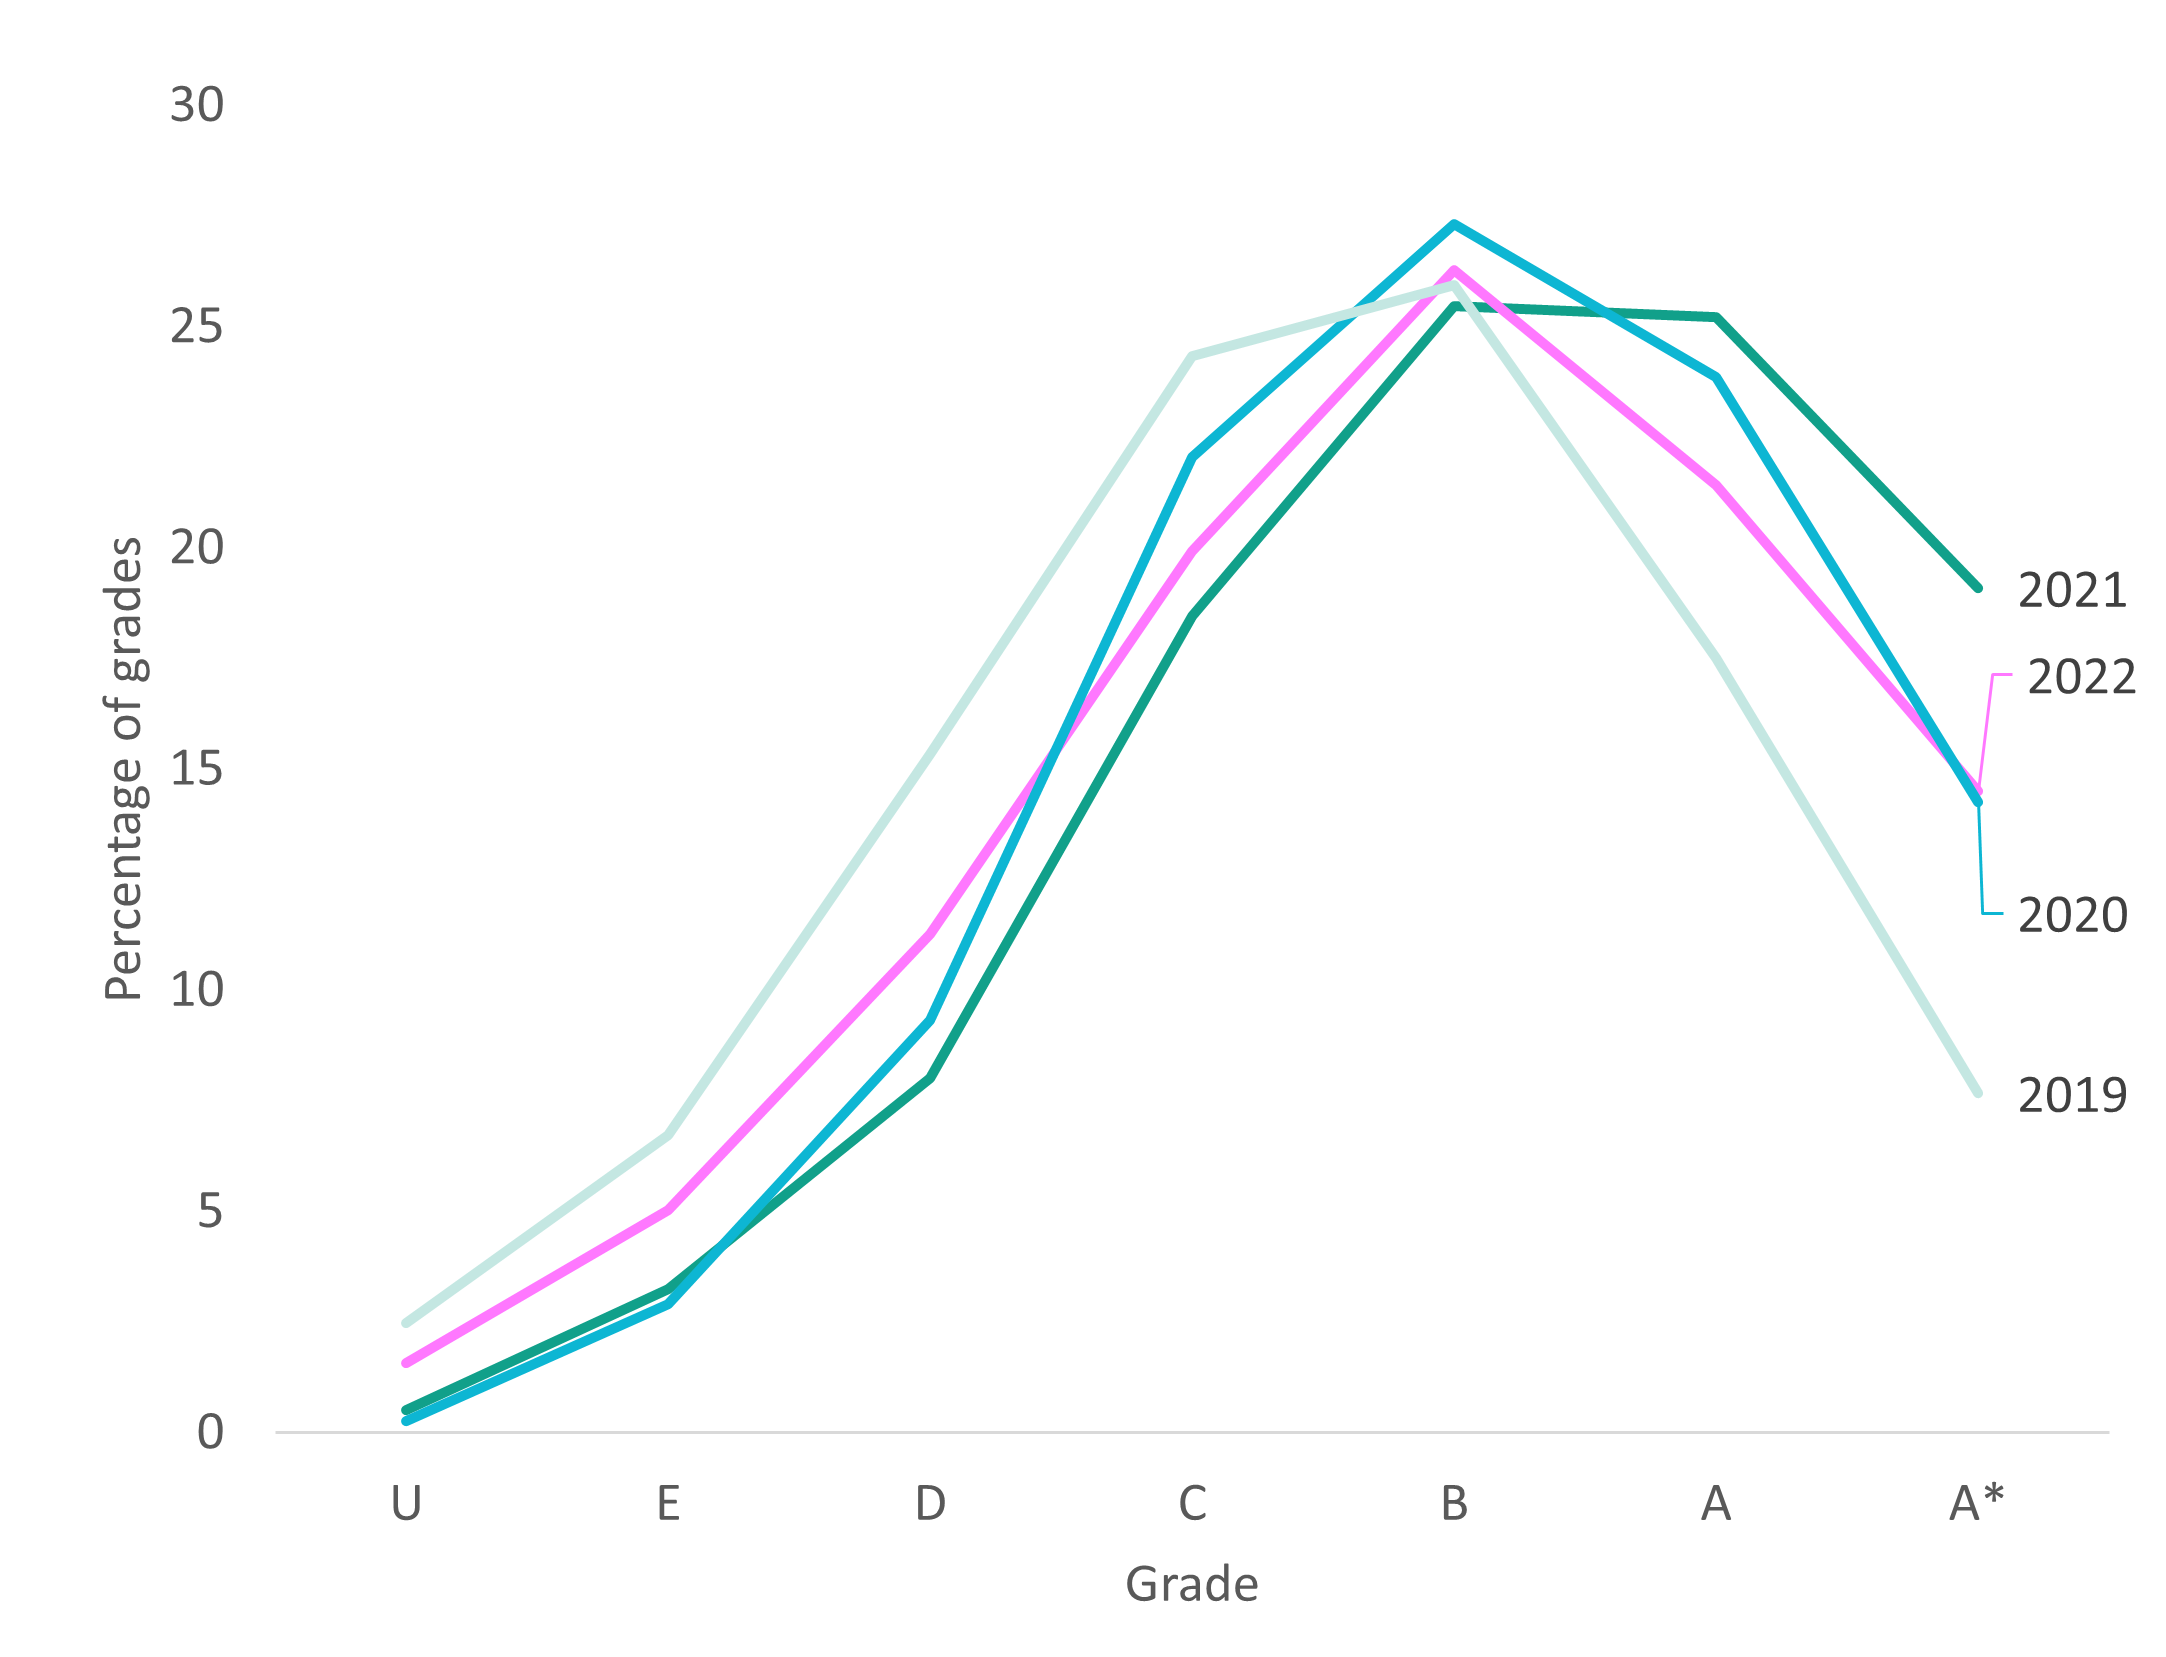
Figure 1 shows that, as planned, the grading distribution in 2022 does sit between the 2019 and 2021 distributions. 35.9% of 2022 grades were A or A* compared with 25.2 per cent in 2019 and 44.3 per cent in 2021. Although this figure appears similar to the 2020 figure, 2022 also sees a higher proportion of students with grades D, E and U, compared with either 2020, or 2021.
Figure 2: Proportion of top grades in A levels by institution type
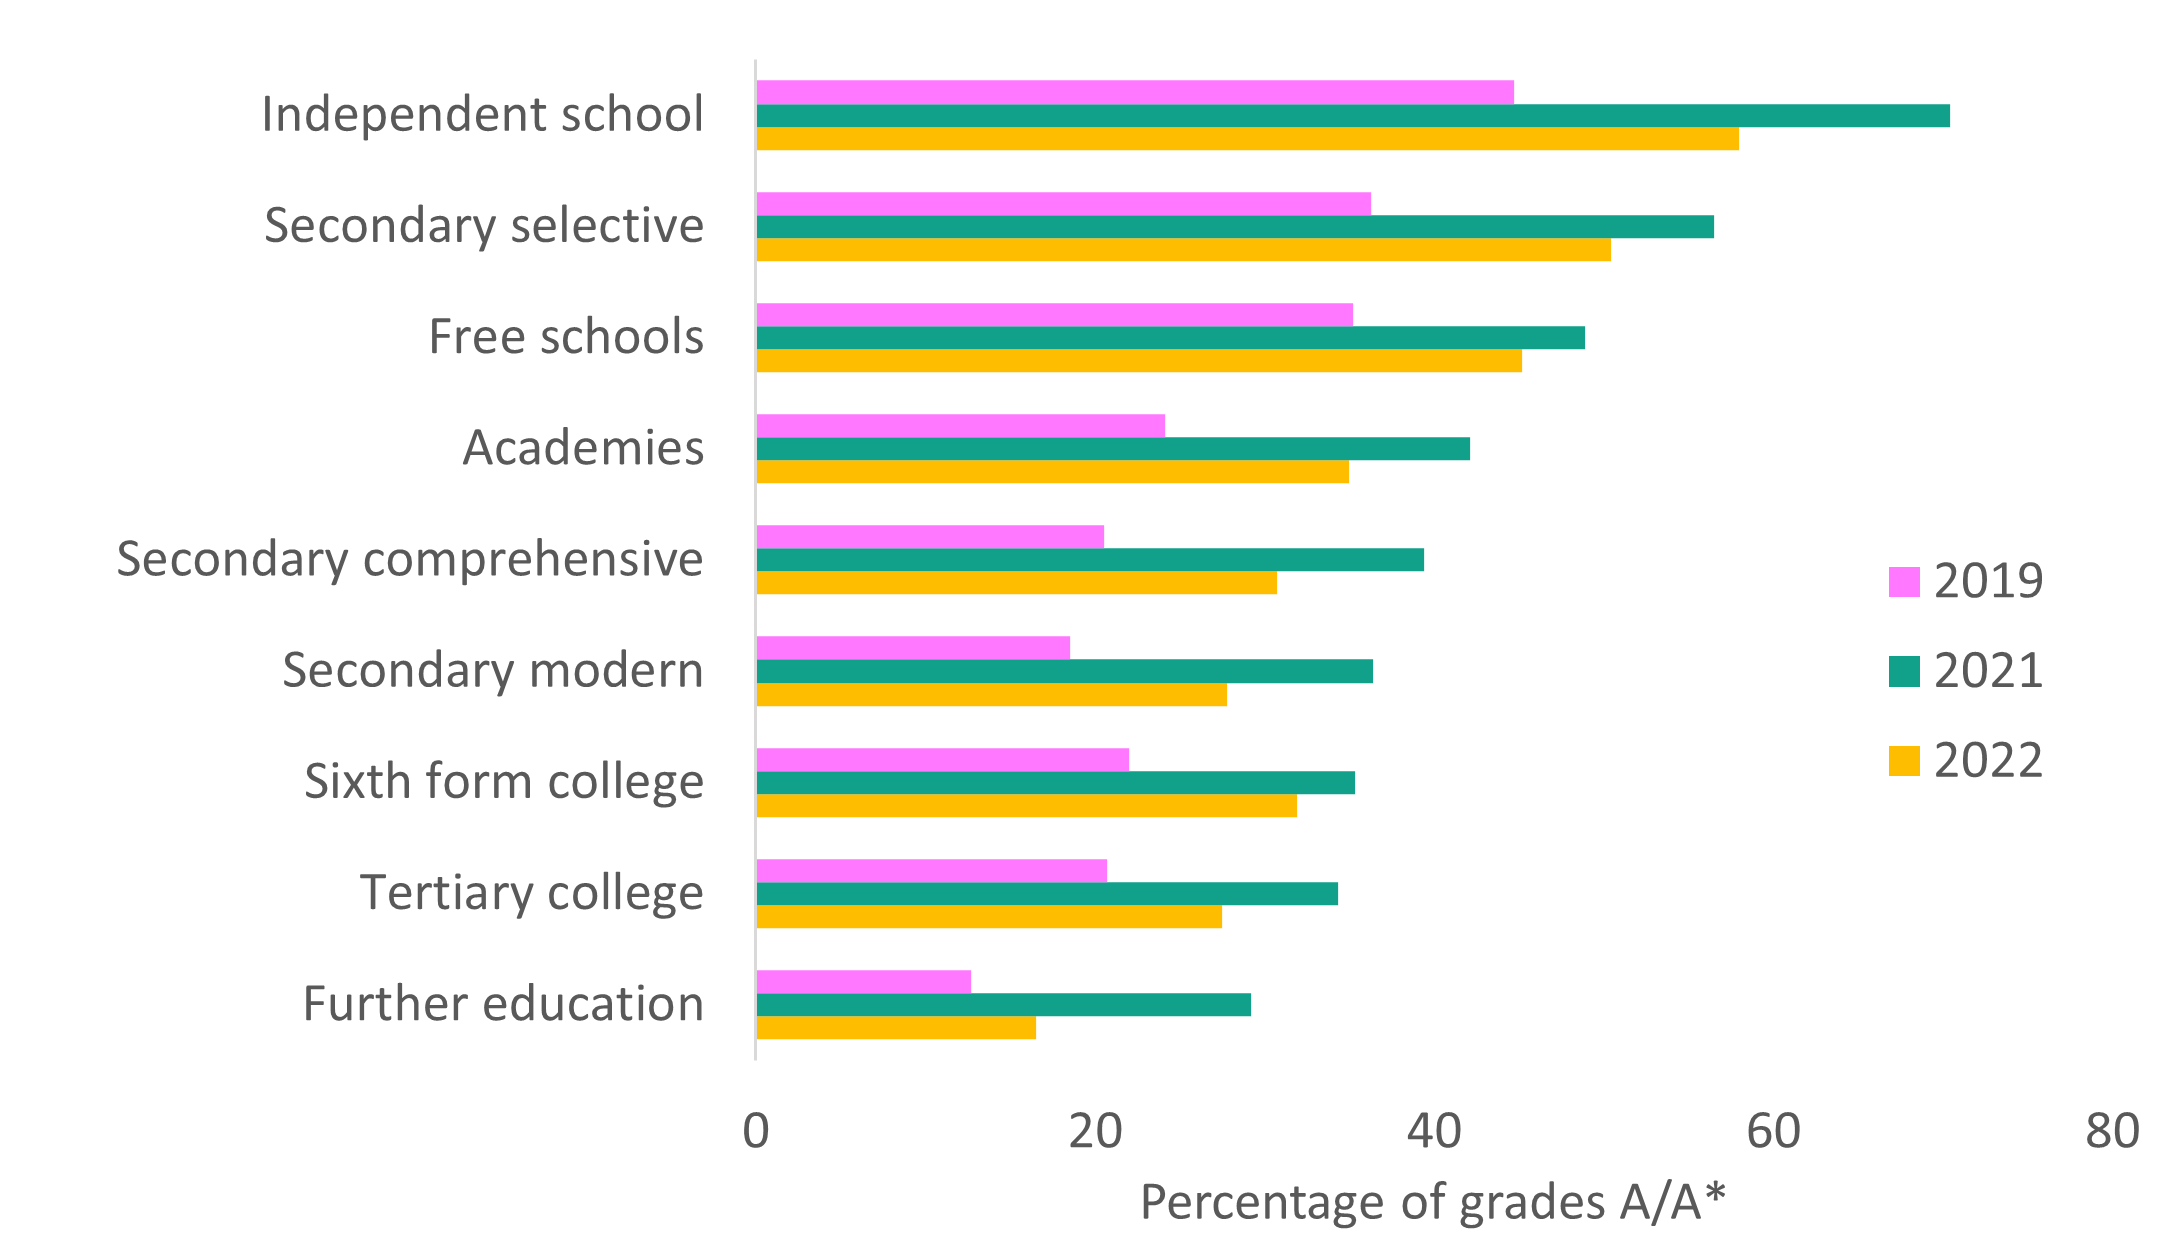
In 2021, the largest increase in top grades occurred in independent schools, likely due to a combination of greater grade increases due to teacher assessed grades, and lower levels of learning loss. As figure 2 shows, the gradual return to pre-pandemic grading also saw independent schools experience a large fall in top grades in 2022. However, whereas the proportion of students achieving top grades in independent school was roughly halfway between the rate in 2019 and 2021, FE colleges saw a much greater decrease in top grades since 2019 than may have been expected. This may have been due to greater learning losses in the FE sector (which serves a greater proportion of disadvantaged students) or different approaches to teacher assessment in 2021. It could also be that FE colleges were disproportionately affected when taking on new students in 2020. It may be that students who wouldn’t otherwise have secured the GCSE grades to access A levels did so under Centre Assessed Grades in 2020. FE colleges are more likely to take on students with GCSE grade just above the threshold, and many of these students may have then struggled with their A levels.
Figure 3: Proportion of top grades in A levels by region
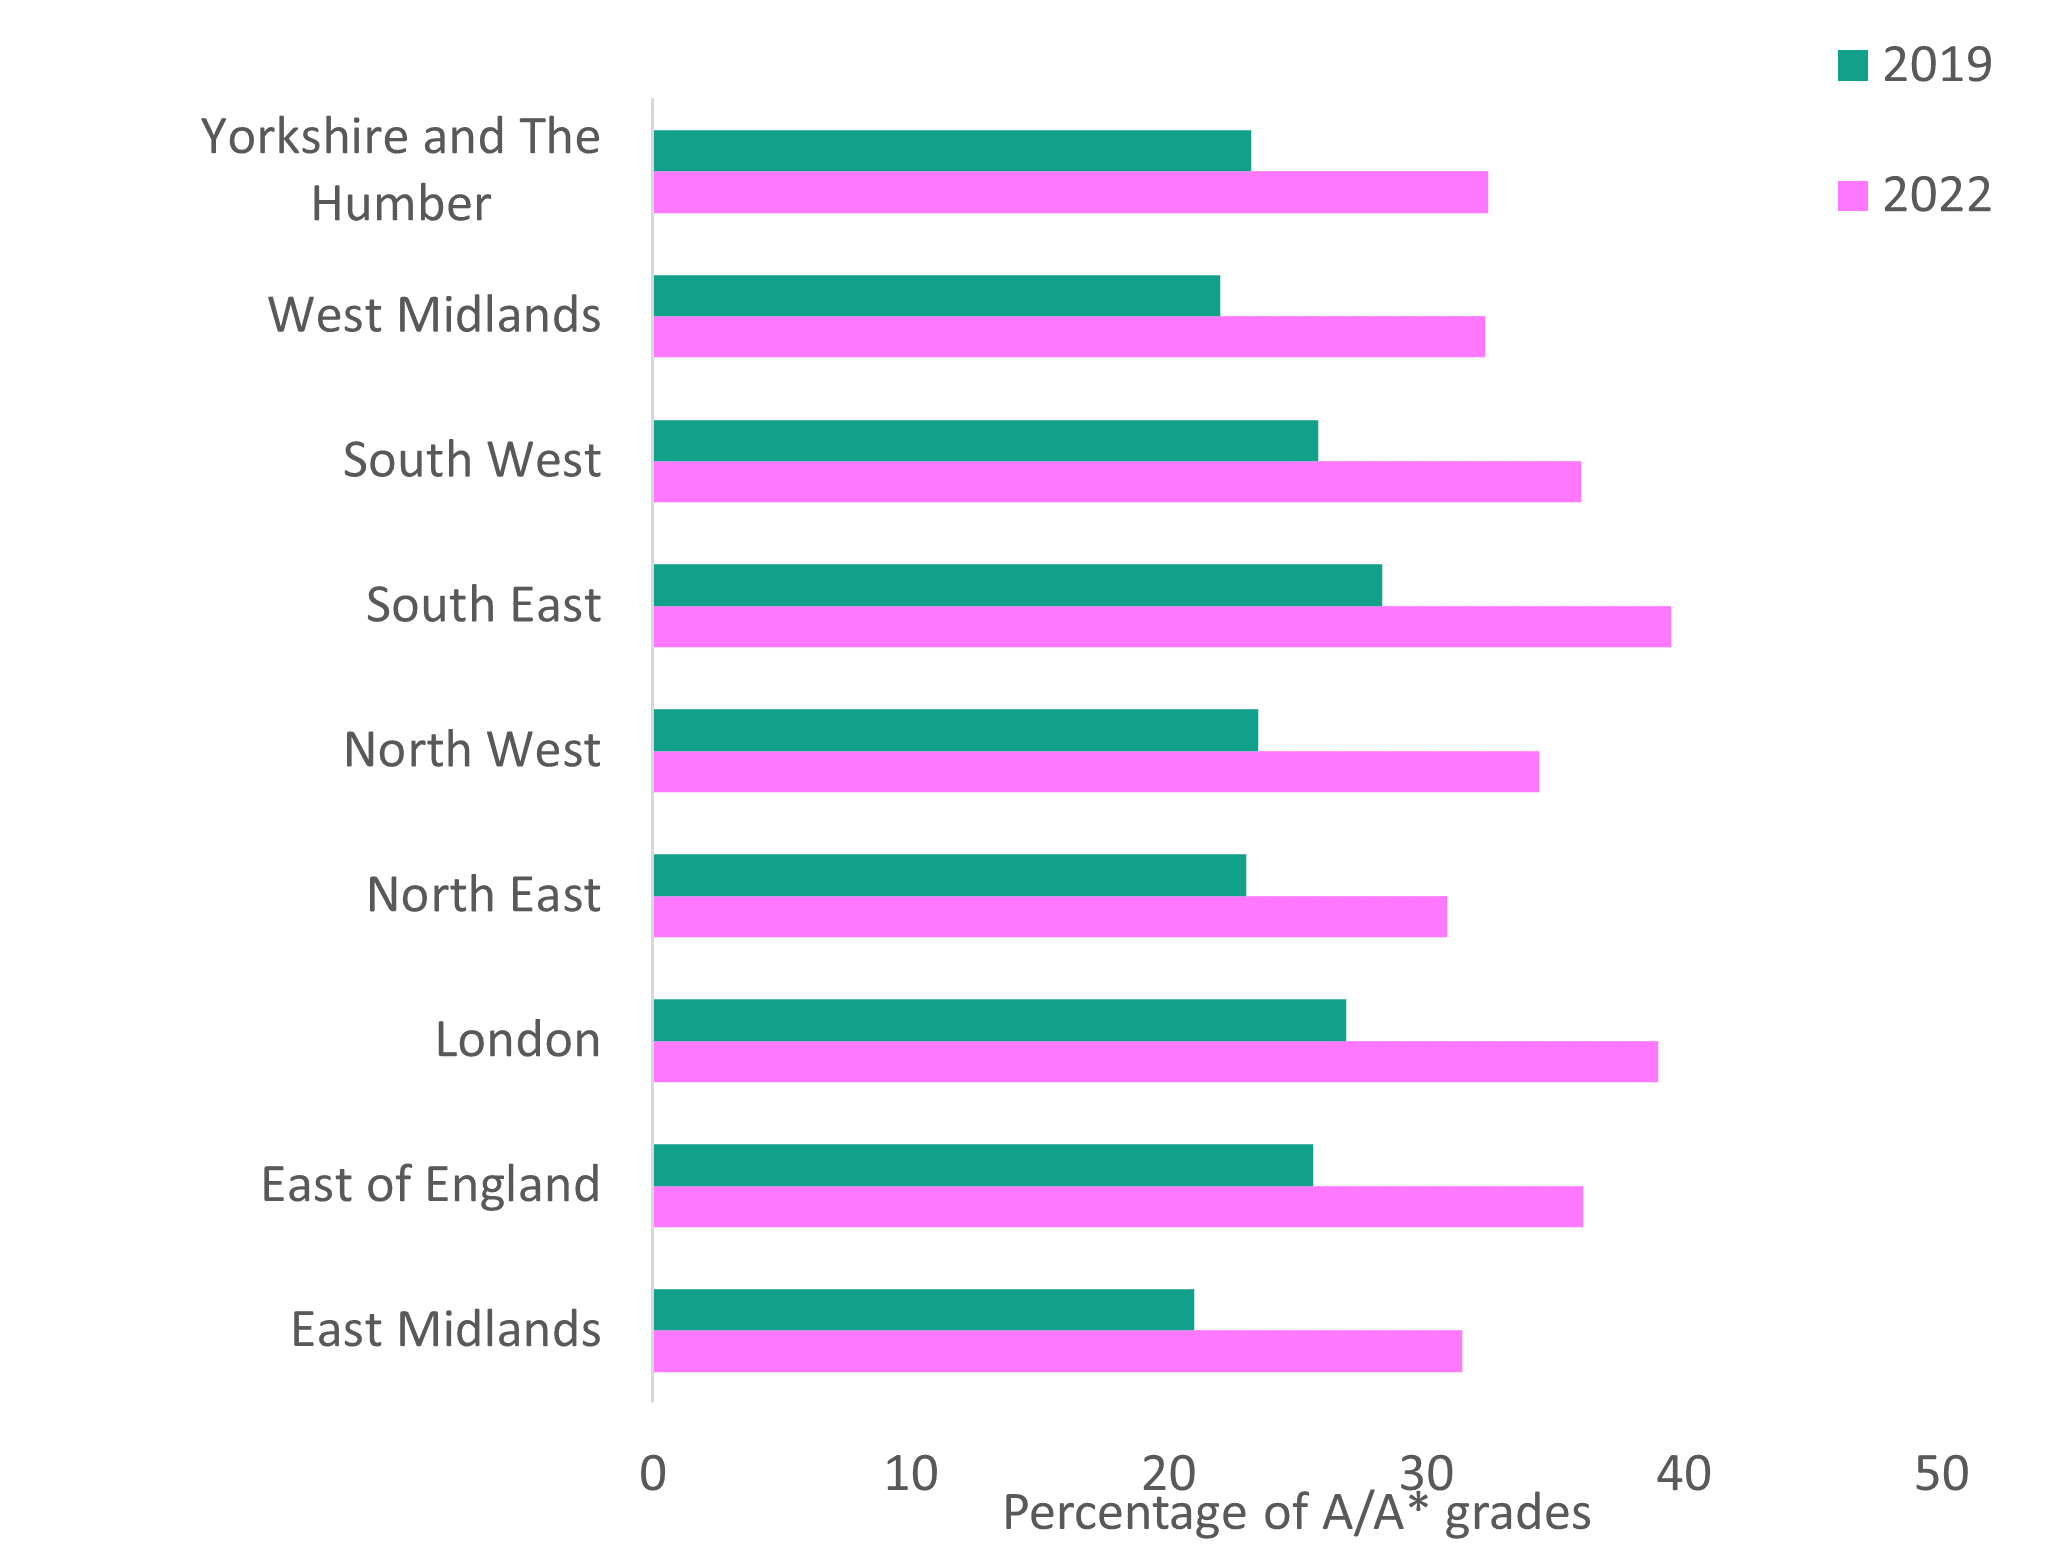
Figure 3 shows that the proportion of students achieving top grades is closest to pre-pandemic levels in the North East, whilst it is still somewhat higher in London and the North West. These differences will have been driven by both the differential impact in the use of teacher assessments in 2021 and differences in learning loss over the past two years. It is also clear that gaps between London and the South East and the rest of England have only grown since 2019, despite the government’s current levelling up agenda.
Figure 4: Male vs female grade increases, compared with 2019
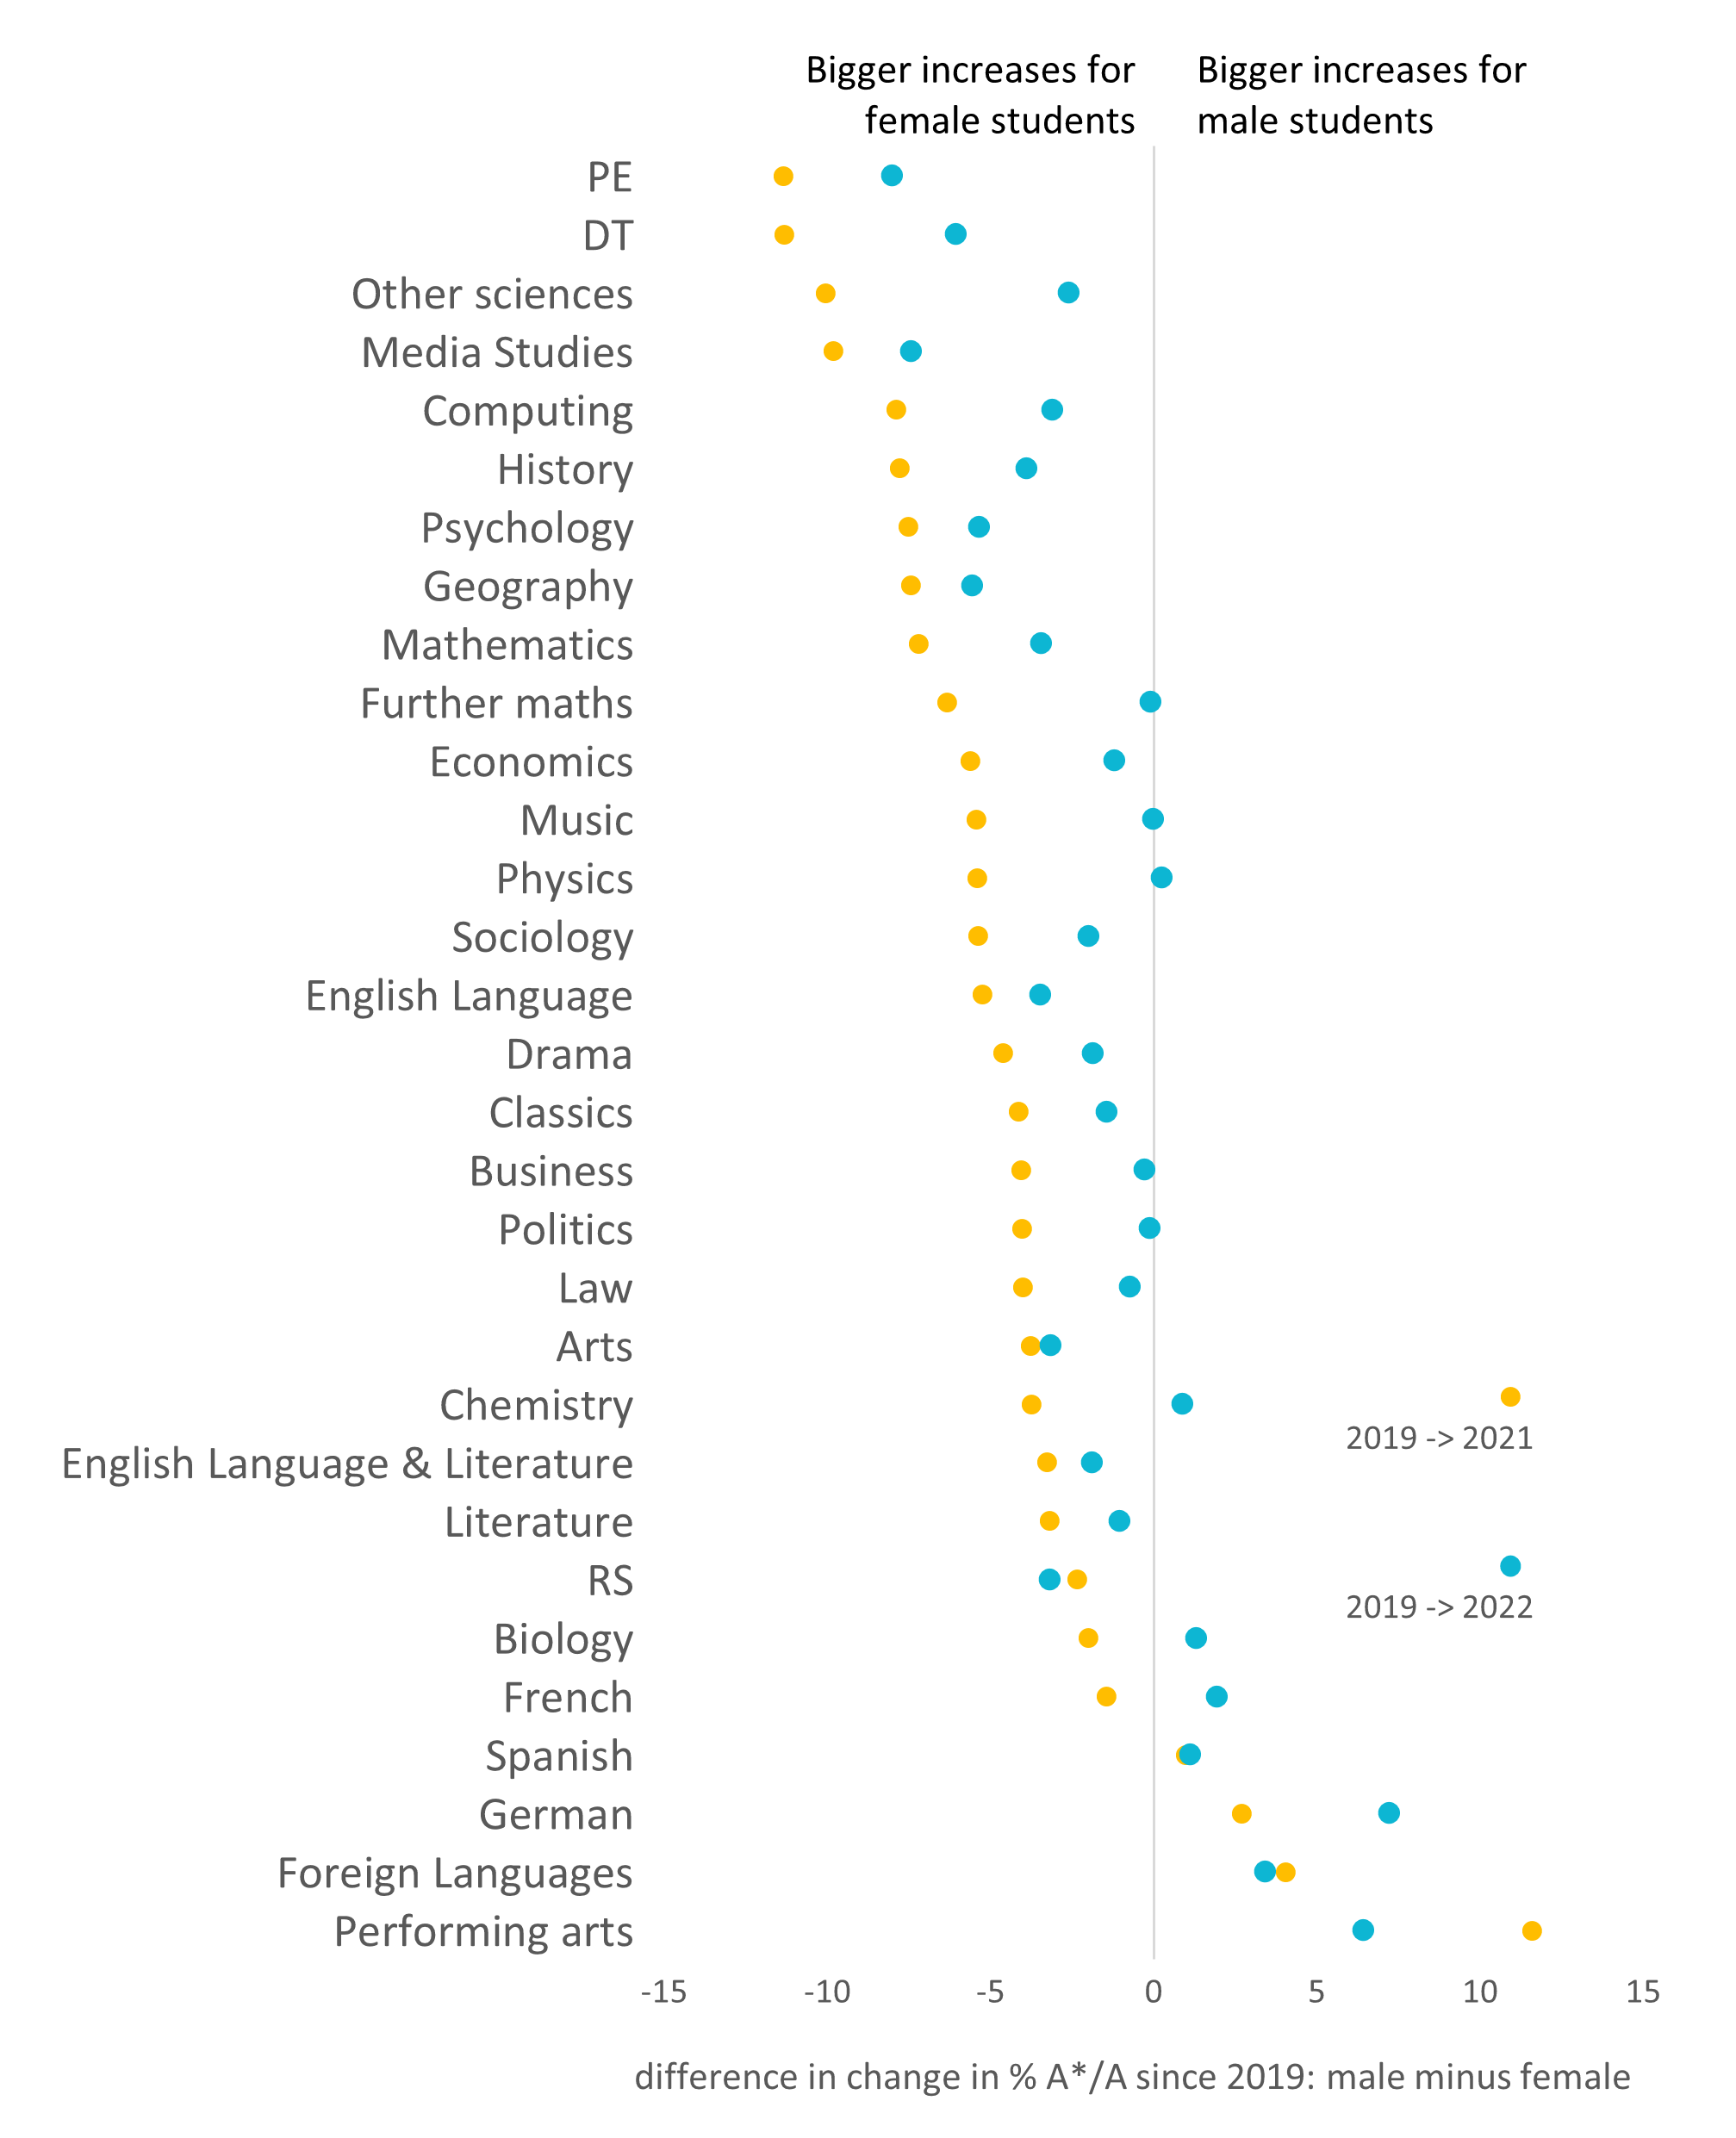
Figure 4 shows that, in 2021, female students saw bigger increases in grades than male students, across most subjects. This is likely to be because existing research suggests that, relative to coursework, final exams favour male students. The use of teacher assessed grades in 2020 and 2021 may then have favoured female students, relative to earlier years. The return to exams in 2022 has seen this gap reduce across most subjects. In chemistry and biology, the trend has reversed since 2021, with greater increases in the proportion of boys getting top grades compared to 2019. Broadly, the additional gains made by female students in stem subjects in 2021 have largely been reversed.
Figure 5: The A level gender gap: attainment and entries in 2022
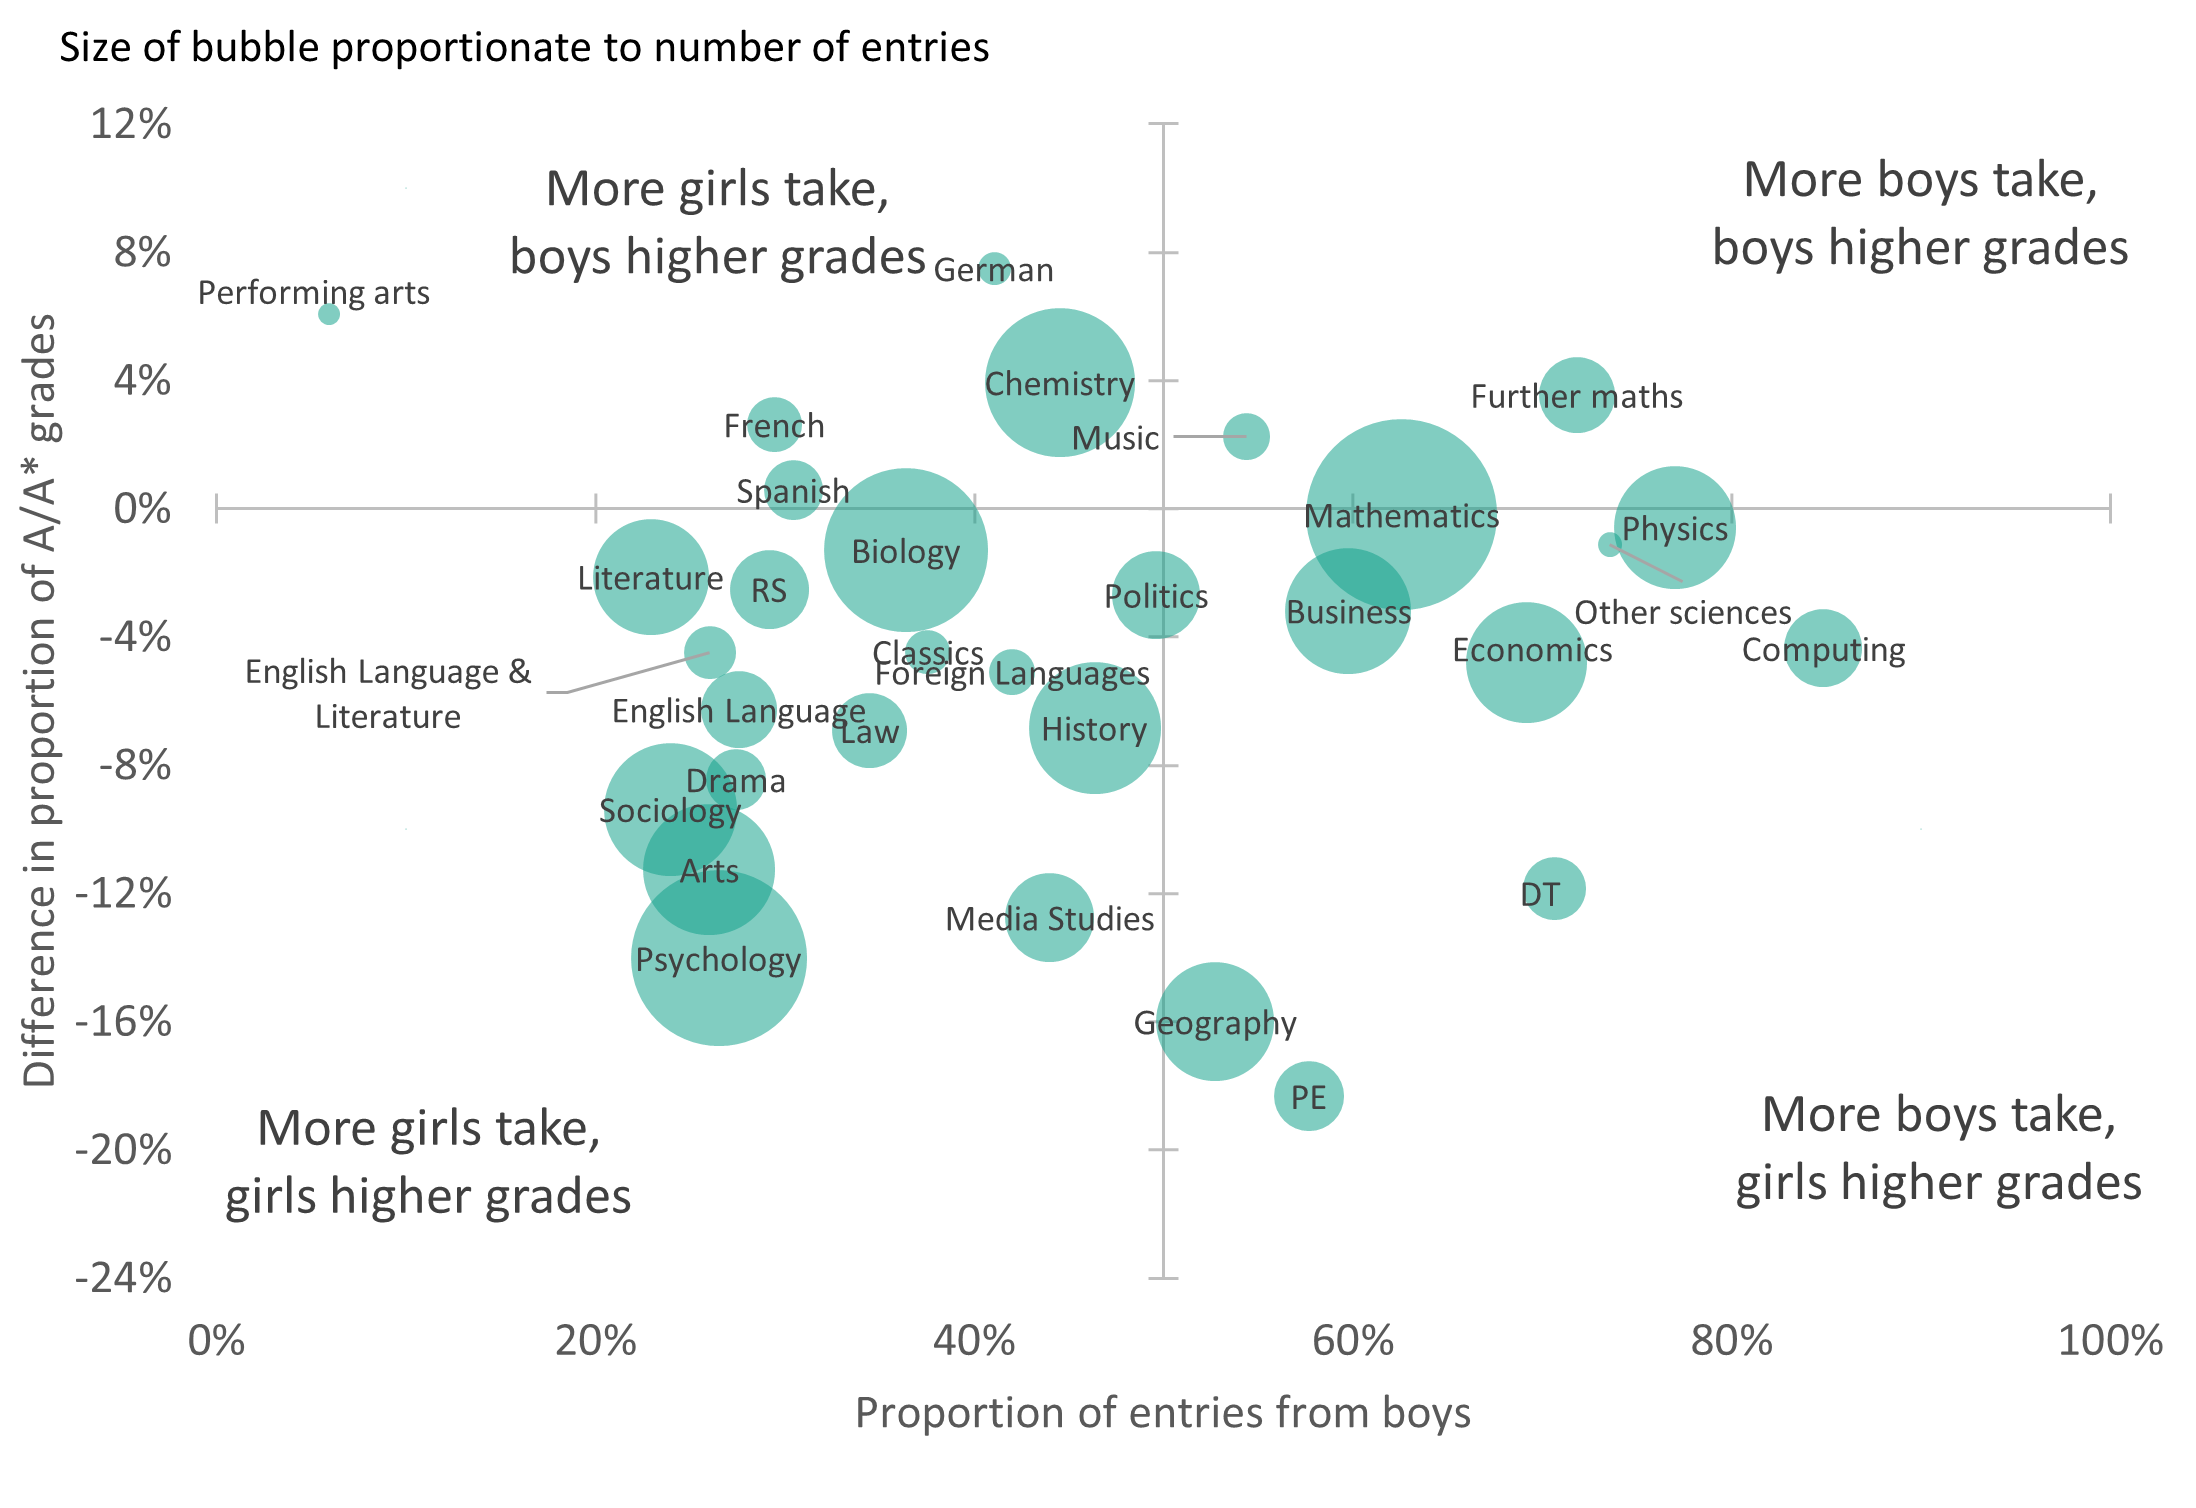
Although female students experienced both the largest grade increases in 2021 and the biggest falls in 2022, in most subjects they still have a higher share of the top grades compared with male students. Figure 5 shows that the subjects most commonly entered by male students aren’t necessarily the ones where they achieve higher average grades, and vice versa. The top left and bottom right quadrants of the chart show the subject areas where this is the case.
Figure 6: Entries for A levels and AS levels
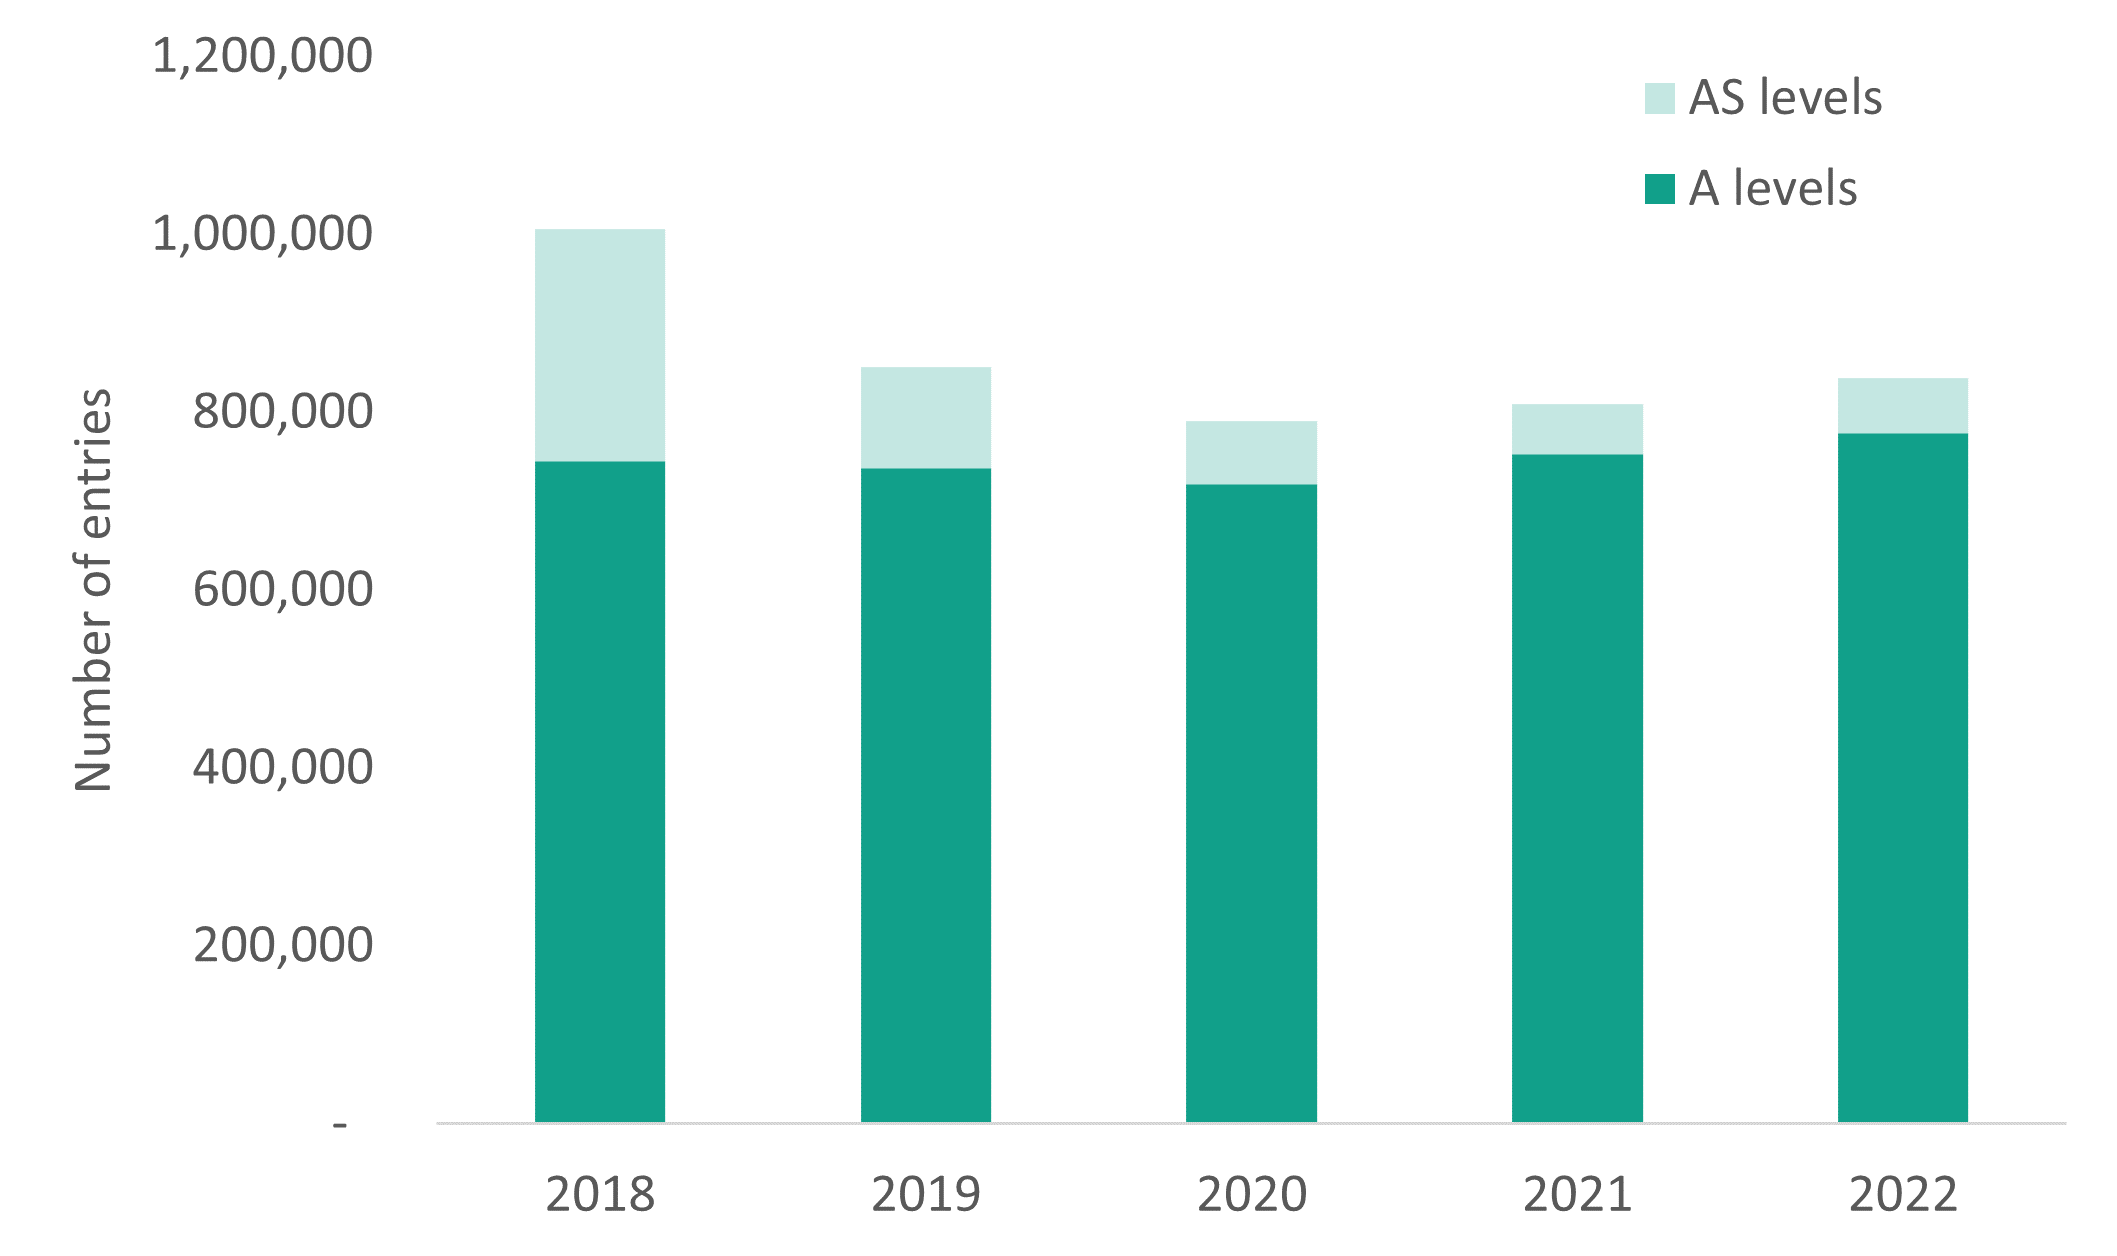
Figure 6 shows that the number of students taking A and AS levels increased very slightly in 2022. This is likely to be down to the greater number of 18-year-olds in the population. However, entry numbers to AS levels are still far lower than 2018. In 2018 there was one AS level entry for every three A levels. By 2022 there was only one AS level for every 13 A levels. The falling popularity of AS levels is related to the decoupling of A level and AS levels alongside funding pressures on sixth forms and colleges. It’s likely to be contributing to the continued narrowing of the breadth of subjects studied by 16-18 year olds. Our research indicates that there is an association between greater breadth and employment outcomes, so this continued narrowing may be detrimental to students’ long-term outcomes.
Figure 7: Completion rates of T levels, compared with rates for existing alternatives to A levels
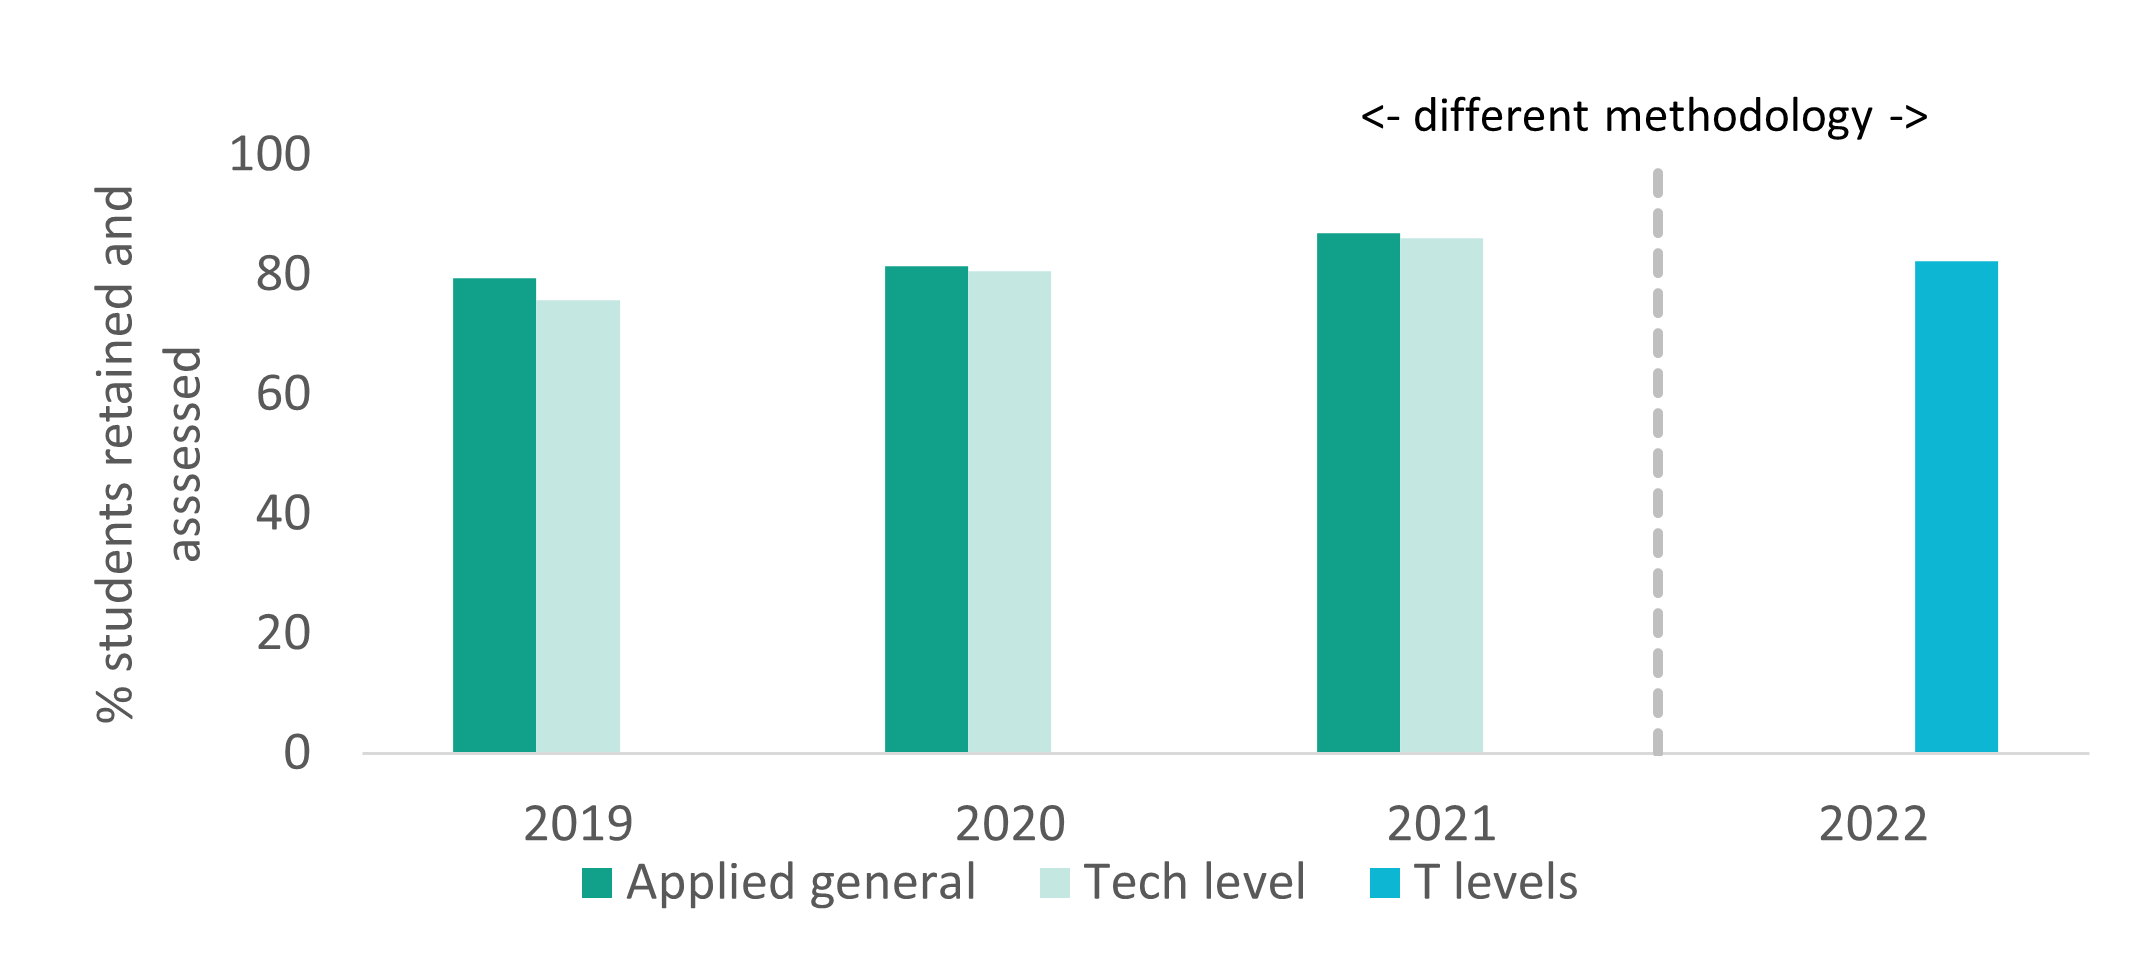
The first cohort of T level students also receive their results today. These new qualifications have been designed as high-status technical alternatives to A levels. The first cohort of T level students began their qualifications in 2020, following either digital, construction or education and childcare courses, with one of 43 providers. Figure 7 shows that, although around 1,300 students began a T level 2 years ago, only around 1,000 completed their T level and received a grade today. This suggests a completion rate of 82 per cent at best, which compares with pre-pandemic completion rates of 79 and 76 per for applied general and tech level qualifications (the existing alternatives to A levels). As the methodology for calculating the completion rates differ, it is difficult to draw any firm conclusions from this comparison, beyond noting that there doesn’t appear to be any specific issues with dropouts from the first wave of T levels. Additionally, this figure may not be an indication of future completion rates for T levels as the first providers received significant support in establishing the courses, and provision of the new qualifications may also improve over time as they become established.
Of greater concern is not what happens to the students who took T levels, but what are the alternatives for those students who don’t have the good grades in GCSE English and maths that most providers require to access these qualifications.
Figure 8: 18-year-olds applying for higher education, UK
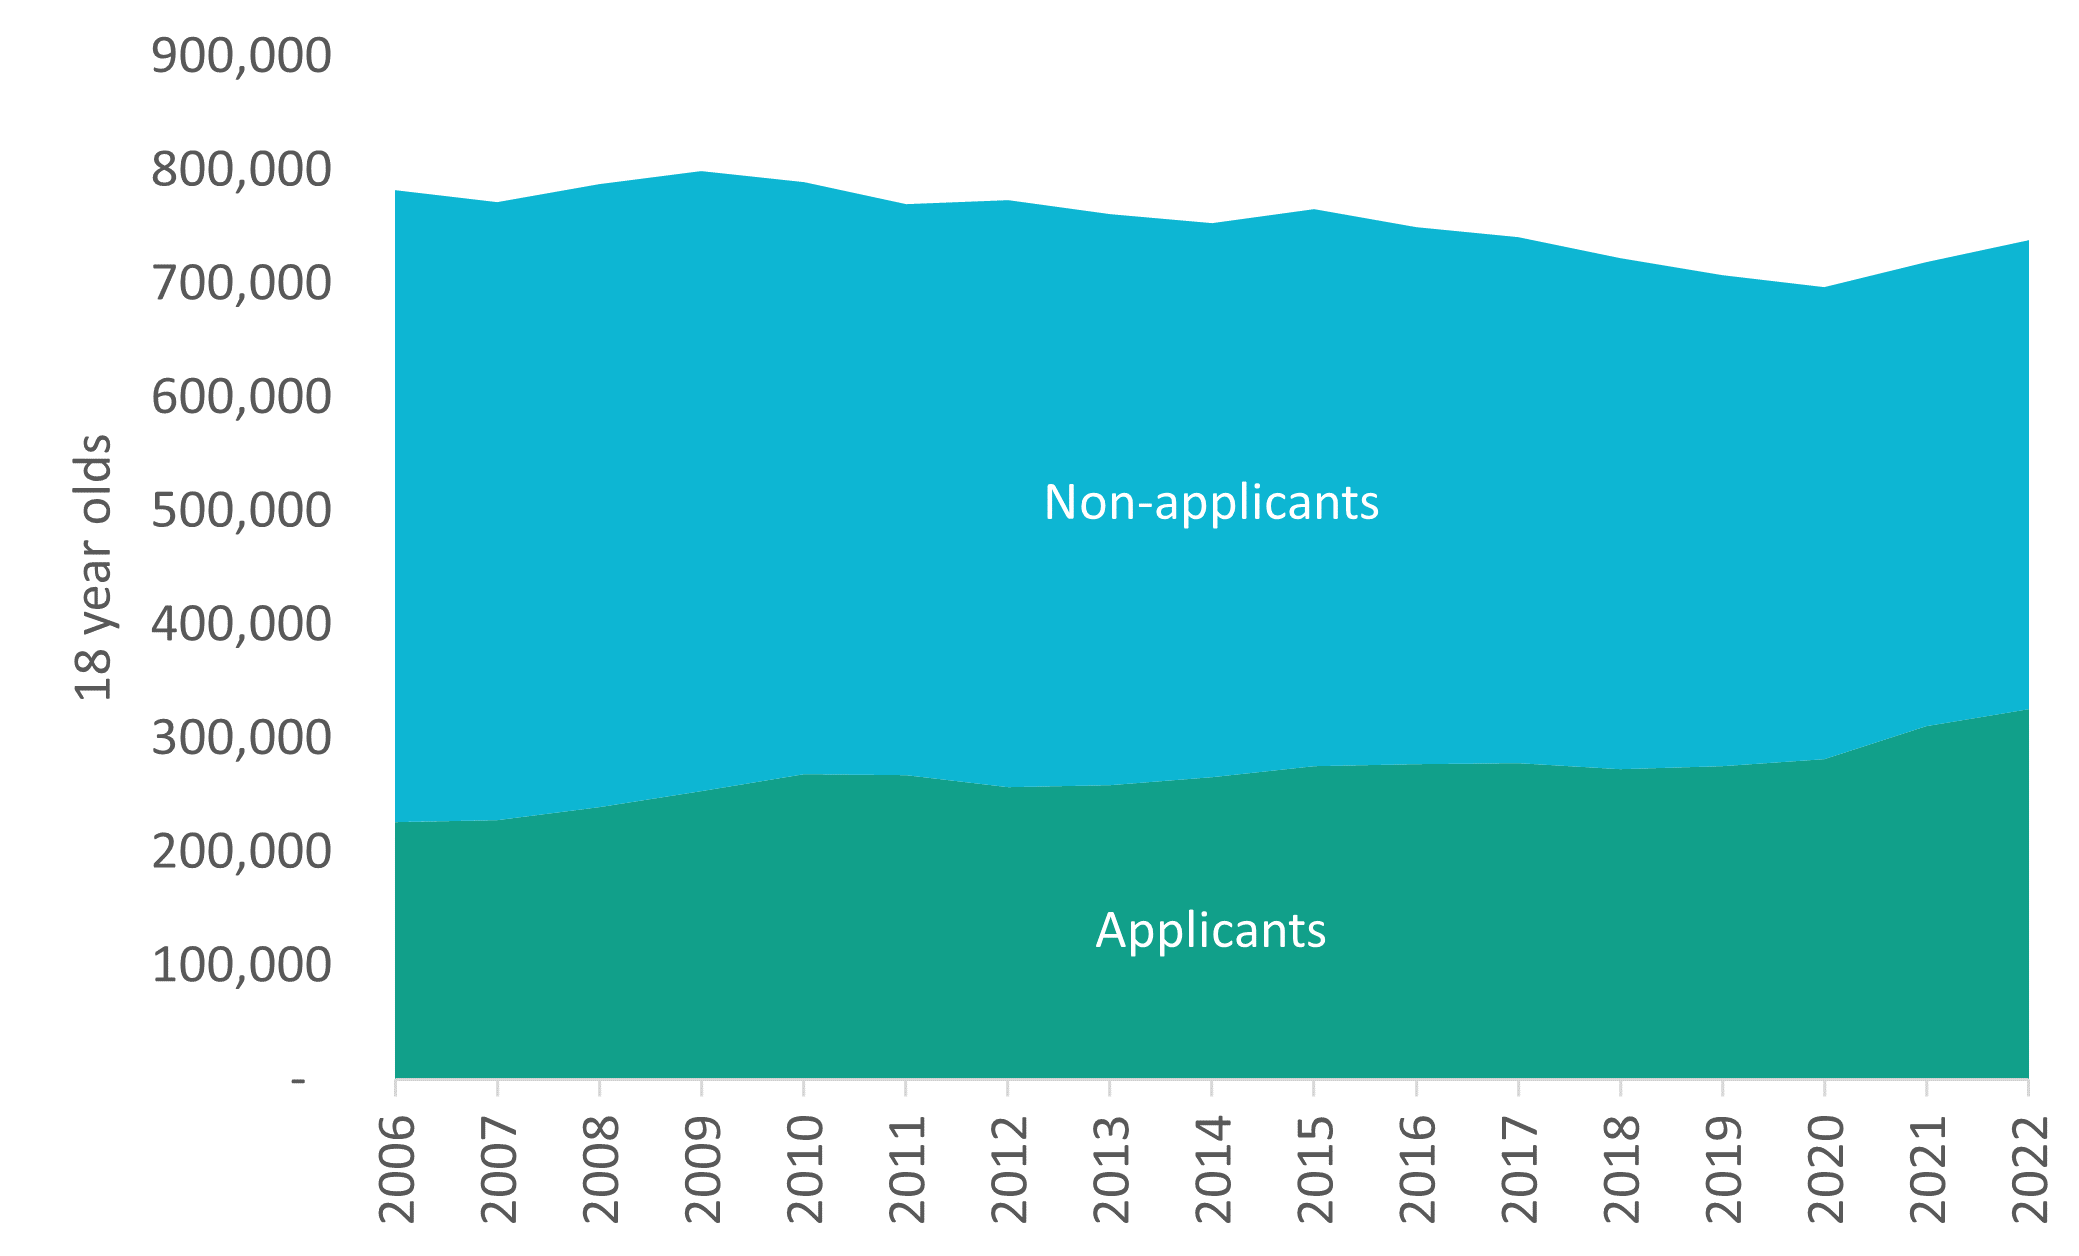
The number of 18-year-olds applying for higher education courses was higher than ever in 2022. As figure 8 shows, this was driven by both an increase in the 18-year-old population and an increase in the proportion of those applying. In addition, a larger than usual number of 18-year-olds who deferred in 2021 will begin their courses this year. These factors may have contributed to many popular universities increasing their grade requirements for 2022, and the offer rate falling from 73 per cent in 2019 to 66 per cent in 2022. UCAS data released today confirmed that the number of student’s securing their first or insurance place was second only to the record set in 2021, under teacher assessed grades. However, it also showed that a record number of students were free to be placed into clearing. As such this year’s clearing may be particularly competitive. Students may need to take a wider view when considering their alternatives, including considering whether an apprenticeship or vocational route would be right for them.
More broadly, a fuller, student-level analysis is needed as more data becomes available in the months ahead to understand the consequences fully. Of particular concern this year is what’s happened to the disadvantage attainment gap in 2022, which before the pandemic already stood at the equivalent of three A level grades. Previous EPI research highlighted that, under teacher assessments, results for academic qualifications increased to a greater extent than grades for applied equivalents did, such as BTECs. As A level grades remain above 2019 levels, this gap is likely still present, and will need to be taken into account when universities make their final offers through clearing.
Today’s results show that grades, at least, are beginning to return to their pre-pandemic status. However, re-setting grade boundaries was the easy part. The government must now make much more progress in addressing the long-standing educational inequalities that have only widened in the midst of the pandemic.