Summary
- The number of teaching assistants employed by state-funded schools in England has more than trebled since the turn of the century and they now represent a quarter of the school workforce.
- Teaching assistants are far more prevalent in primary and special schools than they are in secondary schools and are also more common in schools with high levels of disadvantage. In fact, the characteristics of schools have a far greater effect on the pupil / teaching assistant ratio than they do on the pupil / teacher ratio.
- Per pupil expenditure on education support staff (a wider category which includes teaching assistants) increased by 138 per cent in real terms between 2002-03 and 2016-17.[1] This rate of increase is eight times that seen in expenditure on teachers. 15p in every pound spent by schools is on education support staff.
- The top quartile of expenditure on education support staff in primary schools in 2017 was 51 per cent higher than the lowest quartile of expenditure. Amongst secondary schools this difference was 64 per cent.
- Primary academies spend less per pupil on education support staff than local authority maintained primary schools, and this is seen to an even greater extent in the largest academy trusts – once you control for other school characteristics. The picture is less clear for secondary academies, where schools in the largest trusts spend more per pupil on teaching assistants than other academies, and local authority-maintained schools.
- Even amongst schools with similar characteristics (e.g. level of disadvantage) there is a wide range of different levels of expenditure on education support staff. Amongst primary schools with high levels of free school meal eligibility (over 25 per cent of pupils eligible for FSM), schools at the top quartile of expenditure spent 45 per cent more than schools at the bottom quartile. Amongst secondary schools with high levels of FSM eligibility the difference was 69 per cent.
- This range is more significant than what we see when we do a similar analysis of expenditure on teaching staff.
Discussion
Teaching assistants represent a significant proportion – just over a quarter – of the school workforce. They are deployed in a number of different ways. Research published by the Department for Education identified in-class targeted support – such as for those with special educational needs, or with English as an additional language – as the most common use of teaching assistants in secondary schools and the second most common in primary.[2] Other uses include intervention outside of classes, as well as personal support for pupils with mobility issues and supervisory roles at lunchtime or in after school clubs.
Research suggests that teaching assistants can have a positive benefit on attainment, but how they are deployed is highly relevant. For example, the Education Endowment Foundation’s toolkit highlights that where TAs provide support to individuals or small groups they can have ‘moderate positive benefits’ on attainment, but providing general classroom support does not have a measurable impact on attainment and in fact, some studies have shown that the presence of a teaching assistant can have a detrimental impact on low attaining pupils or those with special educational needs.[3]
These studies were carried out during a period of rapid growth in the number of teaching assistants. At the turn of the century there were 79,000 full-time equivalent teaching assistants in state-funded schools in England. Within seven years that number had doubled, and that growth continued so that by 2016, where the trend finally flattened, there were around 260,000 teaching assistants in England’s schools – more than treble the number in 2000.
Figure 1 shows how the trend in teaching assistants has occurred in different phases of education. Note that a consistent time series is only possible from 2005 onwards which is later than the increases began, so understates the full scale of the change.
Figure 1: Number of teaching assistants (full time equivalent, ‘000s) by phase 2005 to 2019 [4]
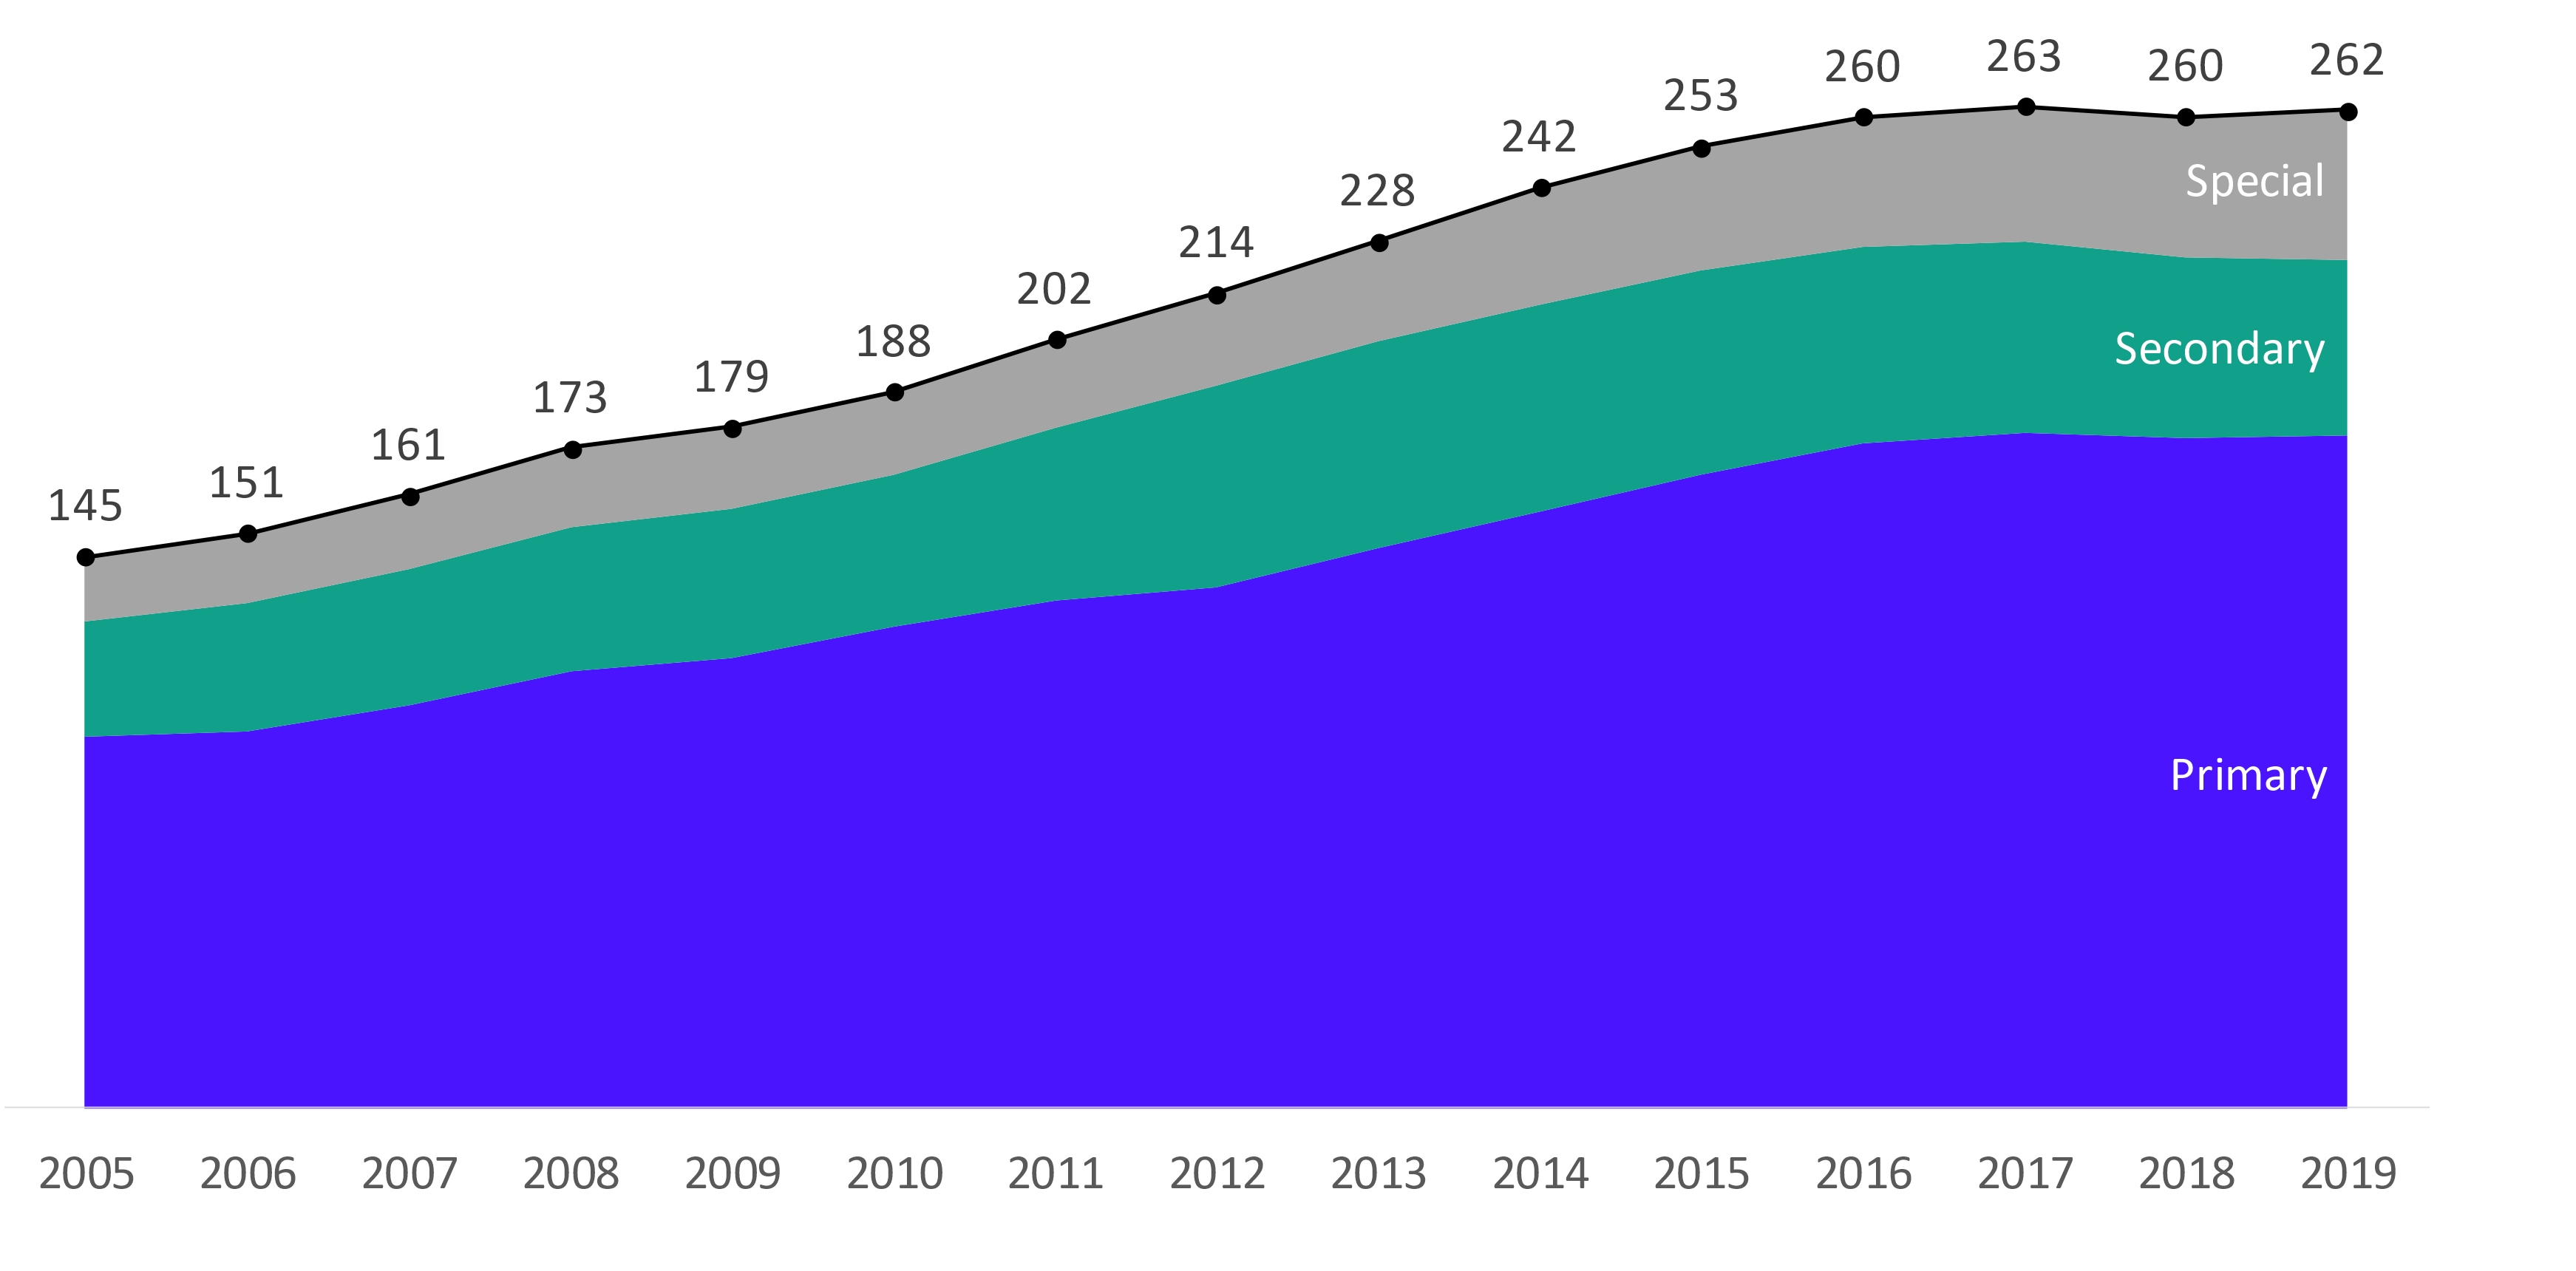
The majority of teaching assistants (around two-thirds) are in primary schools, with 18 per cent in secondary schools and 15 per cent in special schools. This split is somewhat different from the overall split in pupil numbers, where around 57 per cent of pupils are in primary schools, 41 per cent in secondary schools, and 2 per cent in special schools. In other words, primary schools, and even more so special schools, have a disproportionate number of teaching assistants.
This naturally leads to very different rates of the pupil / teaching assistant ratio (i.e. number of pupils divided by then number of teaching assistants which for brevity we will call PTAR). Figure 2 shows how this ratio changed between 2005 and 2019.
Figure 2: Pupil / teaching assistant ratio (PTAR) 2005 to 2019
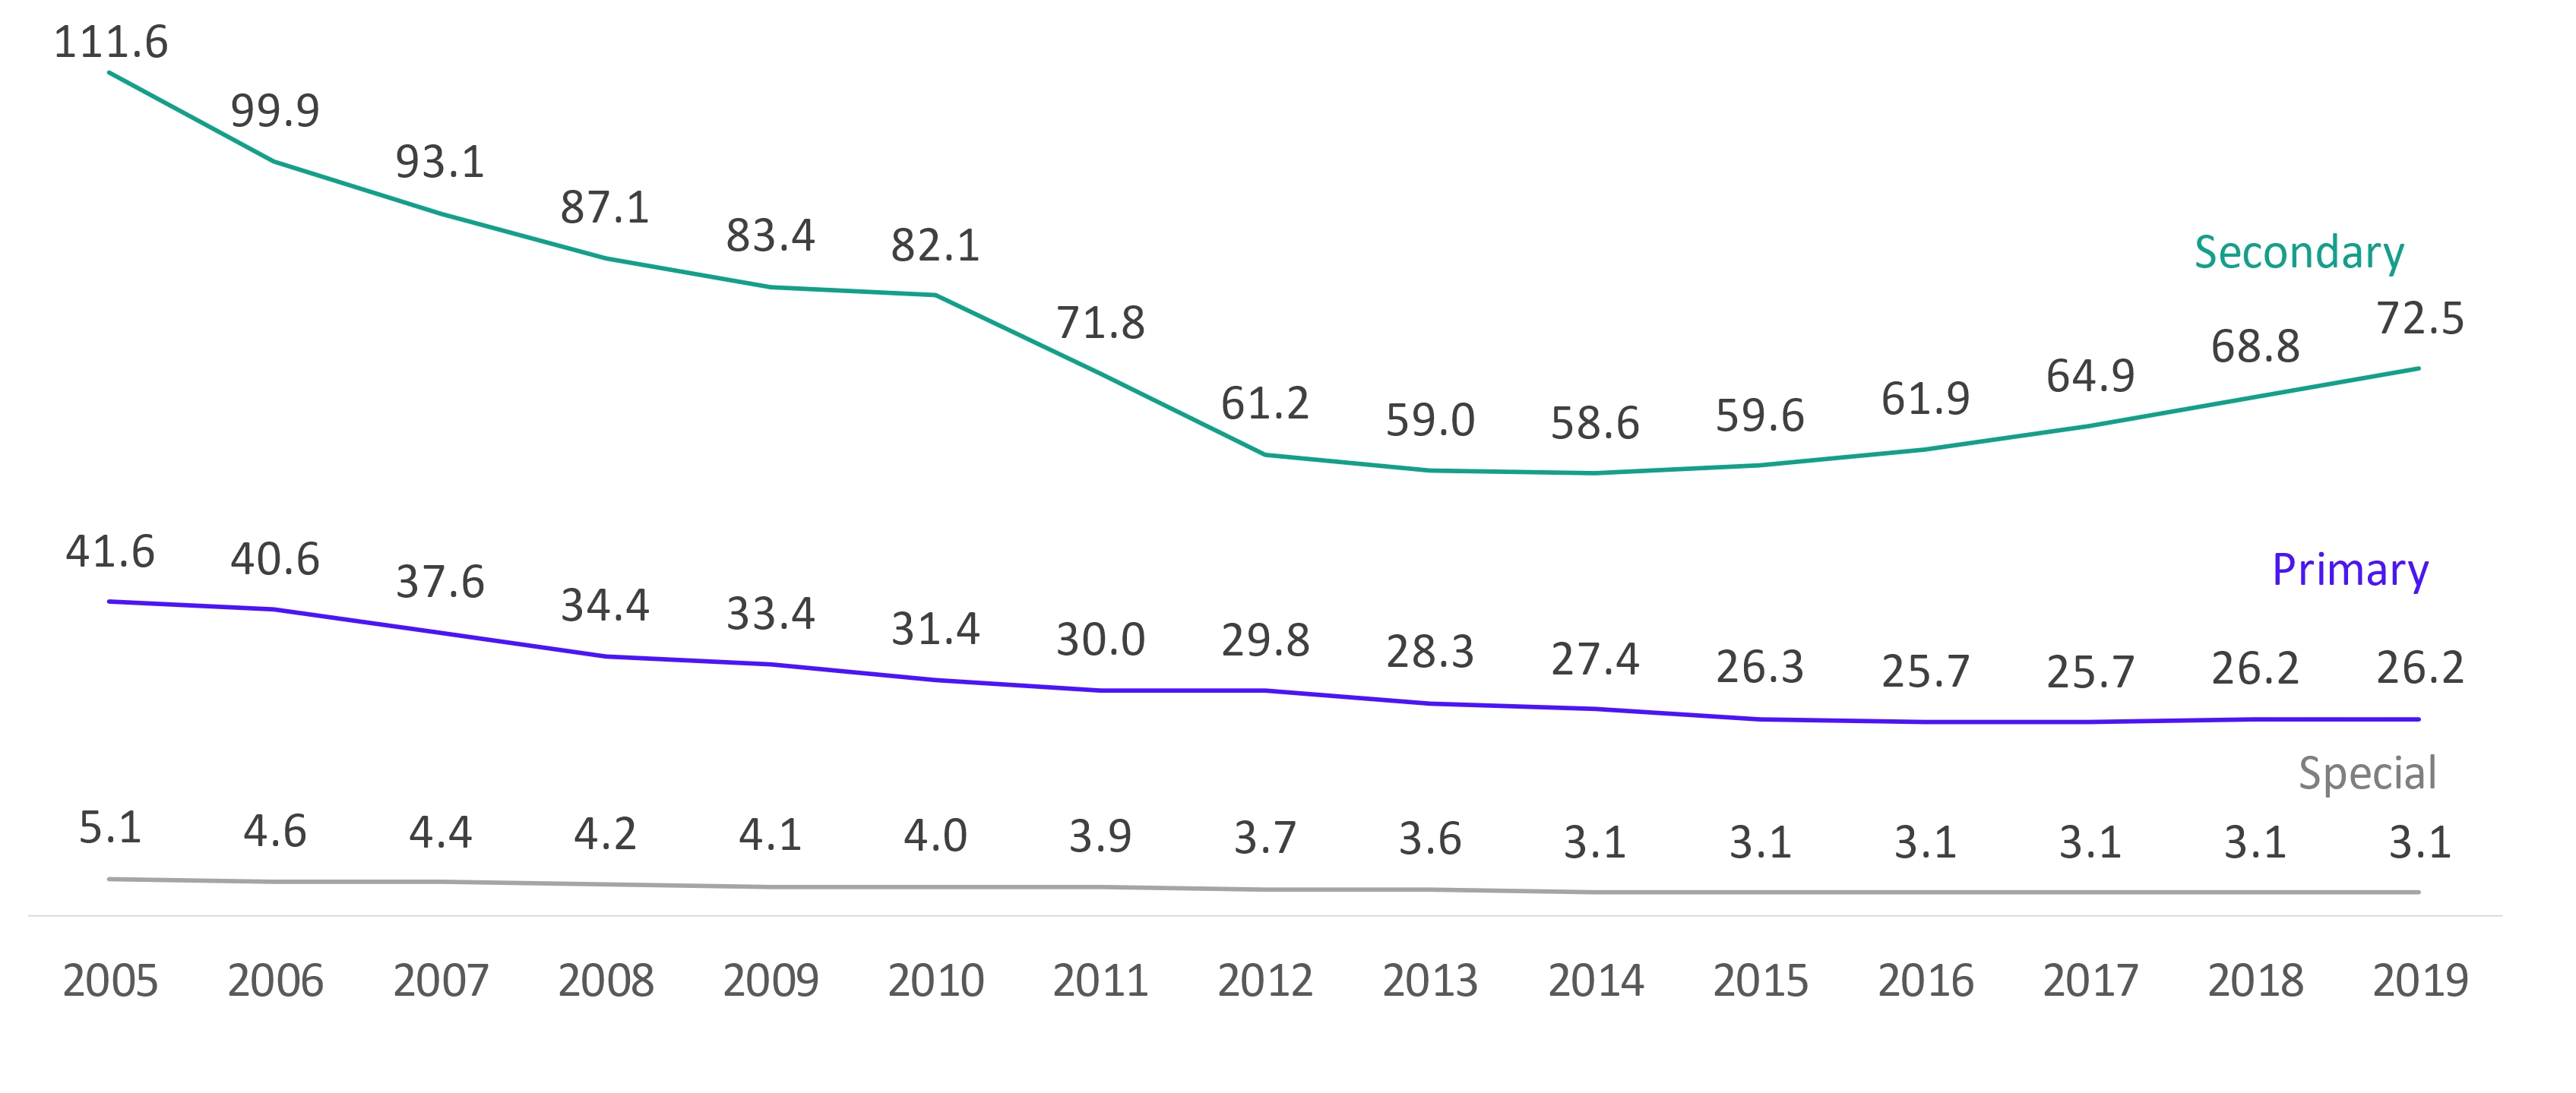
Over the long term, and in all phases, the PTAR has reduced (i.e. over the long term, the number of teaching assistants has grown more quickly than the number of pupils.).
In the decade between 2005 and 2015, the number of pupils per teaching assistant in primary schools fell by over a third from 41.6 to 26.3. It has remained at around 26 since 2015. There was a similar fall in the ratio in special schools over the same period, falling from 5.1 to 3.1 where it has remained. In recent years the number of pupils in special schools has grown rapidly (up by a quarter in the last five years) and the number of teaching assistants has increased at a similar rate. We saw in our earlier analysis that this was not the case for teachers in special schools and the pupil teacher ratio has been increasing.
In secondary schools the PTAR fell rapidly between 2005 and 2014, almost halving, but in recent years it has begun to increase again as teaching assistant numbers have fallen at a time of pupil number growth.
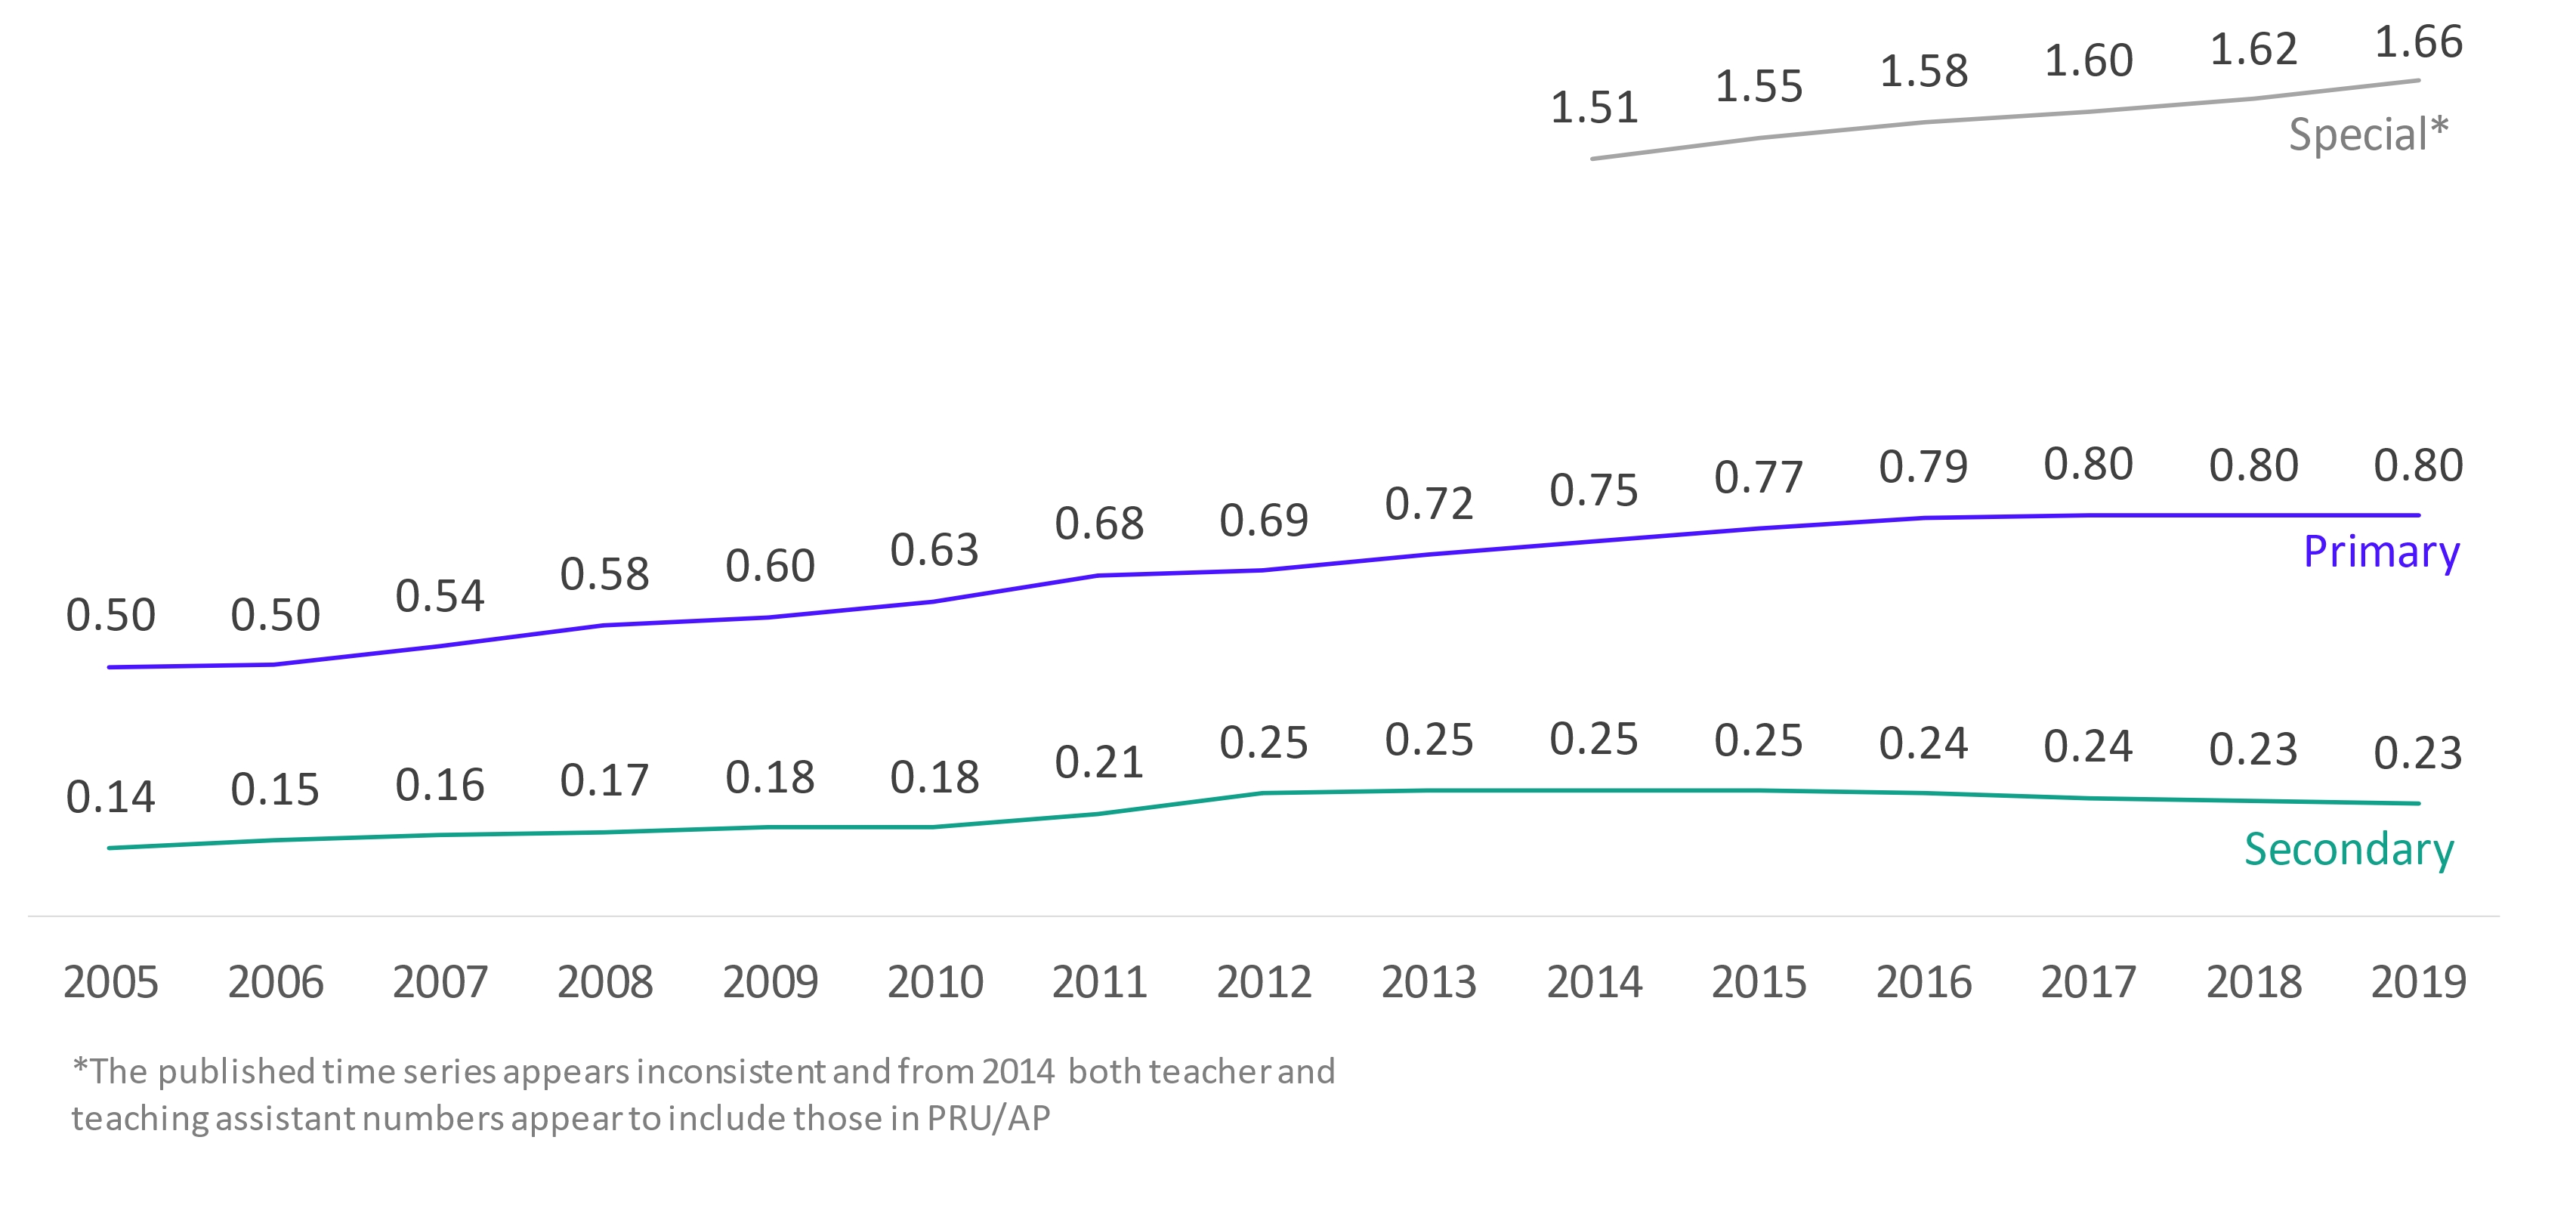
A further way of exploring this is to look at the relationship between the number of teaching assistants and the number of teachers. Figure 3 shows that in primary schools the number of teaching assistants per teacher has increased from 0.50 to 0.80, in secondary schools it has increased from 0.14 to 0.23. Both of these ratios have been largely stable in recent years. Note that we have been unable to produce a complete time series for special schools because of inconsistencies in the way that teacher numbers were reported over this period, and these figures also include pupil referral units and alternative provision. However, they demonstrate the relative importance of teaching assistants in specialist settings, with more TAs than teachers.
Figure 3: Number of teaching assistants per teacher by phase, 2005 to 2019
Numbers by school characteristics
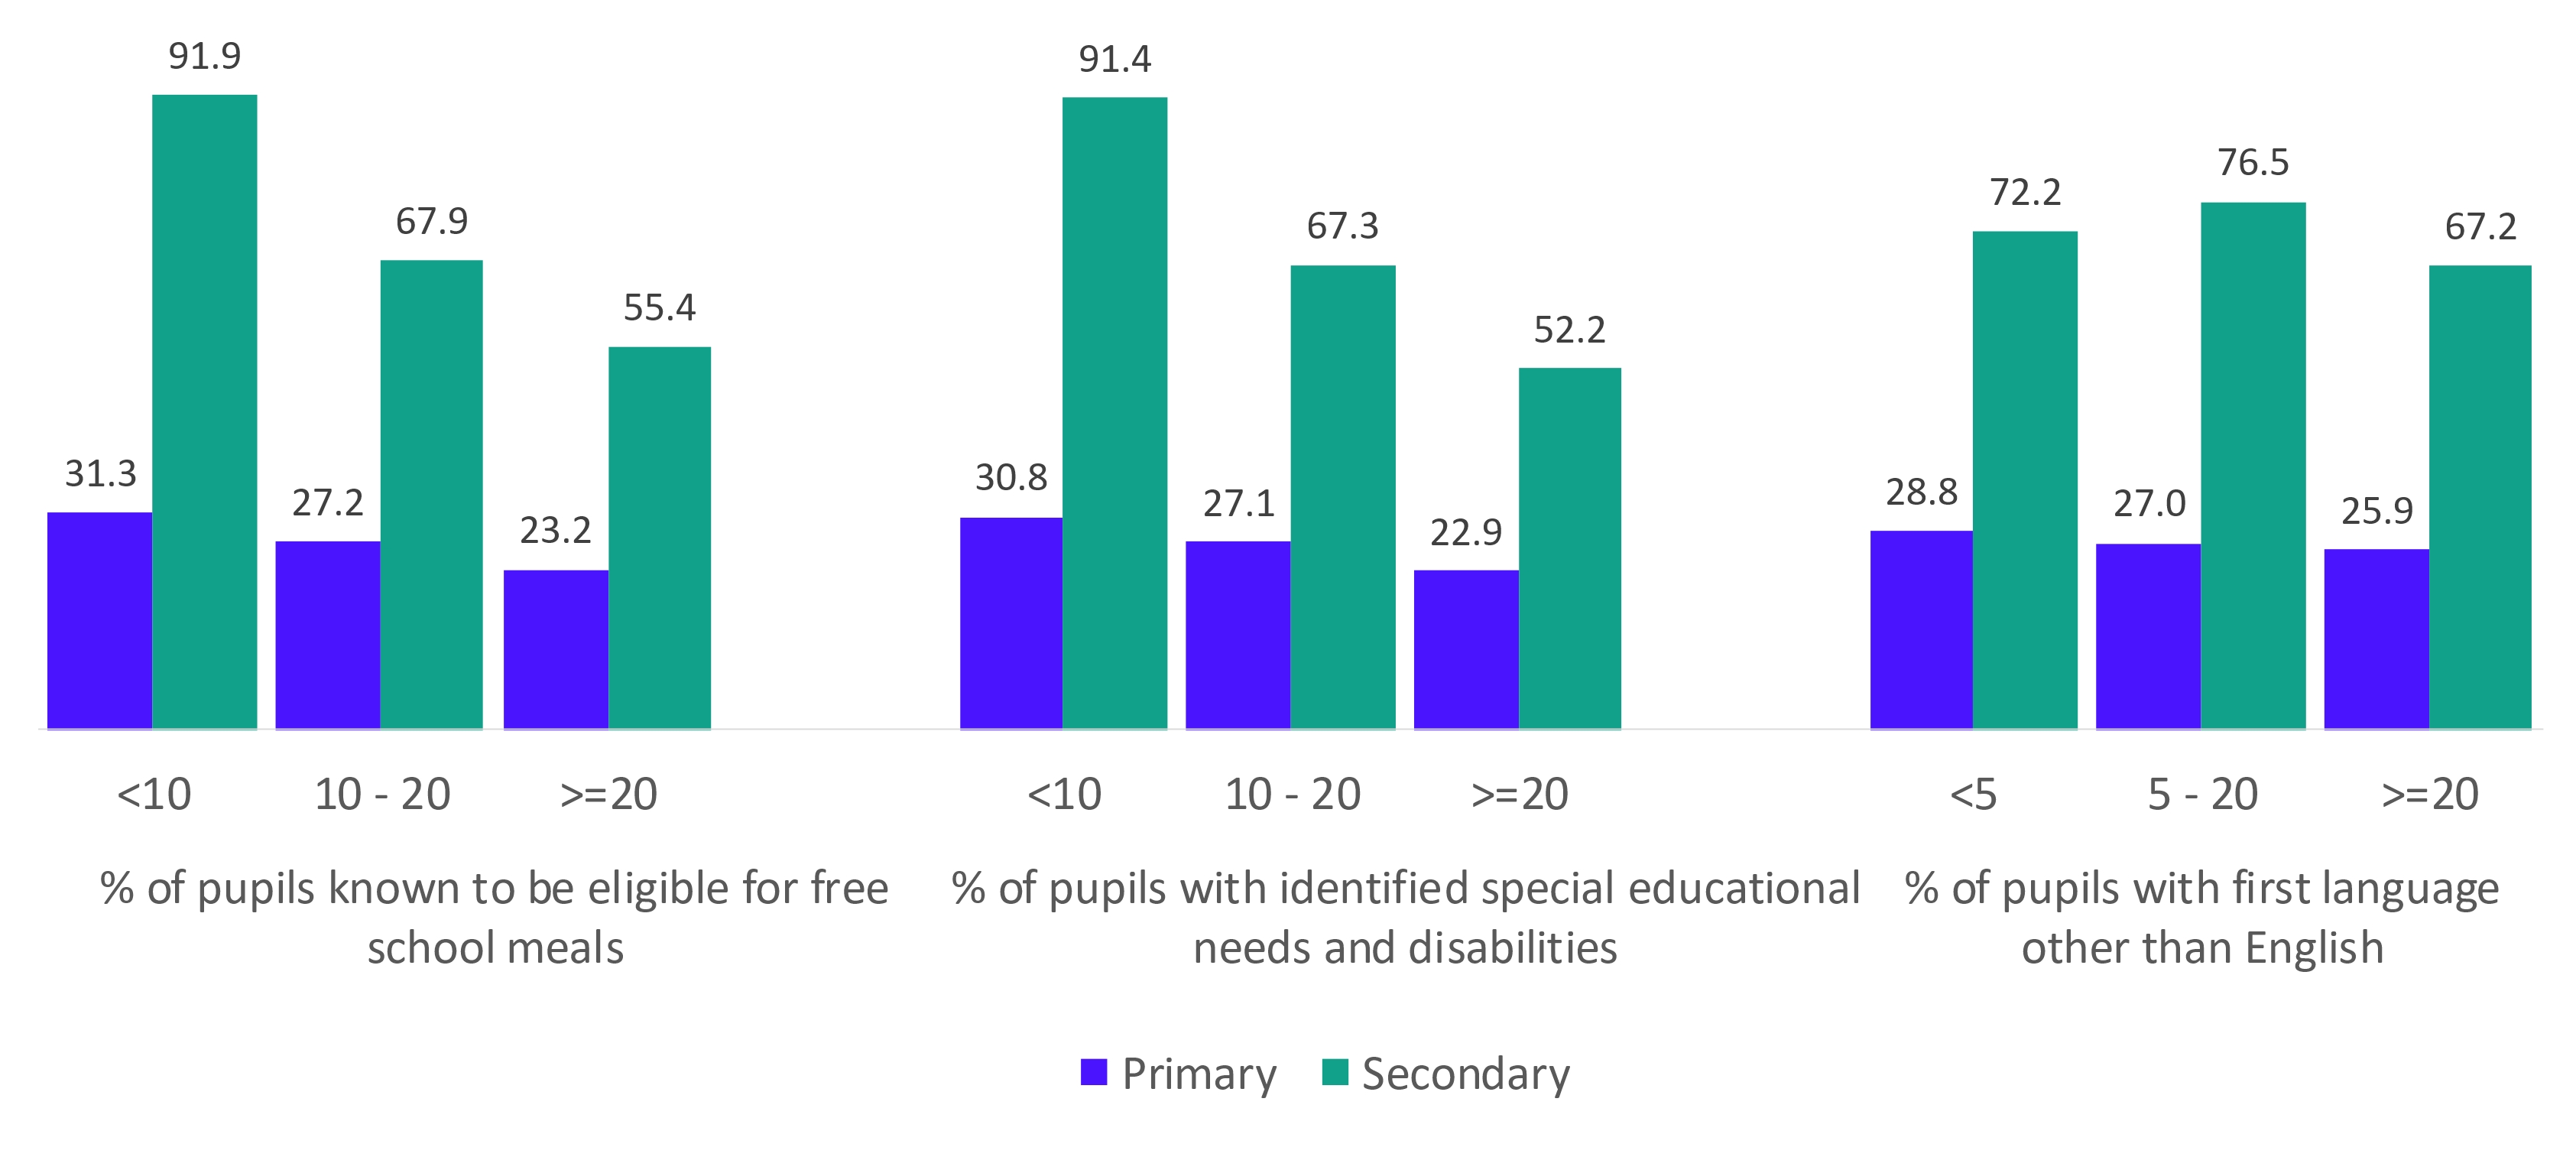
We can also see very clear differences in the number of teaching assistants when we split the analysis by school characteristics. Figure 4 shows the PTAR by levels of disadvantage in the school (percentage eligible for free school meals), the prevalence of special educational needs and disabilities (SEND), and the percentage of pupils for whom English is an additional language (EAL).
Schools operating in areas of high disadvantage have, on average, much lower PTARs than other schools. In primary schools with high FSM eligibility there are on average 23 pupils to every teaching assistant compared with 31 pupils to every teaching assistant in primary schools with low FSM eligibility. The equivalent figures for secondary schools are 55 and 92.
There is a similar pattern when we look at SEND where, as we might expect, higher prevalence is associated with smaller pupil to TA ratios. In some cases, an education, health and care plan (for those with the most acute needs) may stipulate the level of teaching assistant support that a child must receive.
The relationship is less clear when we look at EAL, particularly in secondary schools. This may in part reflect the diverse range of circumstances that make up the EAL group with wide ranges in English proficiency (for example, recent arrivals to England are grouped together with those who have been in England’s state-funded system for all of their schooling).[5]
Figure 4: number of pupils per teaching assistant (PTAR) by school characteristics
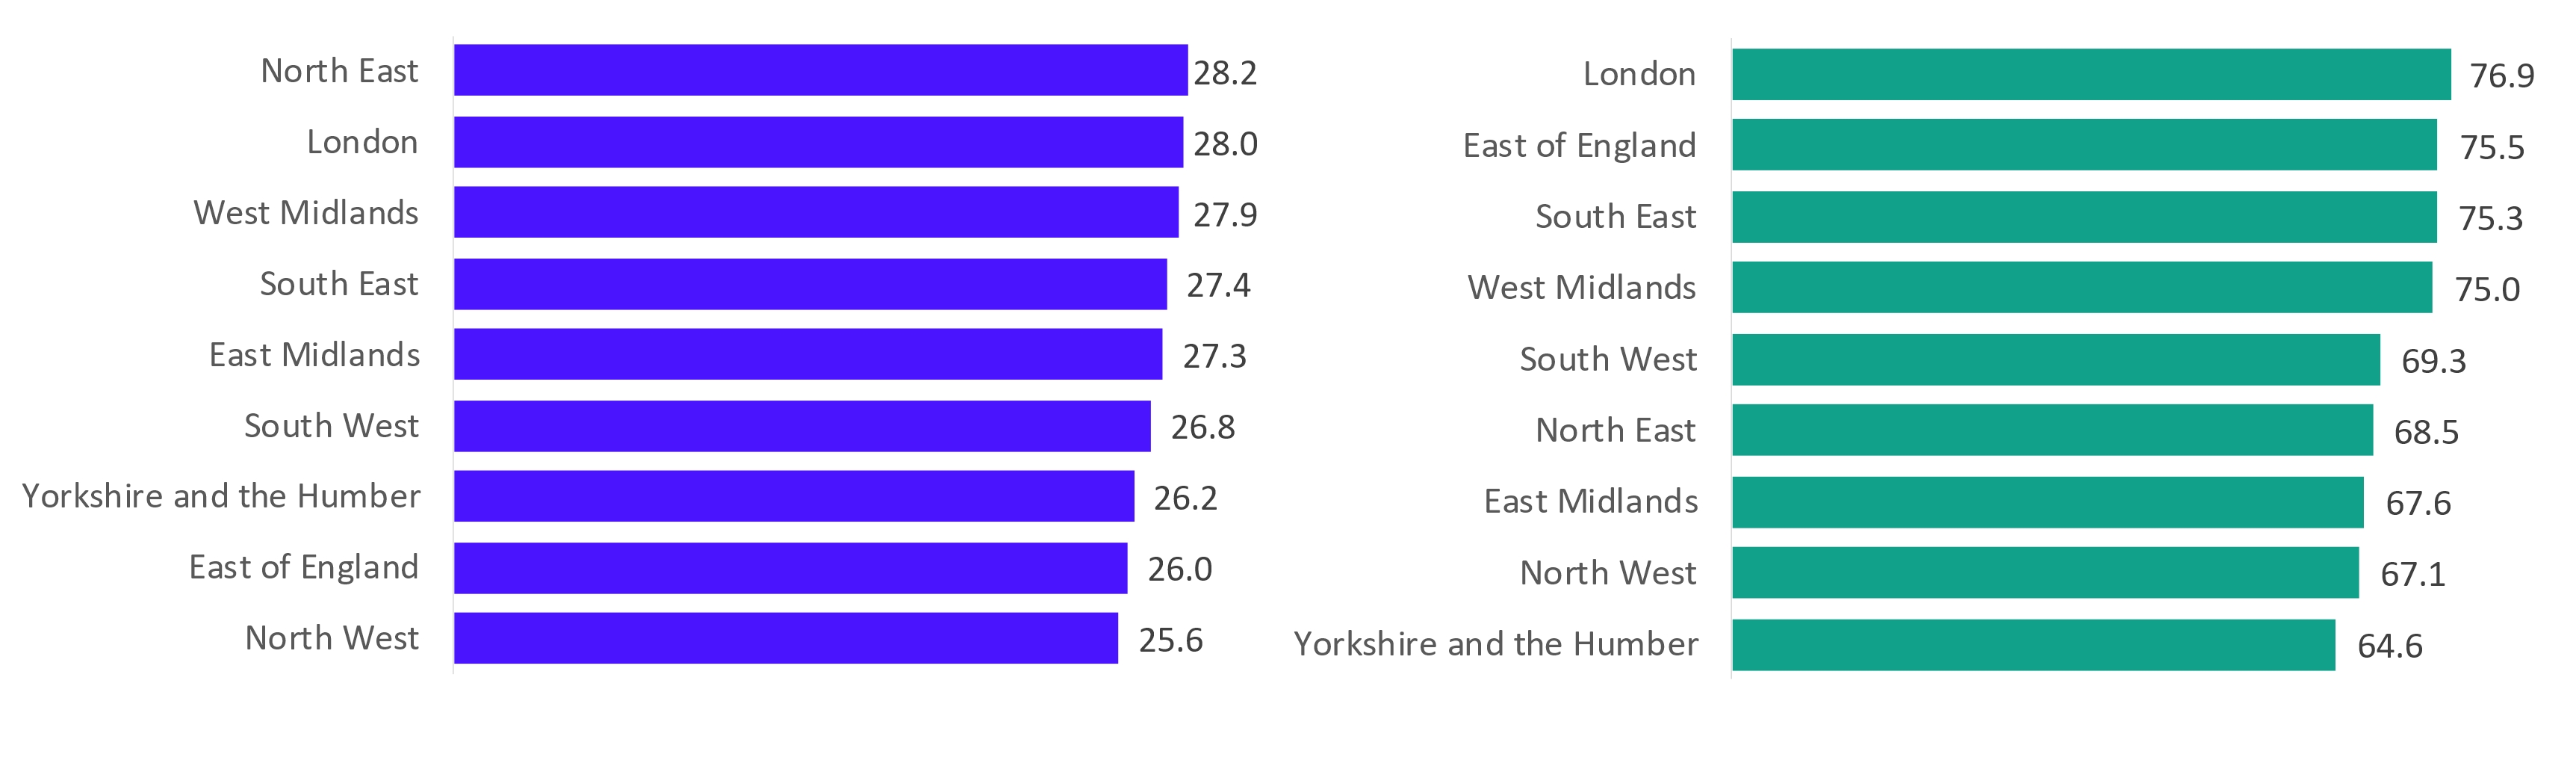
A further reason may be that this is reflecting regional disparities in the number of teaching assistants. Figure 5 breaks down the PTAR by region and shows that London has above average ratios, in fact it has the highest of all regions at secondary and the second highest at primary. London also has high levels of EAL, with the vast majority of its schools having more than 20 per cent of pupils with English as an additional language. In fact, London schools make up about 4 in 10 of the high EAL group but only 1 in 9 schools overall.
Figure 5: number of pupils per teaching assistant (PTAR) by region and phase
So school characteristics play an important role in the extent, and likely way, to which teaching assistants are deployed. While school characteristics also play a role in the pupil / teacher ratio (PTR) – for example, schools with higher levels of disadvantage tend to have lower ratios – the effects are more pronounced in the case of teaching assistants.
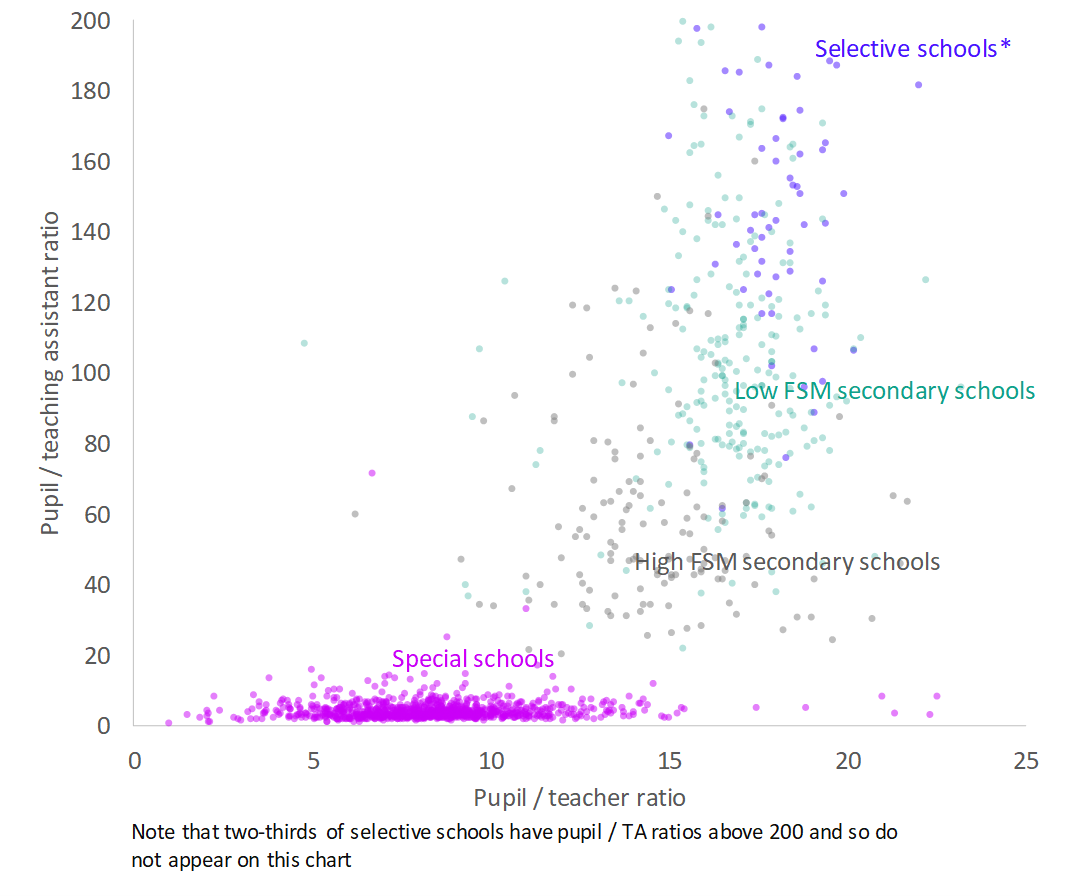
In Figure 6 we illustrate the relationship between the PTR and the PTAR, in four groups of schools. We find that on average:
- special schools have very low PTRs (5.8) and very low PTARs (3.1);
- secondary schools with very high levels of free school meal eligibility have low PTRs (14.5) and low PTARs (51.8);[6]
- secondary schools with very low levels of free school meal eligibility have high PTRs (16.8) and high PTARs (95.7). This means that their PTR is 15 per cent higher than schools with very high free school meal eligibility, but their PTAR is 85 per cent higher; and
- selective schools have the highest PTR (18.0) and by far the highest PTAR (221.2) of all the school groups examined. This means that their PTR is 24 per cent higher than schools with very high free school meal eligibility, but their PTAR is over four times that of such schools.
Figure 6: relationship between pupil teaching assistant ratio and pupil teacher ratio in secondary schools by school characteristics – individual secondary schools plotted
Expenditure on education support staff
The financial data collected from schools does not isolate expenditure on teaching assistants, it covers a range of education support staff.[7] However, given the relative prevalence of teaching assistants we use it as a proxy for spend on teaching assistants within the context of comparing expenditure between schools and over time.
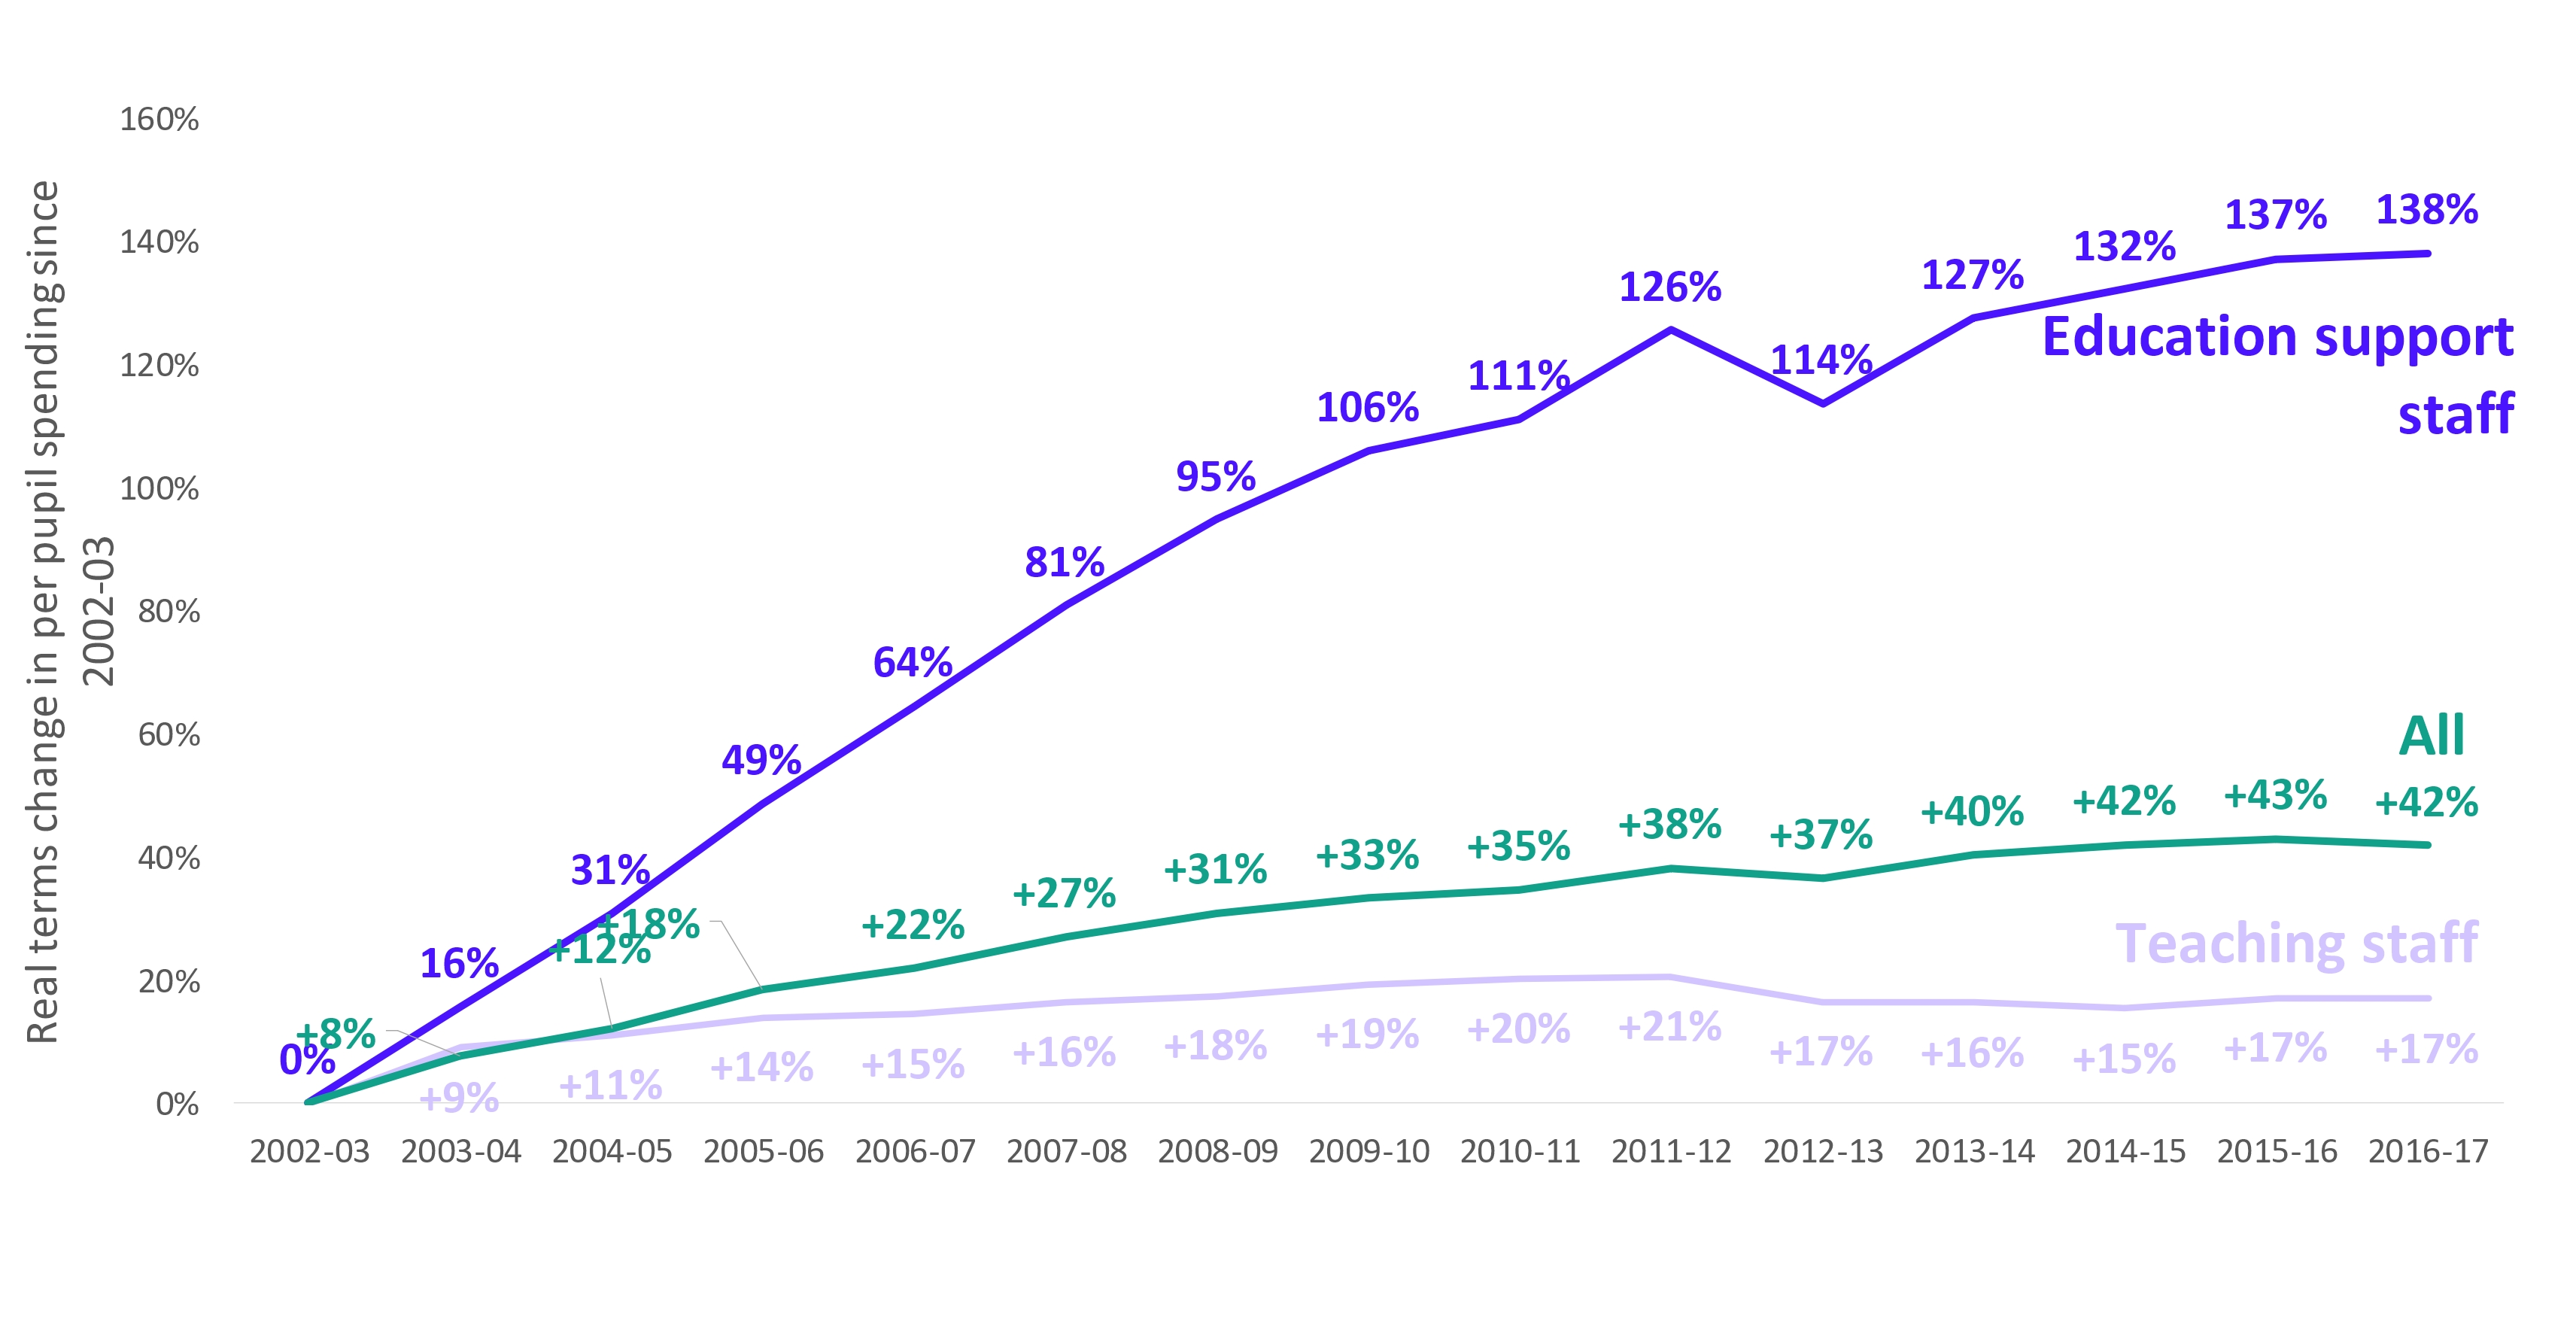
Given the rapid rise in the number of teaching assistants, it is not surprising that expenditure on education support staff has also increased rapidly. Between 2002-03 and 2016-17 (the period for which he have expenditure data) per pupil expenditure on education support staff increased by 138 per cent in real terms (Figure 7). This rate of increase is more than three times the increase across all areas of expenditure and eight times the increase on teaching staff. In 2002-03, 9p of every pound spent in schools went towards education support staff, by 2016-17 that had risen to 15p of every pound.
Figure 7: Change in per pupil spend on education support staff, teaching staff, and across all expenditure from 2002-03 to 2016-17 [8]
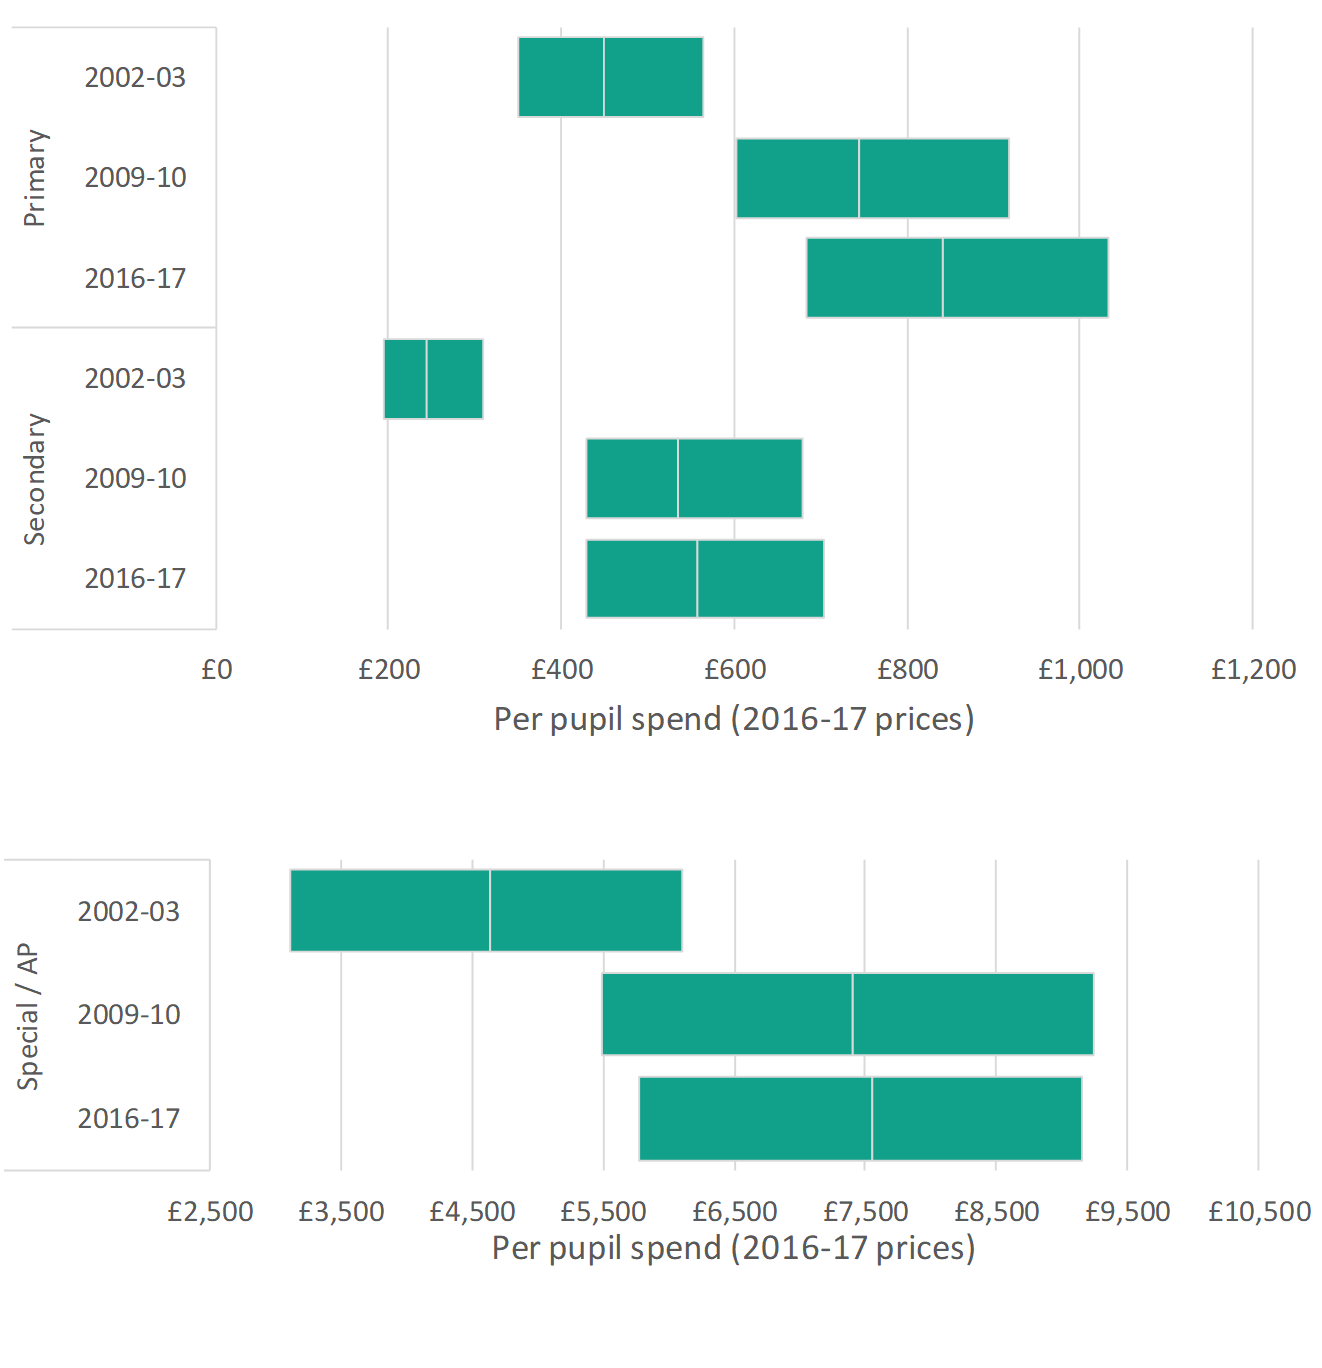
Given the low PTAR ratios, it is not surprising to find that special schools have by far the highest per pupil spend on education support staff. In 2016-17 the median expenditure amongst our sample of special schools was around £7,550, compared with £840 in primary schools and £560 in secondary schools.[9] In Figure 8 we show the distribution of per pupil expenditure by school phase in 2016-17. We have also illustrated how these distributions have changed since 2002-03 though this comes with a strong caveat, the dataset available for 2002-03 was largely missing values for total expenditure on education support staff (the data had been suppressed). We have therefore had to impute estimates for the majority of schools in 2002-03 based on the number of education support staff, the values should therefore be treated as illustrative rather than precise estimates.
Figure 8: per pupil expenditure (lower quartile, median, upper quartile) on education support staff 2002-03 to 2016-17)
Note again the wide range of values and how the differences between the highest and lowest spenders are more significant than for expenditure on teachers. Expenditure in the highest spending primary schools (upper quartile) on education support staff was 51 per cent higher than amongst the lowest spending (lower quartile). Amongst secondary schools the difference was 64 per cent. The comparable figures for expenditure on teaching staff were 19 per cent for primary schools and 15 per cent of secondary schools.
And again, as expected given the pattern of PTRs and PTARs, the differences by the characteristics of schools are more significant for expenditure on education support staff than they are for teaching staff. Figures 9 and 10 show the median spend according to a range of characteristics.
The median per pupil expenditure on education support staff in primary schools with high levels of disadvantage spend was 45 per cent higher than in primary schools with low levels of disadvantage. Amongst secondary schools, the median per pupil expenditure was 47 per cent higher in schools with high levels of disadvantage than schools with low levels of disadvantage. When we examine expenditure on teaching staff in the same way the differences are just 9 per cent in primary schools and 8 per cent in secondary schools.
But there is an important additional dimension that we bring out in these charts. The vertical lines show the upper and lower quartiles of expenditure within group. As you might expect from the PTARs shown in Figure 6, even within each group of schools with ‘similar’ characteristics – though only similar on one dimension, e.g. FSM rate – we see a considerable range of levels of expenditure.
Amongst primary schools with high levels of FSM eligibility (over 25 per cent of pupils eligible for free schools meals), schools at the top quartile of expenditure spent 45 per cent more than schools at the bottom quartile. Amongst secondary schools with high levels of FSM eligibility the difference was 69 per cent.
So, while these characteristics are associated with different levels of expenditure, the individual circumstances and potentially the individual spending decisions of schools, seem more important.
Going back to our group of secondary schools, overall, schools with high FSM rates had a median expenditure on education support staff that was 47 per cent higher than schools with low FSM rates, but the overlap between these two groups is significant. In fact:
- amongst the high FSM group, the lowest spending schools (bottom quartile) spent £540 per pupil in 2016-17;
- amongst the low FSM group, the highest spending schools (top quartile) spent £610 per pupil in 2016-17.
So, while schools with low levels of FSM eligibility generally spent the least, a significant proportion matched, and in many cases exceeded, the expenditure of schools with high levels of FSM eligibility (the group that spent the most).
Figure 9: median spend by characteristics – primary
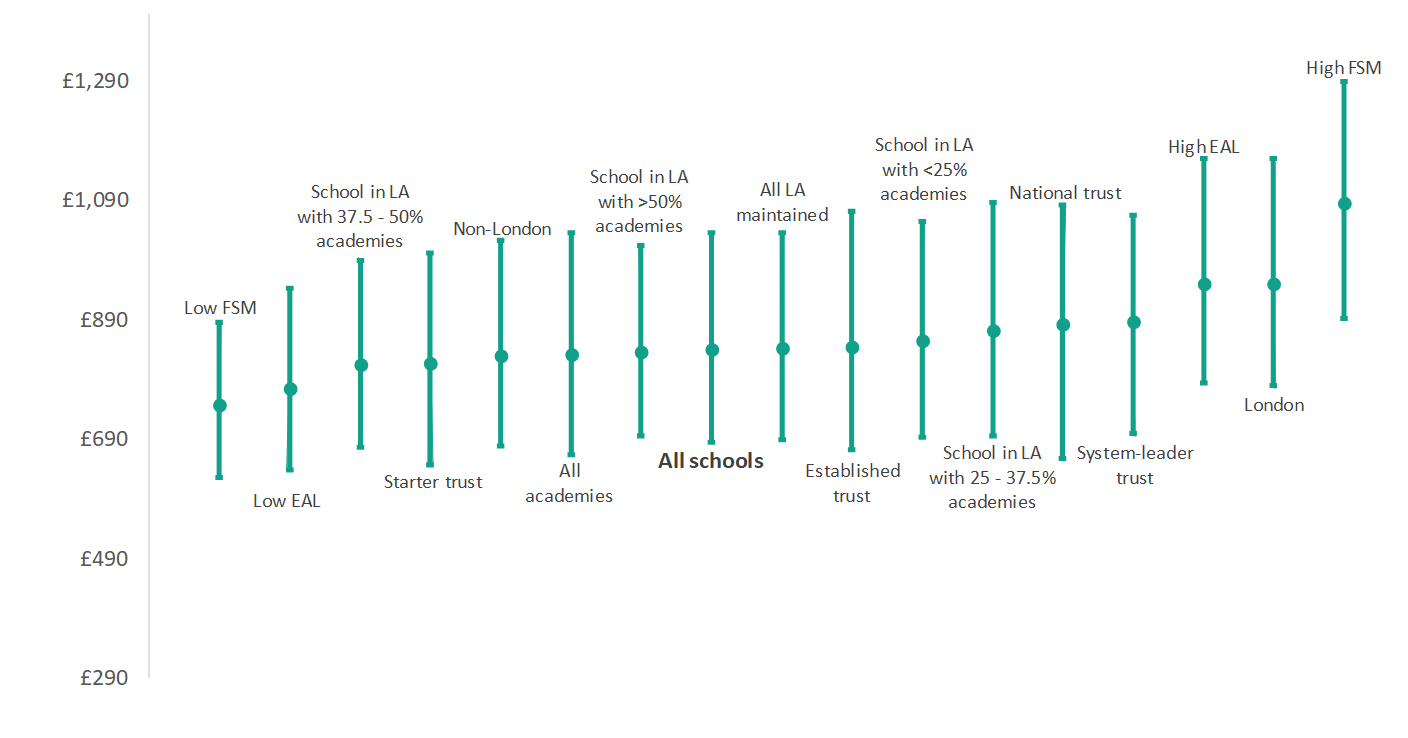
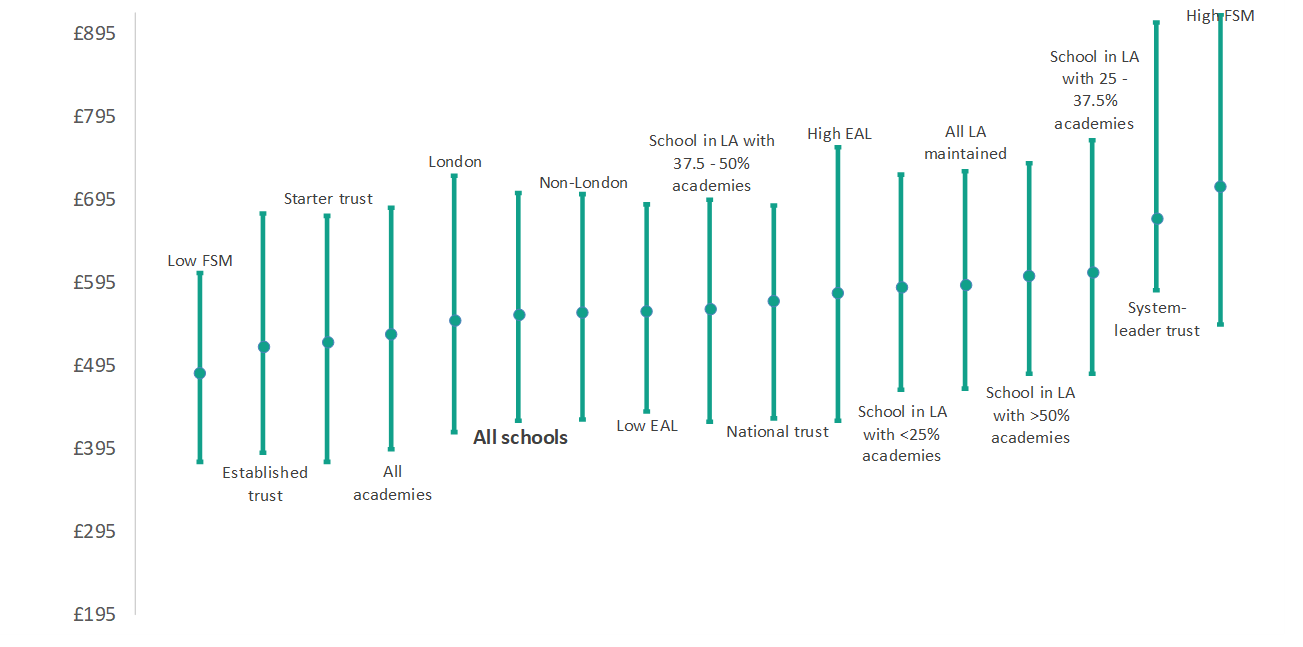
Figure 10: median spend by characteristics – secondary
We now compare how this spread of spend differs across our two largest sources of expenditure, teachers and education support staff. Given the very different rates of expenditure on these two categories, simply looking at the per pupil spend figures is not particularly meaningful.
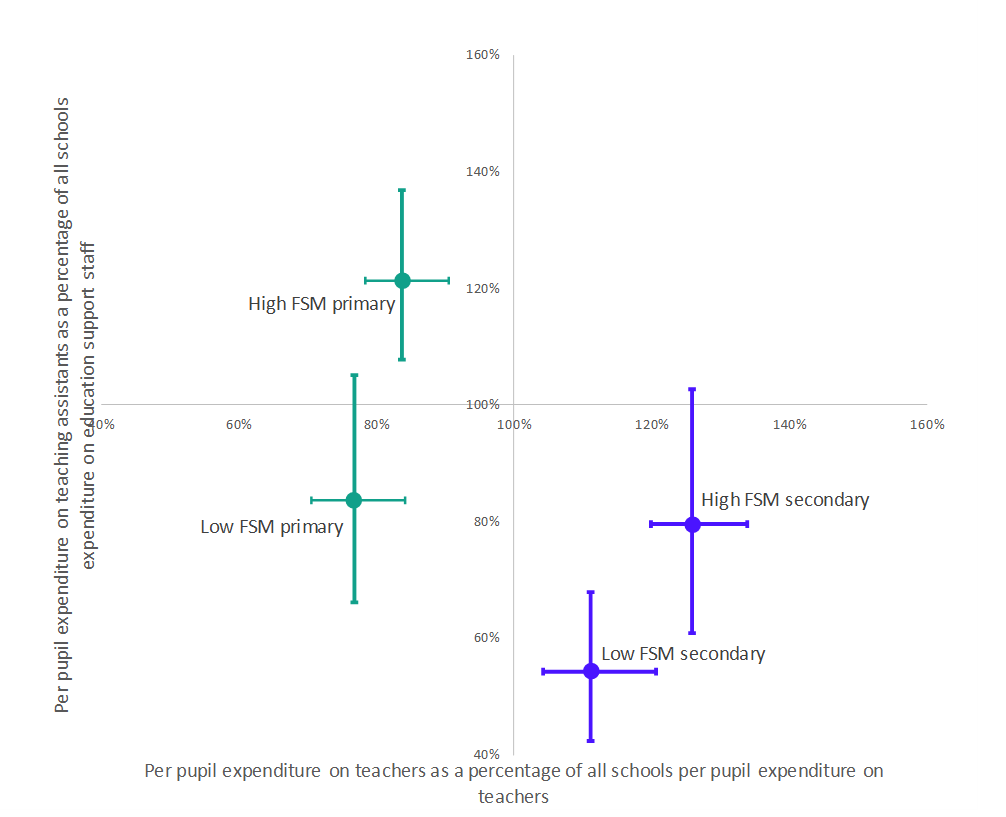
Instead, in Figure 11 we plot the expenditure of four different groups of schools relative to the national average per pupil expenditure on that category. So, a group plotted at 120 per cent along the horizontal axis has per pupil expenditure on teaching staff that is 20 per cent above the average for all schools. Similarly, a group plotted at 80 per cent along the vertical axis has per pupil expenditure on education support staff that is 20 per cent lower than the average for all schools.
Some of the results we have seen before:
- secondary schools tend to spend more than primary schools on teaching staff;
- primary schools tend to spend more than secondary schools on education support staff;
- high FSM schools spend more than low FSM schools on both teaching staff and education support staff.
But we can now also more directly compare the spread of levels of expenditure within each group. The vertical bars are generally much larger than the horizontal bars, so in all but low FSM secondary schools, there is much greater diversity in expenditure on education support staff than there is in expenditure on teaching staff.
Figure 11: median expenditure (and upper and lower quartiles) on teaching staff and education support staff, relative to averages across all schools
Finally, we present the results of a regression analysis which attempts to isolate the effects of individual characteristics – since there are significant overlaps with the factors being explored here, e.g. academies in system leader trusts tend to have higher levels of disadvantage than average.
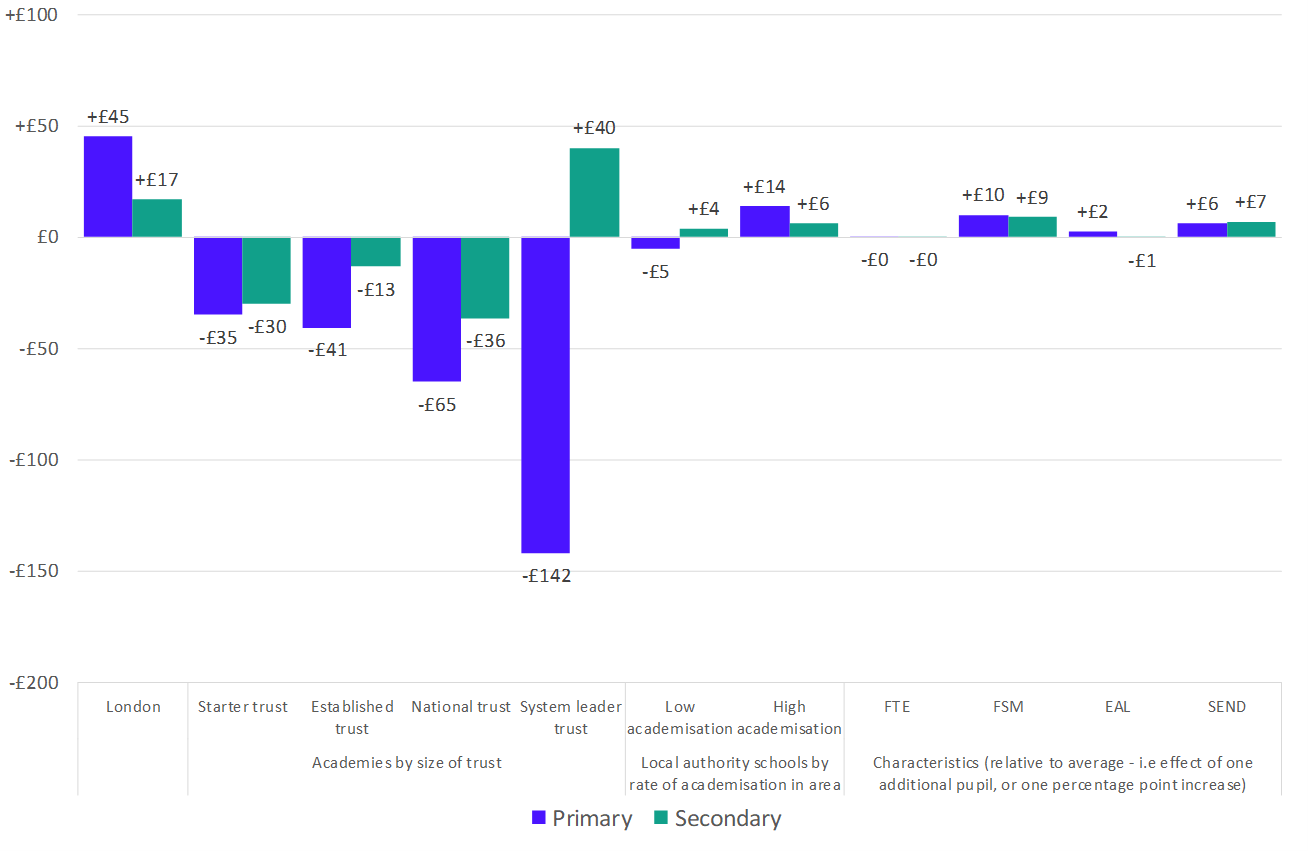
Figure 12 shows that, controlling for other factors, primary academies in larger academy trusts spend much less per pupil on education support staff than local authority maintained schools. The picture is less clear amongst secondary academies where schools in the largest academy trusts spend on average £40 more per pupil on education support staff after controlling for other factors. These results appear broadly consistent with those in Davies et al (2019) which rather than looking at the level of spend, explored expenditure on a range of categories as a proportion of total expenditure.[10]
Figure 12: regression of per pupil spend on education support staff by characteristics [11]
Conclusion
Teaching assistants are a significant feature of England’s school system, accounting for a quarter of the school workforce and, within the wider definition of education support staff, around 15 per cent of expenditure. Their prevalence has increased significantly, trebling in number since the turn of the century.
The evidence of their impact suggests that, deployed effectively, they can have a positive impact on pupil outcomes. However, when they are used to substitute rather than supplement a teacher the outcomes can be negative, particularly for pupils with low attainment or those with special educational needs.
This rapid rise in number, and mixed findings on impact, mean that some settings may view reducing teaching assistants as a way of achieving efficiency savings if faced with budget pressures. The analysis here shows that there is a wide spread of expenditure between schools on teaching assistants with the highest spending primary schools spending over 50 per cent more than the lowest spenders and the highest spending secondary schools spending over 60 per cent more than the lowest.
It also shows that the characteristics of a school – such as the level of disadvantage of its pupils, or the proportion with special educational needs – are also associated with expenditure on teaching assistants. So, it is almost certainly not the case that the highest spenders can bring their expenditure down to the same level, particularly in the case of expenditure being linked to a pupil’s requirements as identified on their EHCP. But this analysis shows that schools that at least in one sense have similar characteristics – e.g. serving disadvantaged communities – can still have a wide range of expenditure on education support staff and this spread is much wider than when we look at expenditure on teachers. What we cannot tell with this data is whether that level of expenditure is appropriate given the needs of pupils, how the education support staff are being deployed and hence their impact on pupil outcomes, and whether ultimately, the expenditure is an efficient use of resources.
[1] As well as teaching assistants and learning support assistants, the category of education support staff includes: childcare staff; examination invigilators and examination officers; foreign language assistants; librarians; nursery assistants; pianists; residential childcare officers at a residential special school; workshop, technology and science technicians; educational welfare officers; cover supervisors; staff employed to follow up attendance issues.
[2] Amy Skipp and Vicky Hopwood ‘Deployment of teaching assistants in schools’, June 2019 https://www.gov.uk/government/publications/the-deployment-of-teaching-assistants-in-schools
[3] EEF, ‘Teaching and learning toolkit: teaching assistants’, accessed February 2020 https://educationendowmentfoundation.org.uk/evidence-summaries/teaching-learning-toolkit/teaching-assistants/
[4] DfE, ‘School workforce in England, November 2010’ and ‘School workforce in England, November 2018’ https://www.gov.uk/government/collections/statistics-school-workforce
[5] Jo Hutchinson, ‘Educational outcomes of children with English as an additional language’, February 2018 https://epi.org.uk/publications-and-research/educational-outcomes-children-english-additional-language/
[6] In order to illustrate the differences we have taken a more extreme definition of high and low FSM in this chart. For this analysis, very low FSM means less than or equal to 5 per cent of pupils are eligible for free school meals and high FSM means at least 35 per cent of pupils are eligible for free school meals.
[7] As well as teaching assistants and learning support assistants it includes: childcare staff; examination invigilators and examination officers; foreign language assistants; librarians; nursery assistants; pianists; residential childcare officers at a residential special school; workshop, technology and science technicians; educational welfare officers; cover supervisors; staff employed to follow up attendance issues.
[8] DfE, ‘Trends in school spending 2002-03 to 2016-17’, August 2018 https://www.gov.uk/government/publications/trends-in-school-spending-2002-to-2016
[9] As with the earlier analysis in this series, expenditure by school characteristics is based on a school level dataset constructed from the schools Consistent Financial Reporting and Academies Accounts Return, looking at expenditure in 2002-03, 2009-10 and 2016-17. Because of the incompleteness of these datasets It has only been possible to do this for a subset of schools – just over half of all primary and secondary schools and about two-thirds of special schools. As such, the results are not directly comparable from the national level results and should be treated with caution, but we believe they reflect the broad underlying patterns.
[10] Peter Davies, Colin Diamond and Thomas Perry, ‘Implications of autonomy and networks for costs and inclusion: comparing patterns of school spending under different governance systems’, November 2019
[11] All values relative to a constant of £934 for primary schools, and £632 for secondary schools. Base case is a local authority school in an area where 25-50% of pupils are in academies. Average percentages per characteristics (primary / secondary): FSM 14.1% /1 2.9%; EAL 13.5%/12.4%; SEND 20.6%/16.2%