Summary
- The recently proposed teacher pay increases will create a pressure on the largest area of school spending – teacher costs account for around half of all spending.
- The number of teachers at state-funded schools in England has increased by 12 per cent since the turn of the century. But in recent years the number of teachers has been relatively flat while pupil numbers have been increasing due to a population bulge that started early in the new millennium.
- More generally, teacher numbers have not kept pace with changes in the pupil population causing rises and falls in the average pupil teacher ratio.
- Between 2010 and 2017, average teacher salaries fell by £2,900 (7 per cent) in primary schools, and £2,700 (6 per cent) in secondary schools.[1]
Introduction
Expenditure on teachers and education support staff accounts for around two-thirds of all school spending, and in a tenth of schools it accounts for over three-quarters. The government has also signalled its intention to significantly increase teacher salaries, particularly for new entrant teachers.
Understanding the teaching workforce is central to any serious consideration of school efficiency and financial pressures. The Department for Education (DfE) has long argued that there are significant efficiency savings to be made from improved staff deployment, arguing in 2016 that savings of £1.7bn could be realised (for example through curriculum based financial planning).
In this post we consider the long-term trends in teacher and pupil numbers ahead of subsequent posts that will explore expenditure.
Analysis
The number of full-time equivalent teachers in state-funded schools in England has risen by 12 per cent over the last two decades, from 402,000 at the turn of the century to 450,000 today.[2],[3] In the 2018/19 academic year just over 49 per cent were in primary schools, 45 per cent were in secondary schools, and the remaining 5 per cent were in special schools, pupil referral units and alternative provision. [4] Figure 1 shows the trend in teacher numbers since 2005 (the earliest point for which we have a year-by-year time series.)
Figure 1: The number of teachers (FTE) by year and phase of education
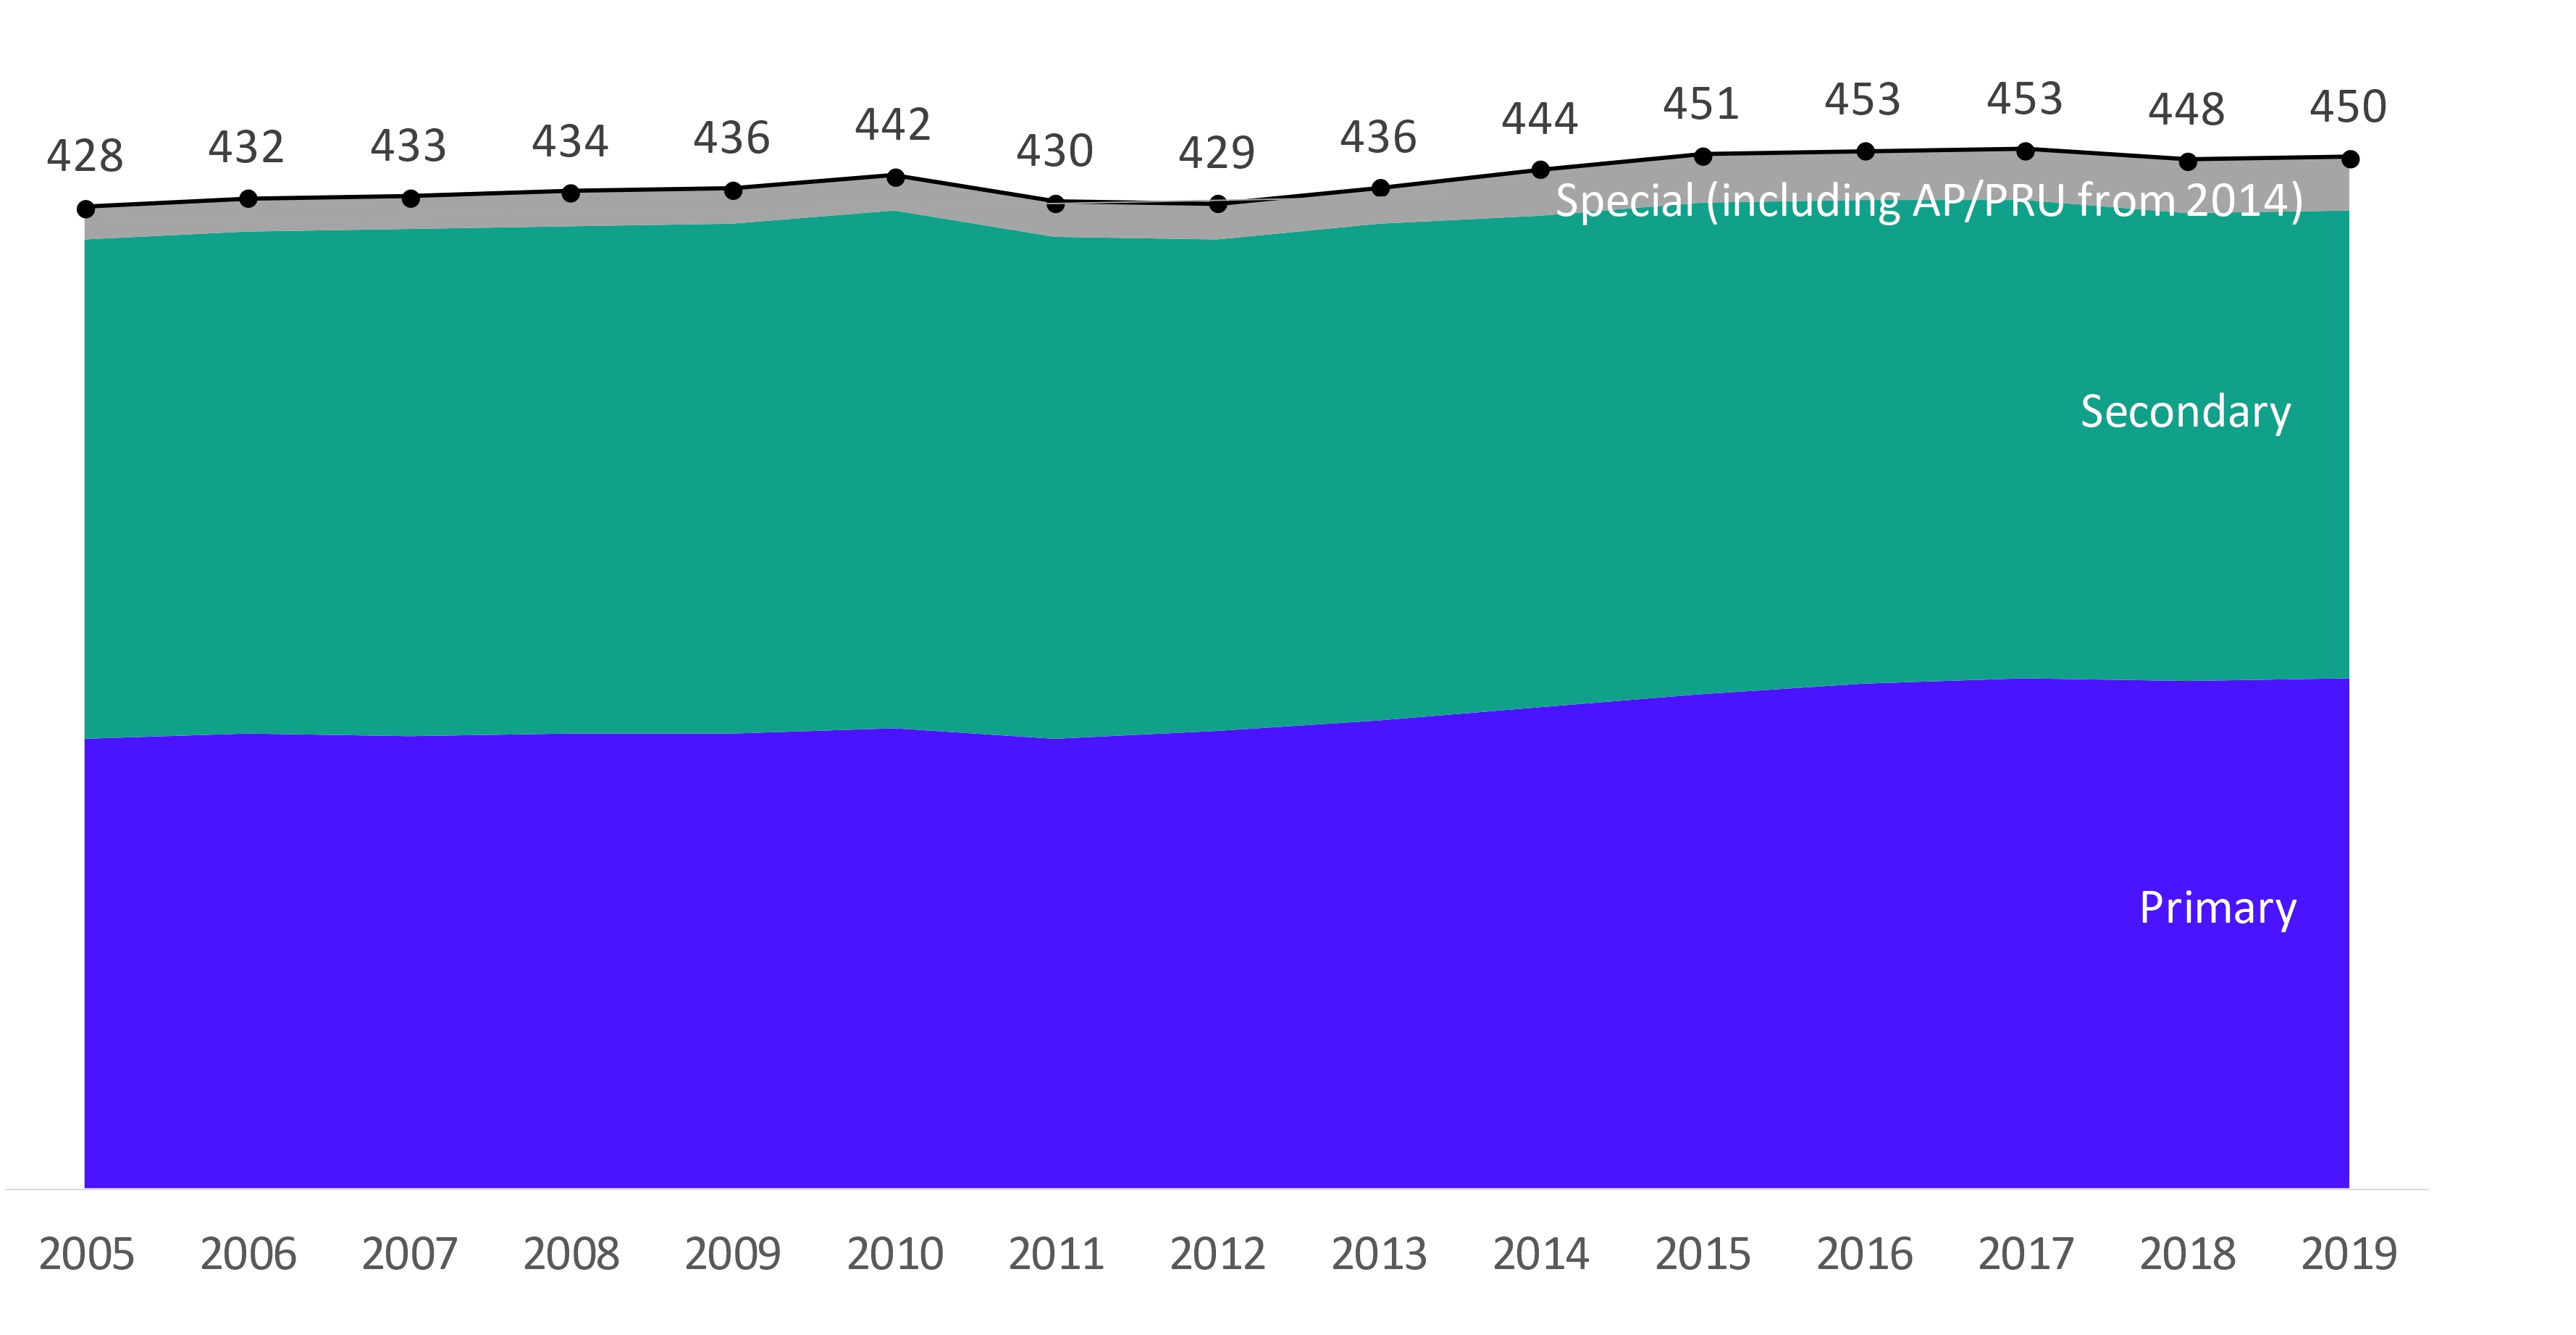
We can see that while the long-term story is one of growth in numbers, that growth was largely completed by 2015. Over the last four years teacher numbers have been relatively flat, fluctuating between 448,000 and 453,000.
This recent trend is in contrast to the trend in the number of pupils in schools, raising concerns over teacher recruitment and retention. Over the last five years, pupil numbers have grown by 7 per cent, from 7.6 million in 2014 to 8.1 million in 2019, driven by a population bulge that began early in the new millennium. This has been felt in primary schools and is now starting to move through secondary schools. When its effects are fully played out, it will be the equivalent of a whole additional year group being in the school system.
Yet before this population bulge hit schools, pupil numbers were actually in decline. Between 2000 and 2009 – the lowest point in the period – pupil numbers fell by over 200,000 (equivalent to around 3 per cent of the pupil population).
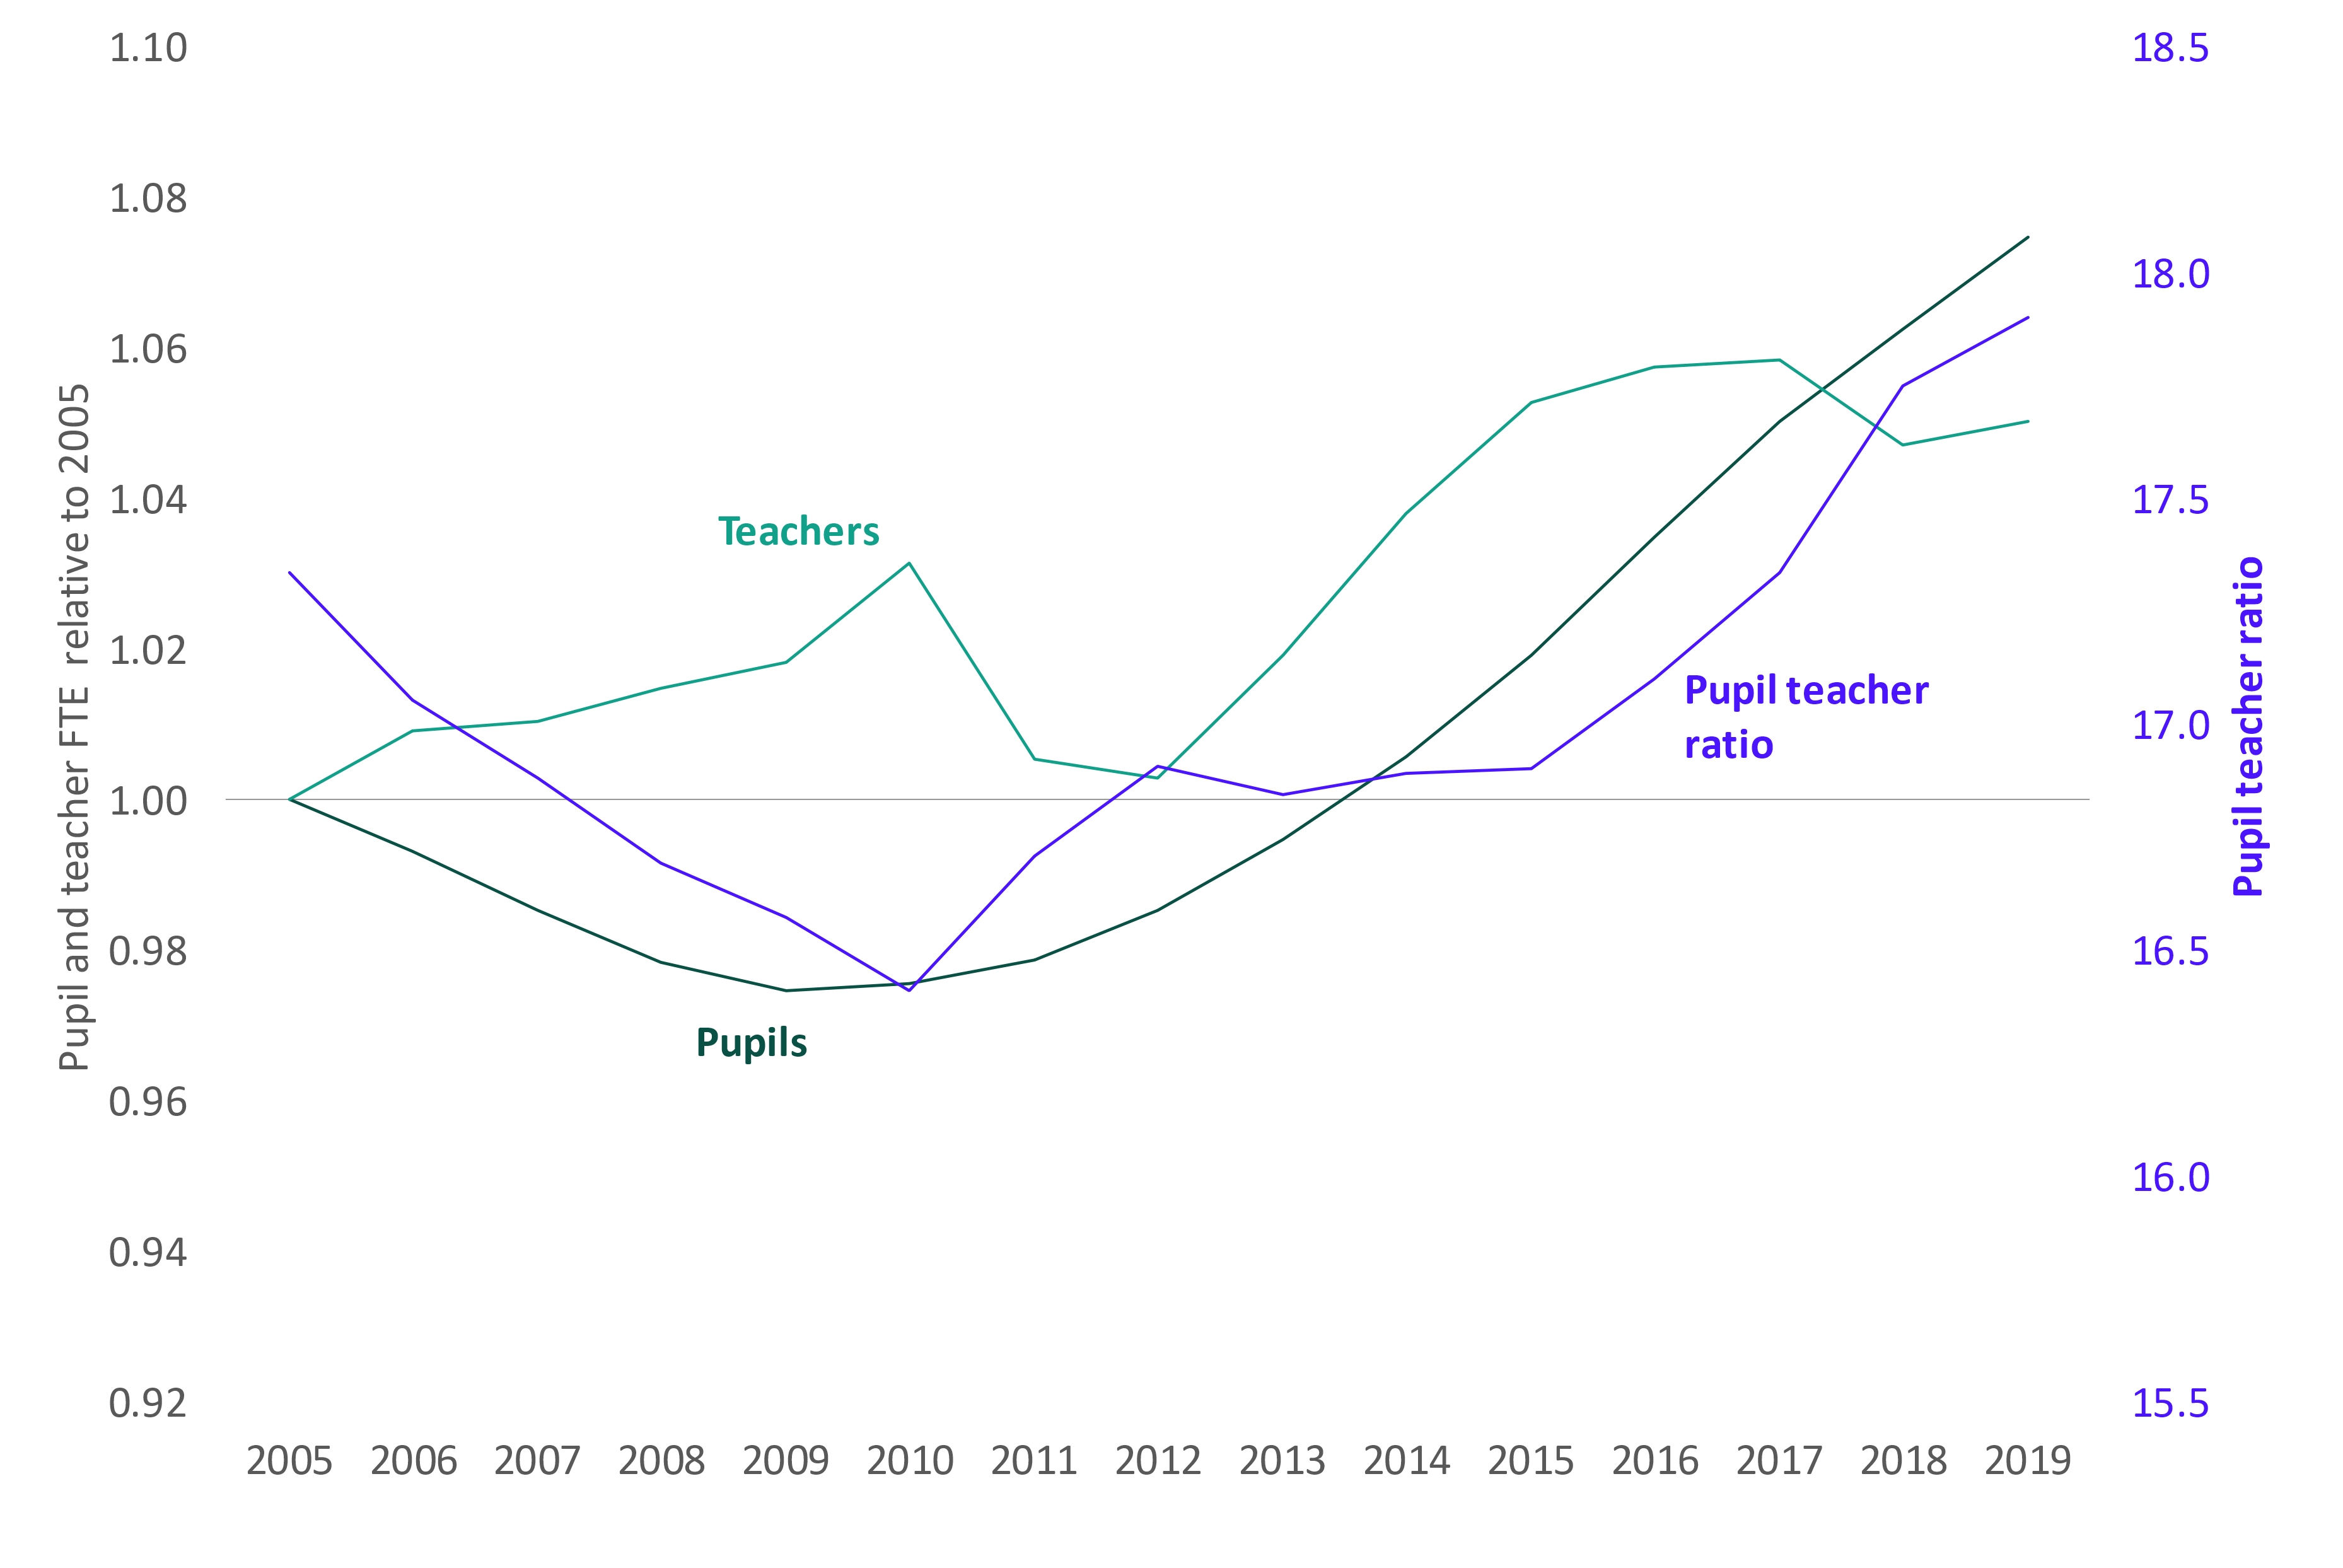
Figure 2 highlights the complexity of these longer-term trends. It shows the number of teachers and pupils relative to the position in 2005 (this is part way through both the initial decline in pupil numbers and increase in teacher numbers but is the earliest point at which we have a consistent time series) and the overall pupil / teacher ratio (PTR). In summary:
- teacher numbers first grew, at a time in which pupil numbers were falling, leading to a decline in the overall PTR (from 17.3 in 2005, to a low of 16.4 in 2010);
- teacher numbers actually fell for a short while at a point where pupil numbers were starting to increase, but although the PTR increased, it was still below its starting point and teacher numbers quickly started increasing again;
- by 2017, pupil and teacher numbers had reached parity in terms of their growth since 2005 meaning that the PTR ratio was back where it had started at 17.3; and
- in the last two years pupil numbers have continued to increase while teacher numbers have been broadly flat, meaning that the PTR has continued to increase, reaching 17.9 in 2019.
Figure 2: Change in the number of teachers and pupils, and the pupil / teacher ratio, since 2005
The way that this may have affected different phases of education is an additional complexity. The PTR in primary schools is generally higher than in secondary schools – on average, around 21 in primary schools and 16 in secondary schools – because secondary schools often have smaller classes for GCSE subjects and also more non-contact time. The PTR is higher still in special schools. Given that pupil numbers were initially rising more rapidly in primary than in secondary schools, part of the pattern of the increase in PTR may have been compositional – i.e. if a greater proportion of the school system was primary based then we would expect an increase in the PTR even if every single school had exactly the same PTR as before.
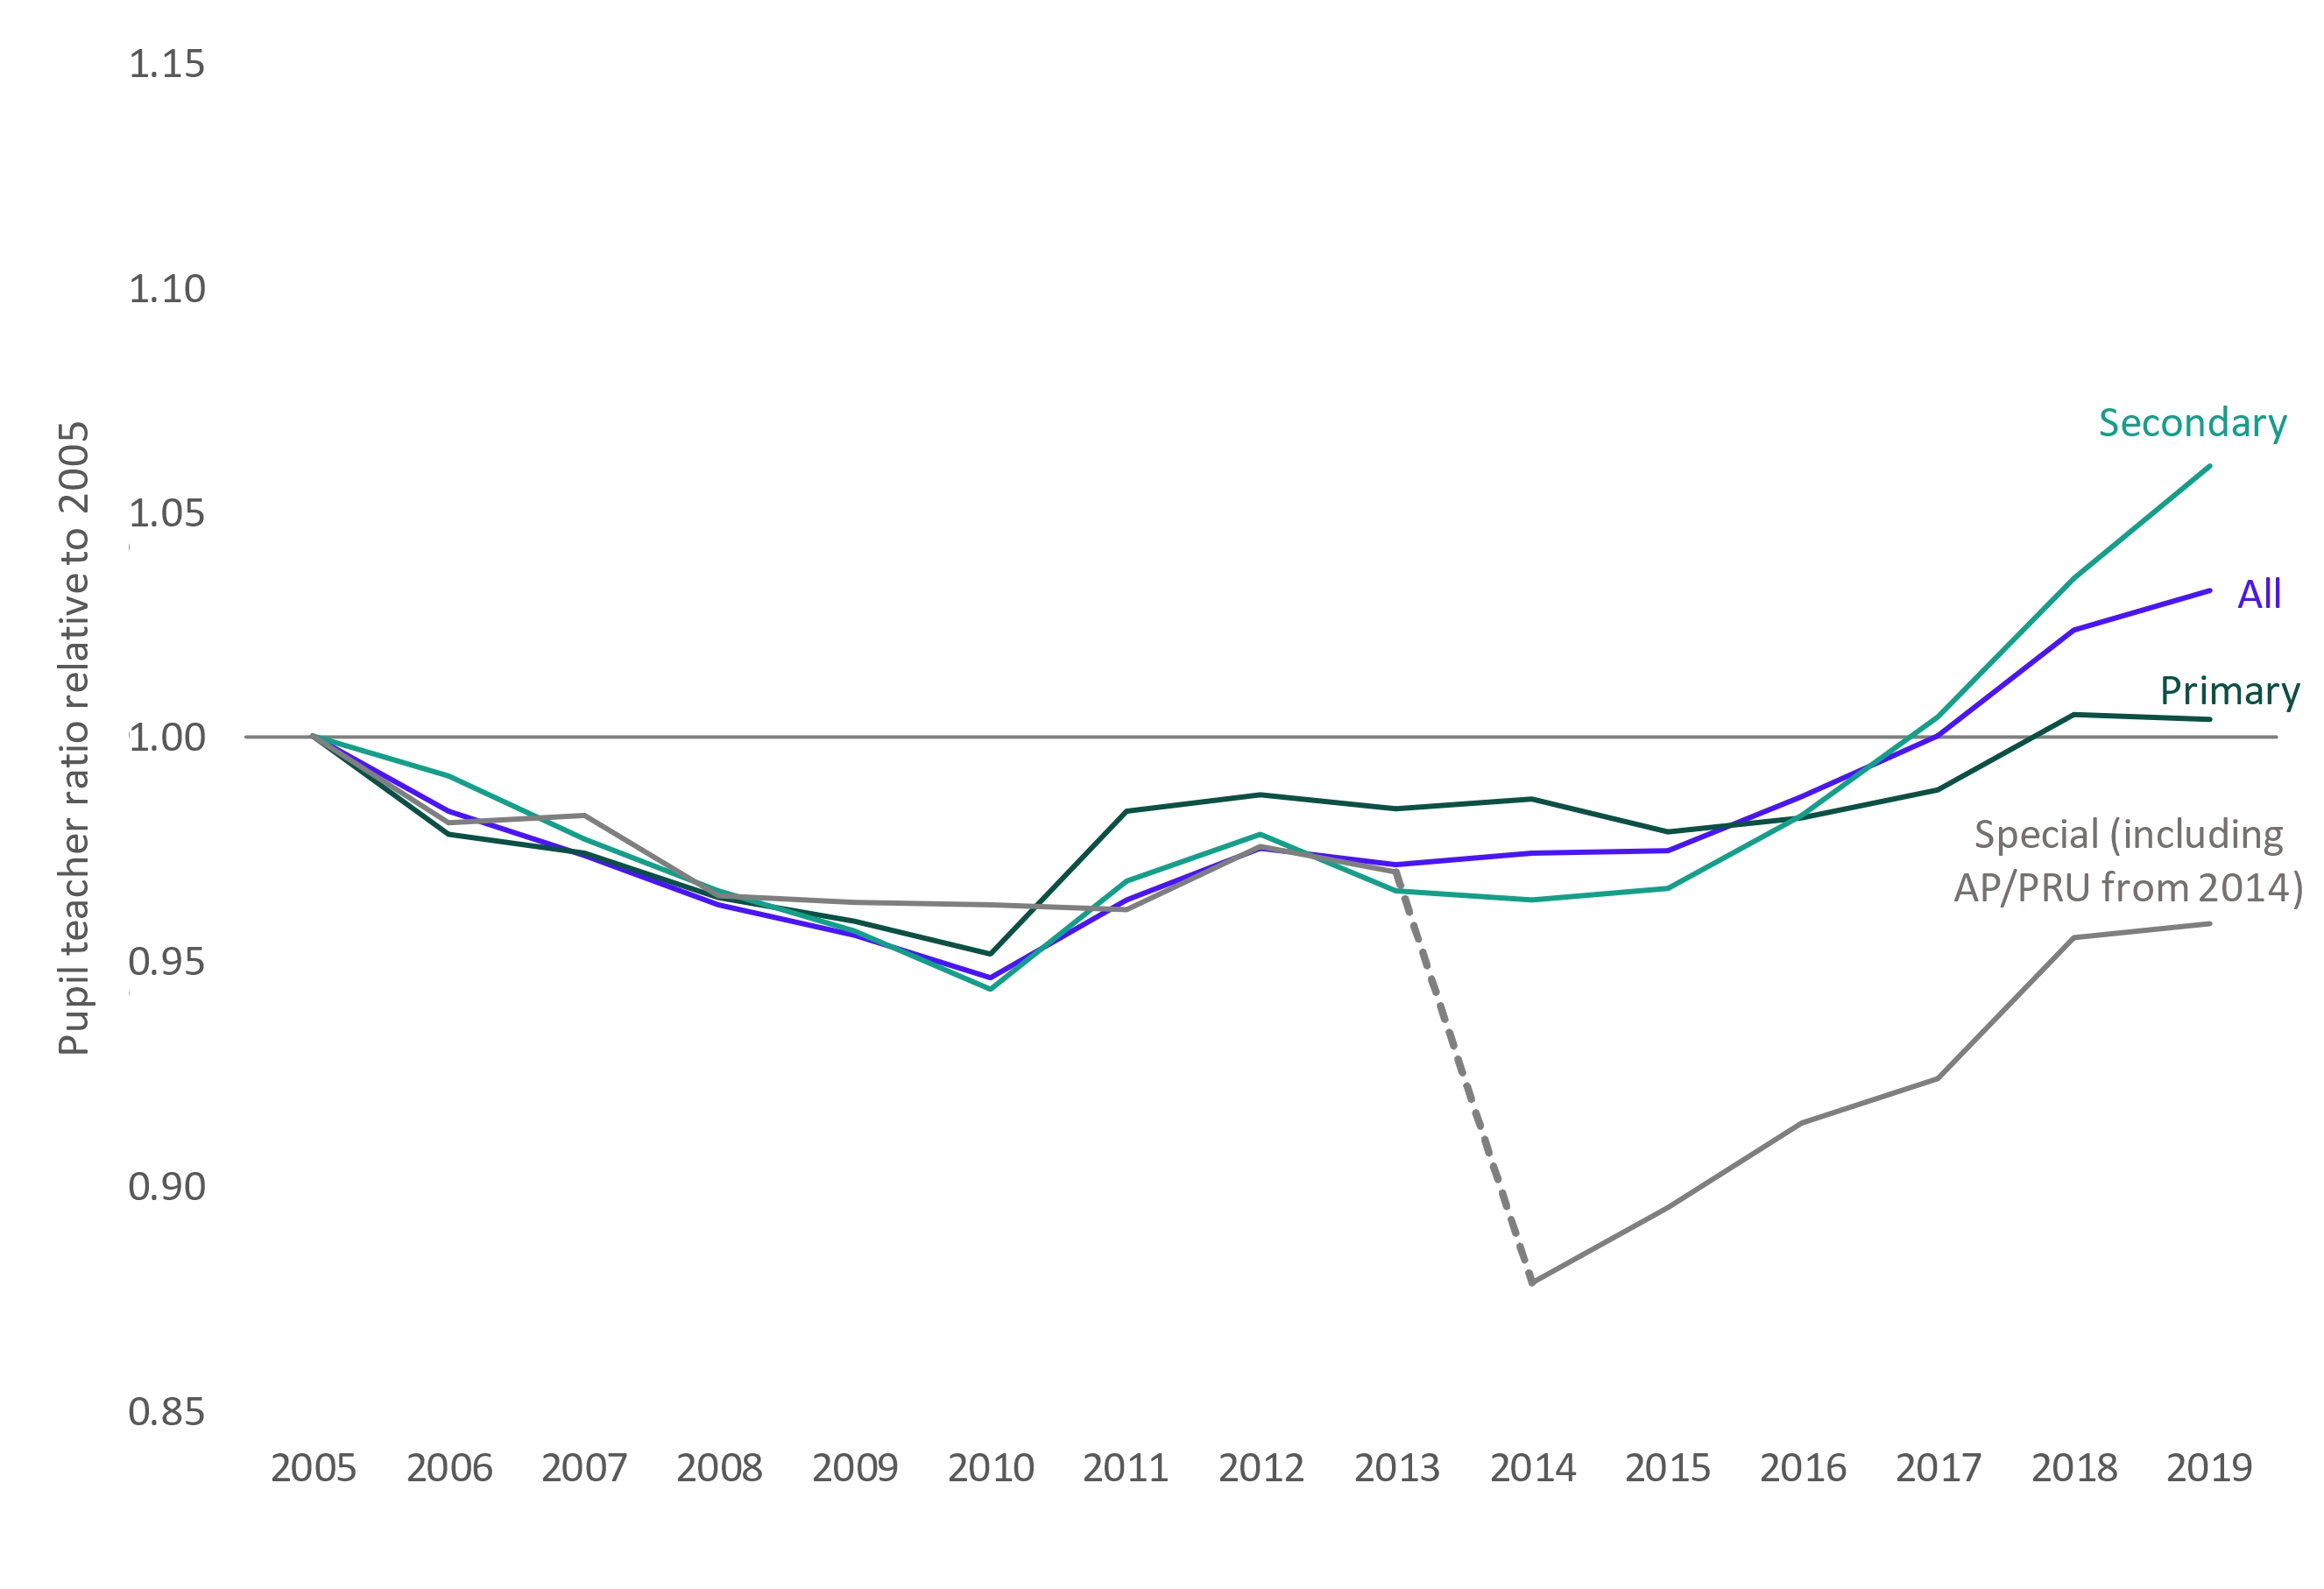
However, until the most recent years, primary and secondary schools have actually been following a similar trend. Figure 3 shows the PTR in each phase relative to the position in 2005. For most of that period the PTR has been lower than in 2005. As we saw above, across all schools the key point was 2017 when the PTR returned to the same level as in 2005. Since then, it has continued to increase in secondary schools while in primary it appears to have flattened. It is difficult to interpret the series for special schools and alternative provision (including pupil referral units). This is because the published statistics on teacher numbers appear to be inconsistent in their coverage.[5]
Figure 3: Change in the pupil/teacher ratio between 2005 and 2019 by phase of school
So, over the period for which we have school expenditure data (2003 to 2017) the number of pupils declined and then increased rapidly, the number of teachers increased and then plateaued, and the PTR declined before rising steadily again particularly in secondary schools. The PTR is currently higher than in recent years, but not exceptional within an historical context, particularly in primary schools.
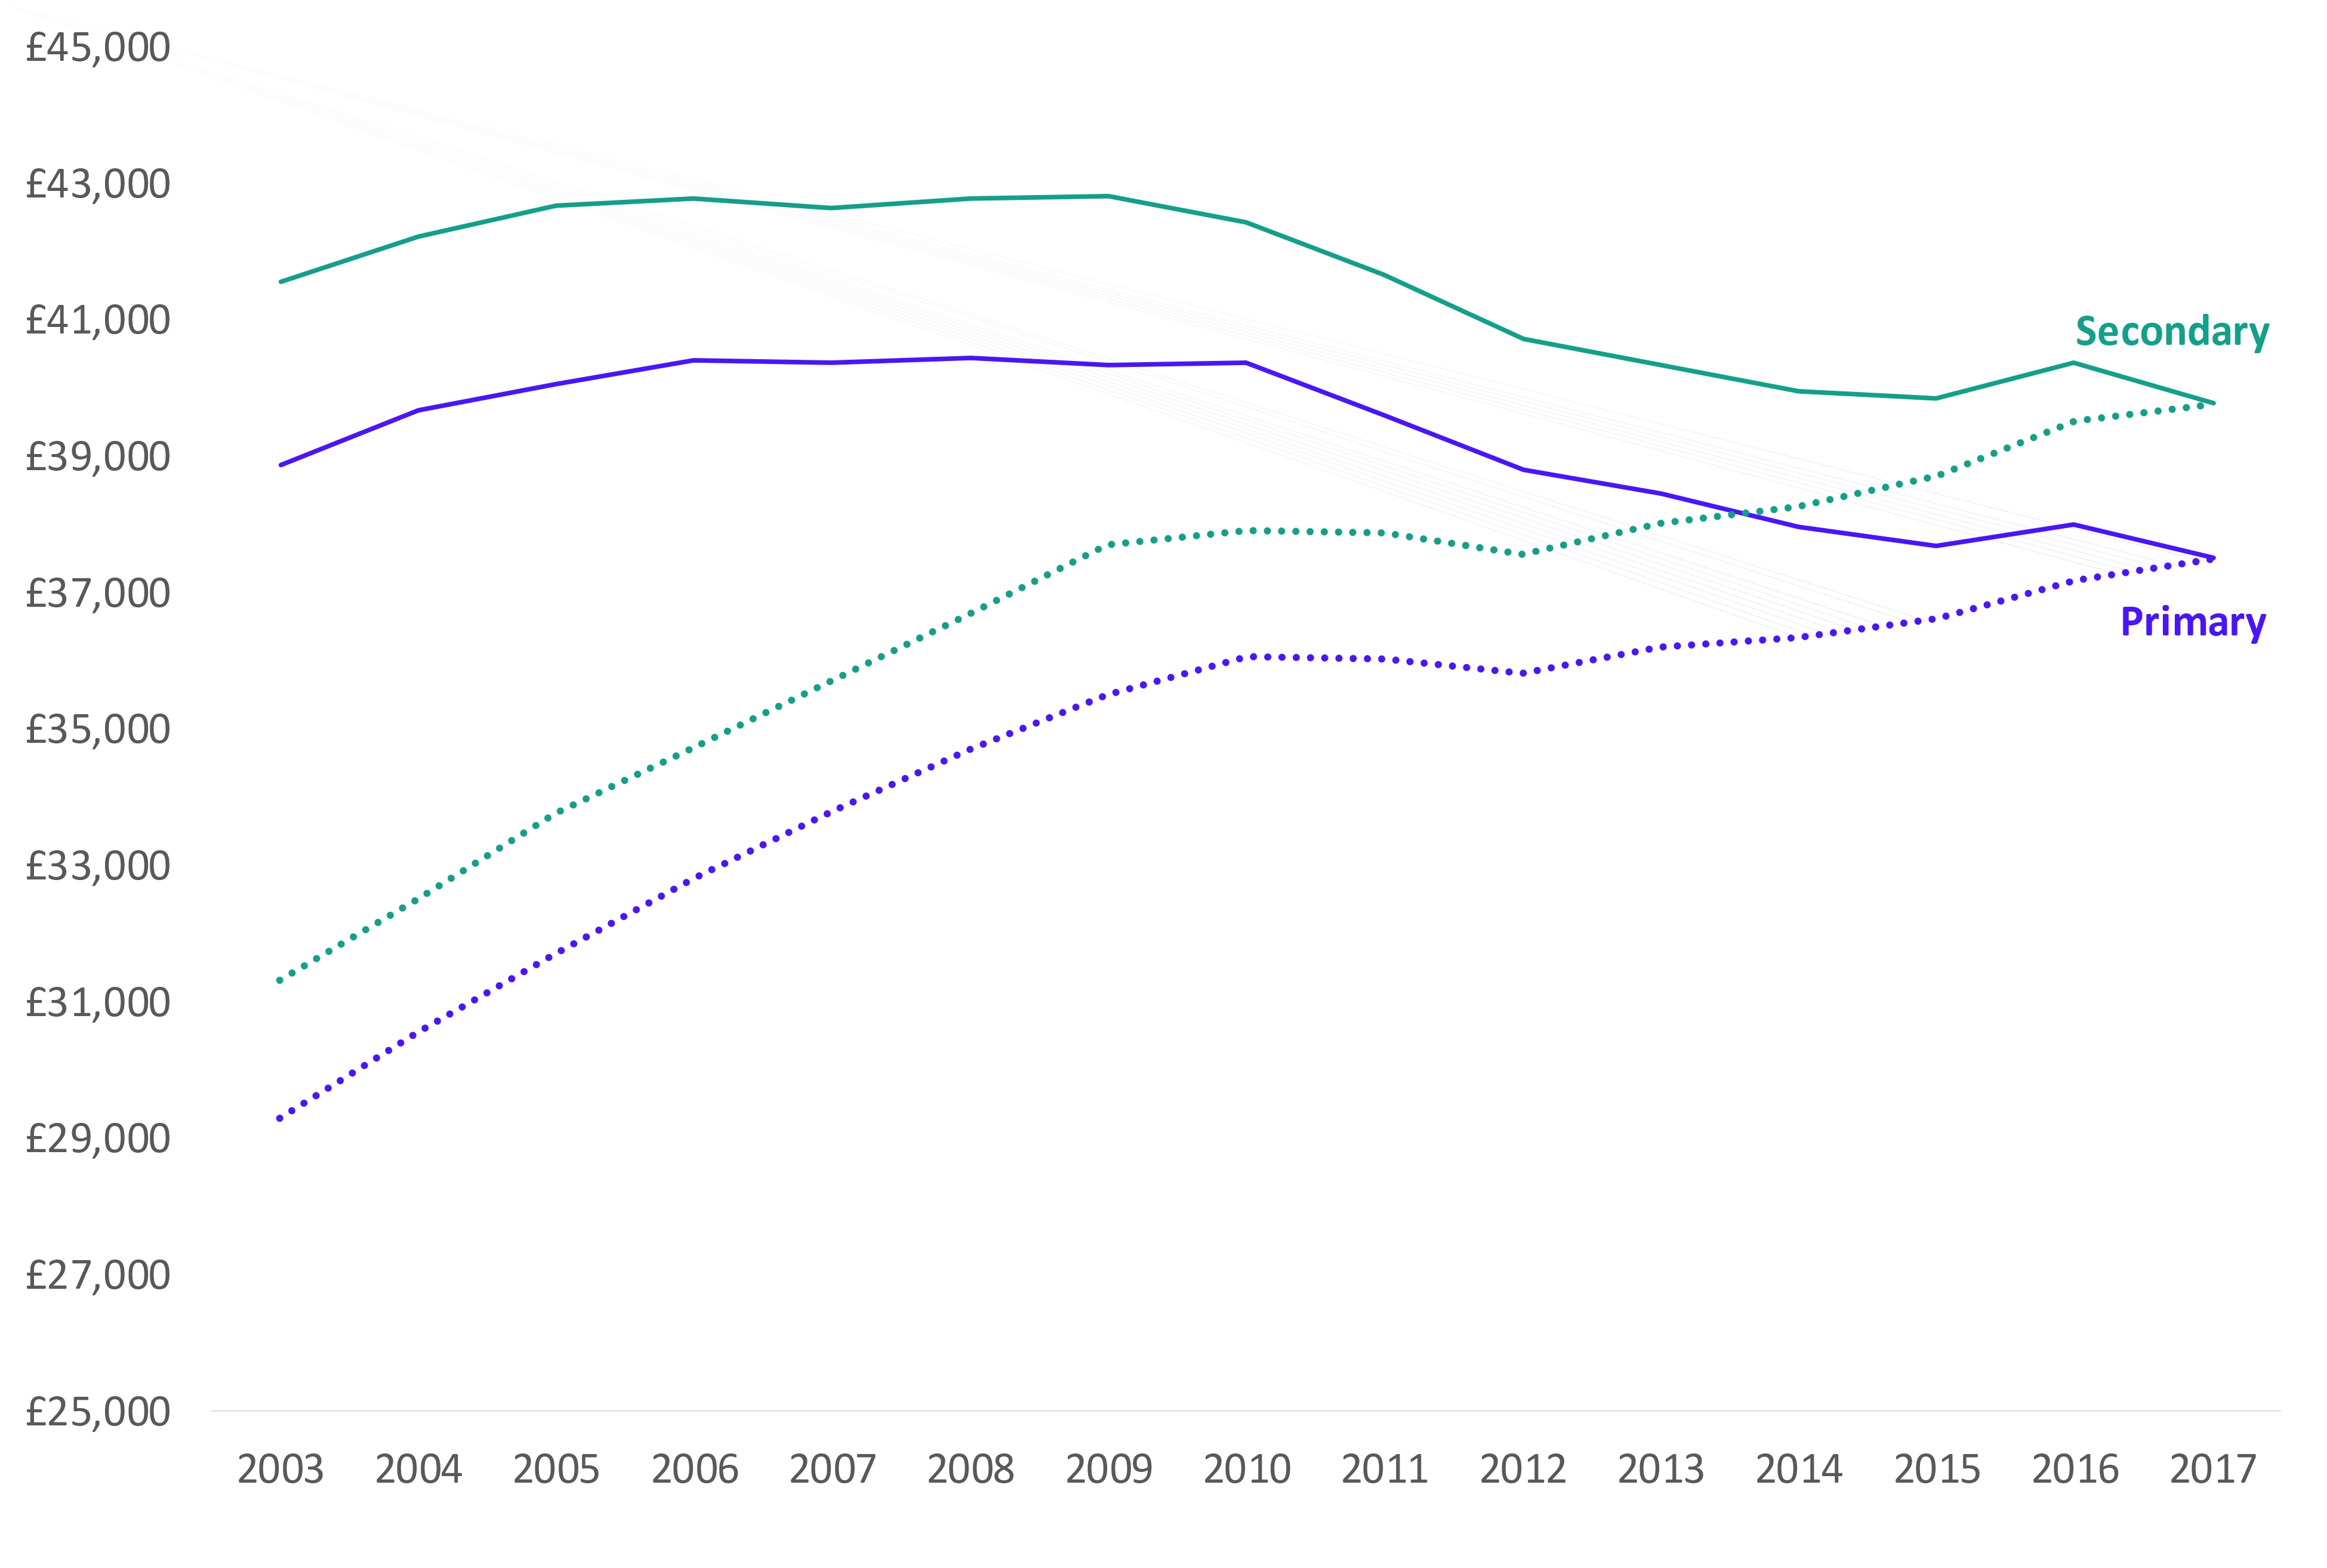
A final piece of context is the rate at which teachers are paid. Figure 4 shows the average salaries of primary and secondary school teachers between 2003 and 2017 in 2016-17 prices. Since 2010, during a period of public sector pay restraint with pay freezes and caps, average teacher salaries have been in decline with a real-terms fall of £2,900 (7 per cent) for primary school teachers and £2,700 (6 per cent) for secondary school teachers.
Figure 4: Average salary of primary and secondary school teachers in 2016-17 prices (solid lines) and cash terms (broken lines) [6]
This does not translate into a direct ‘efficiency saving’ for schools. While average salaries have been falling in real terms, schools have faced other salary related pressures on their budgets from increased employer contributions to pensions and National Insurance. So, it does not necessarily follow that the cost to schools of having a teaching post has fallen directly in line with falls in average salaries.
The staffing mix within a school (e.g. the proportion of teachers at different leadership levels) and the experience of teachers will also clearly affect the amount that schools spend on teachers. In our joint study with Ambition Institute in 2019 we found that: [7]
- Taken as a whole, there was no difference in the proportion of staffat different leadership levels in academies and local authority maintained schools.
- System leader trusts had a relatively high number of new entrants to the teaching workforce. One in four classroom teachers in secondary schools in system leader trusts were not in the state-funded system the year before; across all secondary schools, the figure was one in five.
- The proportion of teachers and middle leaders exiting the state-funded sector each year was higher in large academy trusts than elsewhere.
- Trusts have much higher rates of promotion from teacher to middle leadership, than other schools, particularly at primary. Across all state funded schools, around 1 in 10 classroom teachers achieves a promotion in any given year. In some trusts, this increases to as many as 1 in 3.
- Both classroom teachers and middle leaders tend to achieve promotion at a younger age in large academy trusts than they do elsewhere. Secondary school teachers in system-leader trusts were on average promoted to senior leadership at the age of 35, while those in local authorities are promoted on average at the age of 38.
Conclusion
Teacher costs represent the largest area of expenditure for schools. In recent years teacher numbers have not kept pace with increases in pupil numbers and pupil teacher ratios have been rising. At the same time, average teacher salaries have been falling. These are all important features of the system that need to be understood before considering trends in expenditure on teachers, especially when coupled with different approaches to workforce structures and progression that we have previously identified. In a later post we will consider how expenditure on teachers has changed over time and how this has varied by school characteristics.
[1] In 2016-17 prices.
[2] DfE, ‘School workforce in England, November 2017’, (June 2018)
[3] DfE, ‘School workforce in England, November 2018’, (June 2019)
[4] These figures exclude teachers centrally employed by local authorities of which there were around 3,900 in 2018/19.
[5] There is a large (approximately 30 per cent) increase in teacher numbers in the special schools group in the statistics relating to November 2013, it would appear that AP/PRU are included from this point.
[6] Paul Bolton, ‘House of Commons Library: Teacher pay statistics’, (December 2008)
DCSF, ‘School Workforce in England, January 2008’, (September 2008)
DCSF, ‘School Workforce in England, January 2009’, (September 2009)
DfE, ‘School Workforce in England, November 2018’, (June 2019)
[7] Vivien Niblett and Jon Andrews, ‘People power: six ways to develop and retain educators in multi-academy trusts’, (June 2019)