Last week saw the publication of the secondary school performance tables 2018. The tables provide key performance data for KS4 assessments for all secondary schools in England for the last academic year. Here we outline some of the key findings.
The national attainment gap
The disadvantage gap (measured using the DfE’s disadvantage gap index which is based on attainment in English and maths GCSEs) widened by 0.6 per cent in 2018 [1]. This is consistent with our Annual Report which found that progress on the gap is stalling and that, based on current trends, it would take well over 100 years for the disadvantage gap in English and maths to close. We have created a new interactive tool to demonstrate how the gap has changed over time in each local authority in England.
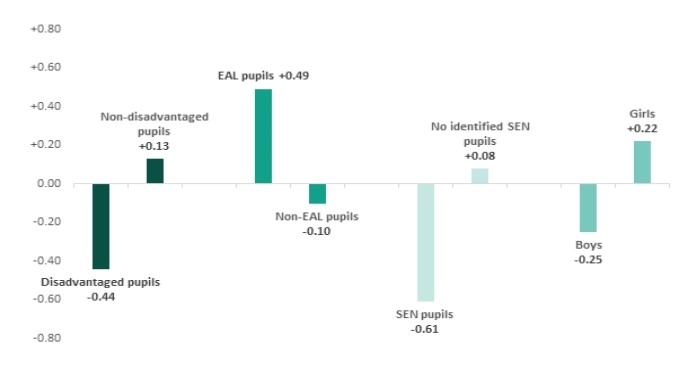
Last week’s release also shows that considerable gaps remain between progress made by other groups of pupils. The scores for the pupil group with English as an additional language (EAL) on Figure 1 should be interpreted with caution because, while average EAL progress scores are high, they obscure large disparities in pupil performance within this group. This means that average attainment scores of EAL pupils can be deeply misleading. We explored this further in a previous report in partnership with The Bell Foundation.
Figure 1: Progress 8 score by pupil characteristics
The attainment gap within schools
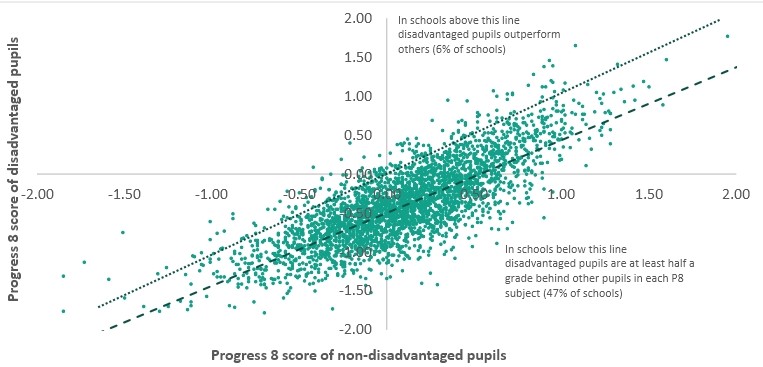
In almost half (47 per cent) of state-funded mainstream schools, disadvantaged pupils are at least half a grade behind other pupils in each Progress 8 subject.
Figure 2: Progress 8 scores for disadvantaged and non-disadvantaged pupils at school level
Attainment in Opportunity Areas
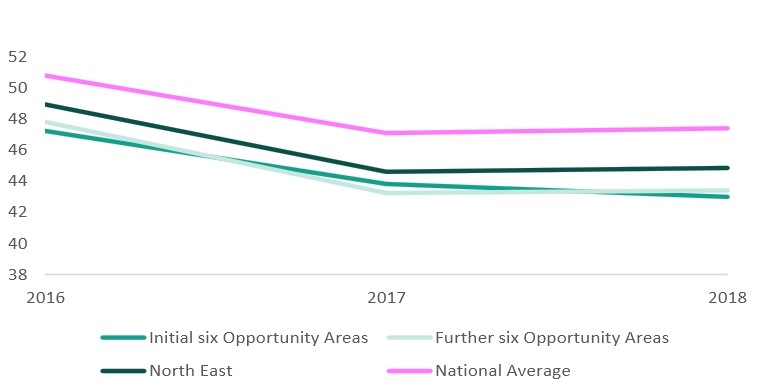
Two years on from the announcement of the twelve DfE Opportunity Areas, pupils in these targeted areas continue to attain below the national average at GCSE. This is not unexpected, given that sustainable improvement takes time. We will continue to follow progress in these areas as new data is released.
Figure 3: Average Attainment 8 score per pupil in schools in Opportunity Areas
Government targets for EBacc entries
The DfE has said that, by 2022, 75 per cent of pupils should be entering the English Baccalaureate. The new Ofsted handbook also proposes to take this target into account during inspections. 69 per cent of grammar schools are currently meeting this target, compared with only 7 per cent of non-selective schools.
Figure 4: State-funded mainstream schools hitting 75 per cent target for EBacc entry
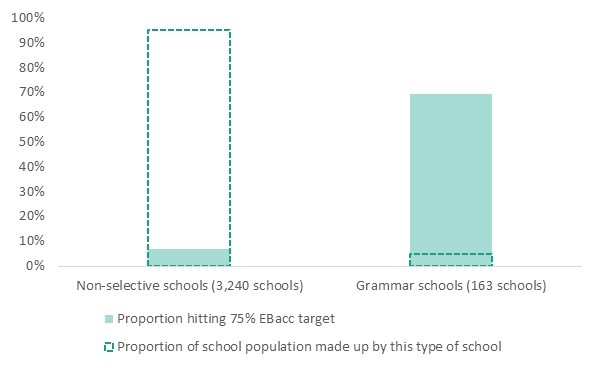
Non-selective schools (representing 95 per cent of all mainstream state-schools), are much less likely to be hitting the government target. Furthermore, it appears many schools are far from the 75 per cent level: the average EBacc entry rate in state-funded schools is 38.4 per cent. The DfE’s statistical release [2] explains that there is a substantial subset of pupils (46.6 per cent of the state-school population) whose GCSE subject-choices are just one subject short of counting towards the EBacc entry rate [3]. 83.8 per cent of this subset are hitting all the areas except for a language subject. We will be releasing further research into the take-up of language subjects later in 2019.
In summary, the widening of the disadvantage gap, even by a small amount, is cause for concern given that it continues the trend of slowing progress towards equity. The impact of the Opportunity Areas scheme remains to be seen, and the achievement of the EBacc entry target appears to be a long way off for many schools.
[1] DfE (2019), Key stage 4 and multi-academy trust performance, 2018 (revised) p.24
[2] DfE (2019), Key stage 4 and multi-academy trust performance, 2018 (revised) p.13
[3] A pupil must take GCSEs in all five components of the EBacc (English, maths, science, a language and a humanities subject) to count towards the EBacc entry rate.