Executive summary
Suspensions, or temporary removals from school, form part of an array of sanctions used to manage pupil behaviour. In this research note, we investigate the link between suspensions in primary school and Key Stage 2 (KS2) outcomes. This note builds on our recently published report in which we found a stark negative relationship between being suspended and GCSE grades for secondary pupils. Similarly, recent research, using an approach which matches pupils who are suspended or excluded with non-suspended and non-excluded counterparts with similar characteristics, found negative relationships between suspensions and exclusions in primary school and outcomes at Key Stage 4.
We found:
- Amongst our cohort of pupils finishing year 6 in 2019, 2.6 per cent of pupils were suspended during primary school. Suspensions are much less common in primary school than secondary school; amongst secondary pupils finishing year 11 in 2019, 15 per cent experienced at least one suspension.
- Of pupils who experience suspension in primary school, three in five had one or two suspensions.
- On average, suspended pupils left primary school having not met the expected standard in reading and maths.
- In fact, suspended pupils were, on average, approximately 10 months behind their not-suspended peers.
Even after accounting for other factors – including demographic characteristics, economic disadvantage, prior attainment and school characteristics – which may explain differences in KS2 outcomes, the negative effects of multiple suspensions remain statistically significant, though reduced in size.
The majority of suspended primary school pupils have one or two suspensions
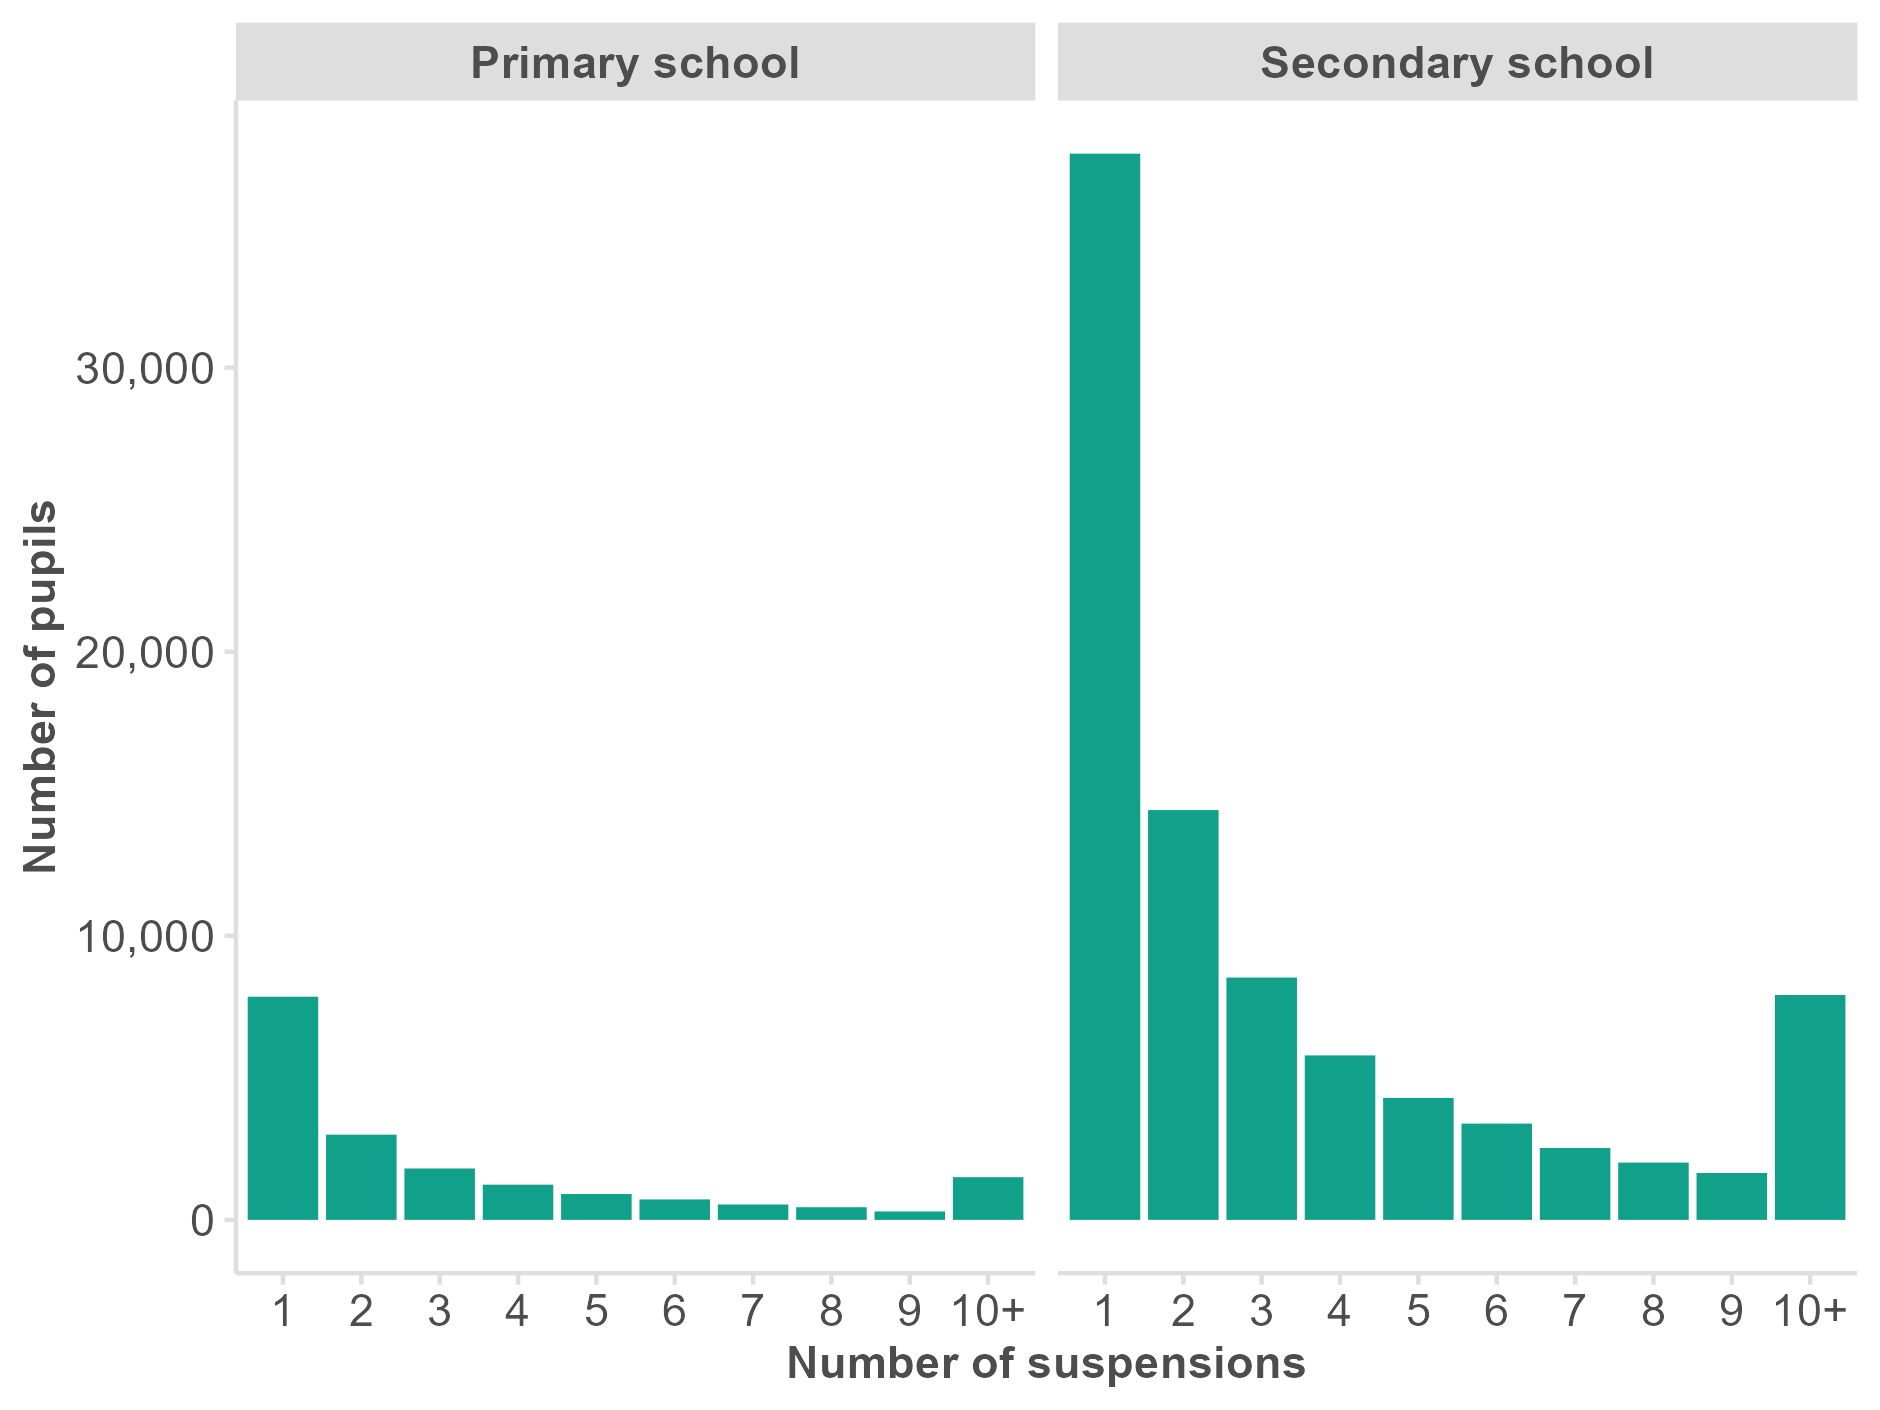
Amongst the cohort of pupils finishing year 6 in 2019, we found that only 2.6 per cent of pupils were suspended during the primary phase.1 Of these suspended pupils, 43 per cent had been suspended once and 59 per cent had been suspended once or twice.
Figure 1 shows that the number of primary school pupils who experienced multiple suspensions sharply decreased as the number of suspensions increased. Compared to the cohort of secondary school pupils covering a similar period, pupils in primary school were far less likely to be suspended. In both phases, there is a similar sharp drop in the number of pupils suspended multiple times.
Figure 1 Number of pupils by number of suspensions in primary and secondary school
Children with multiple suspensions are less likely to meet the expected standard in reading and maths
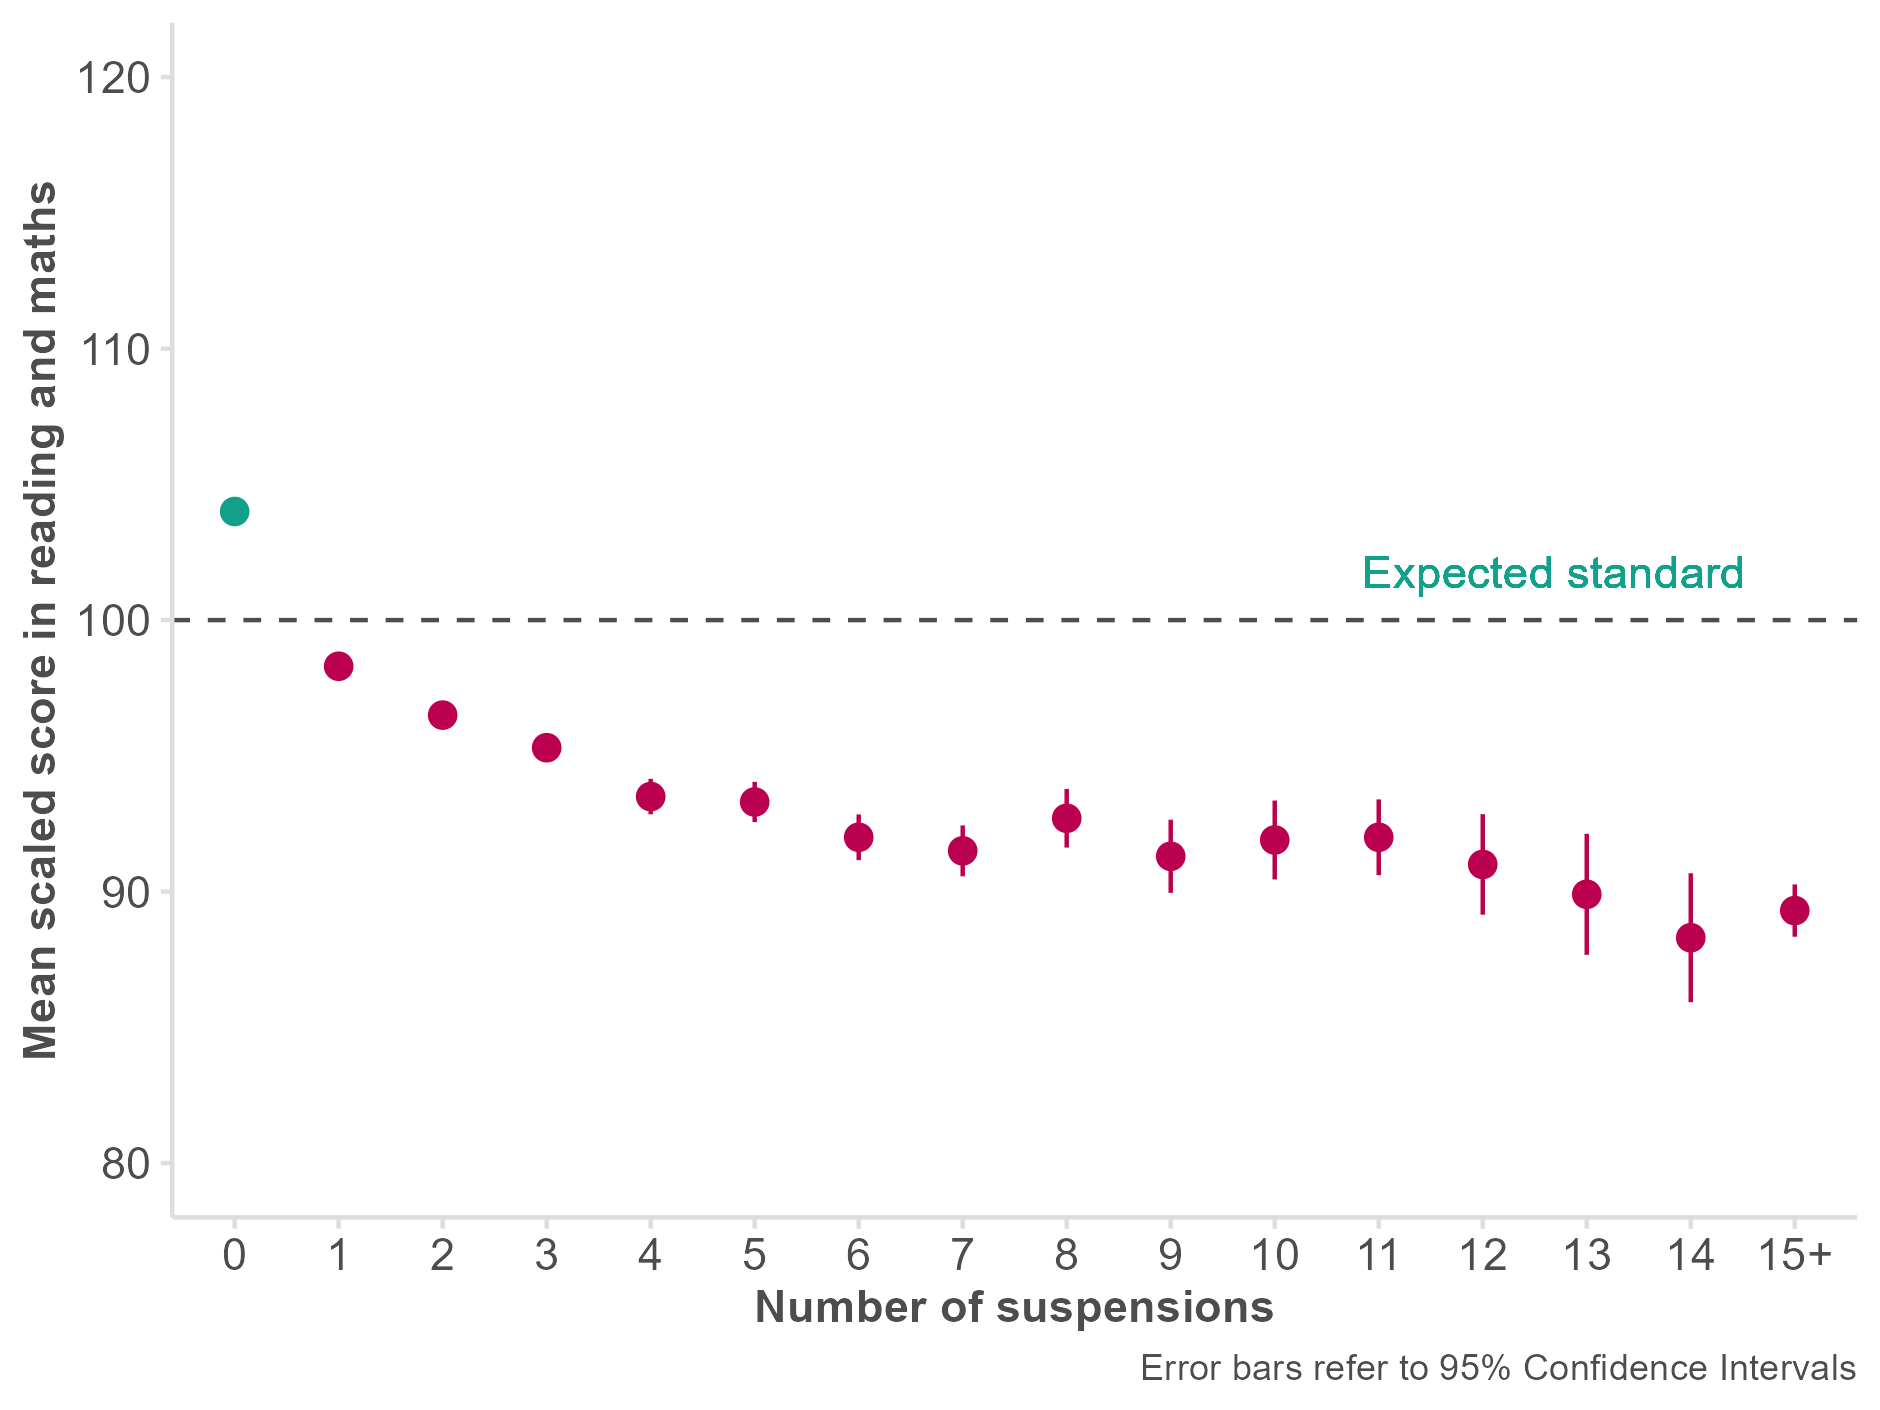
We found that pupils who had been suspended in primary school were approximately 10 months behind their not-suspended peers at KS2, based on average KS2 scaled scores in reading and maths and the Education Endowment Foundation’s conversion tables. The government aims for pupils to leave primary school having met the ‘expected standard’ or a scaled score of 100. However, we found that whilst not-suspended pupils scored an average of 104, suspended pupils scored 8 points lower on average, pushing them below the expected standard. This difference was statistically significant and large (effect size of 0.8).3
Comparing suspended pupils to those who were never suspended obscures the wide variation in attainment based on the number of suspensions. We also investigated average KS2 scaled scores by the number of suspensions. Figure 2 shows the negative relationship between the number of suspensions and attainment; as the number of suspensions increased, pupils’ KS2 attainment decreased. This graph suggests that even pupils with just one suspension were, on average, not meeting the expected standard in reading and maths.
Figure 2 Mean scaled scores in reading and maths by the number of suspensions
Isolating the ‘net-effect’ of suspensions on KS2 outcomes
Understanding why suspended pupils score worse can be difficult. For example, some pupils may have already been struggling in school before they were suspended. Alternatively, it may be that some schools with lower attaining pupils are also more likely to use suspension. To account for these possibilities, we applied multilevel modelling to identify the ‘net effect’ of a suspension on outcomes, accounting for the pupil and school factors which may also play a role in this relationship.
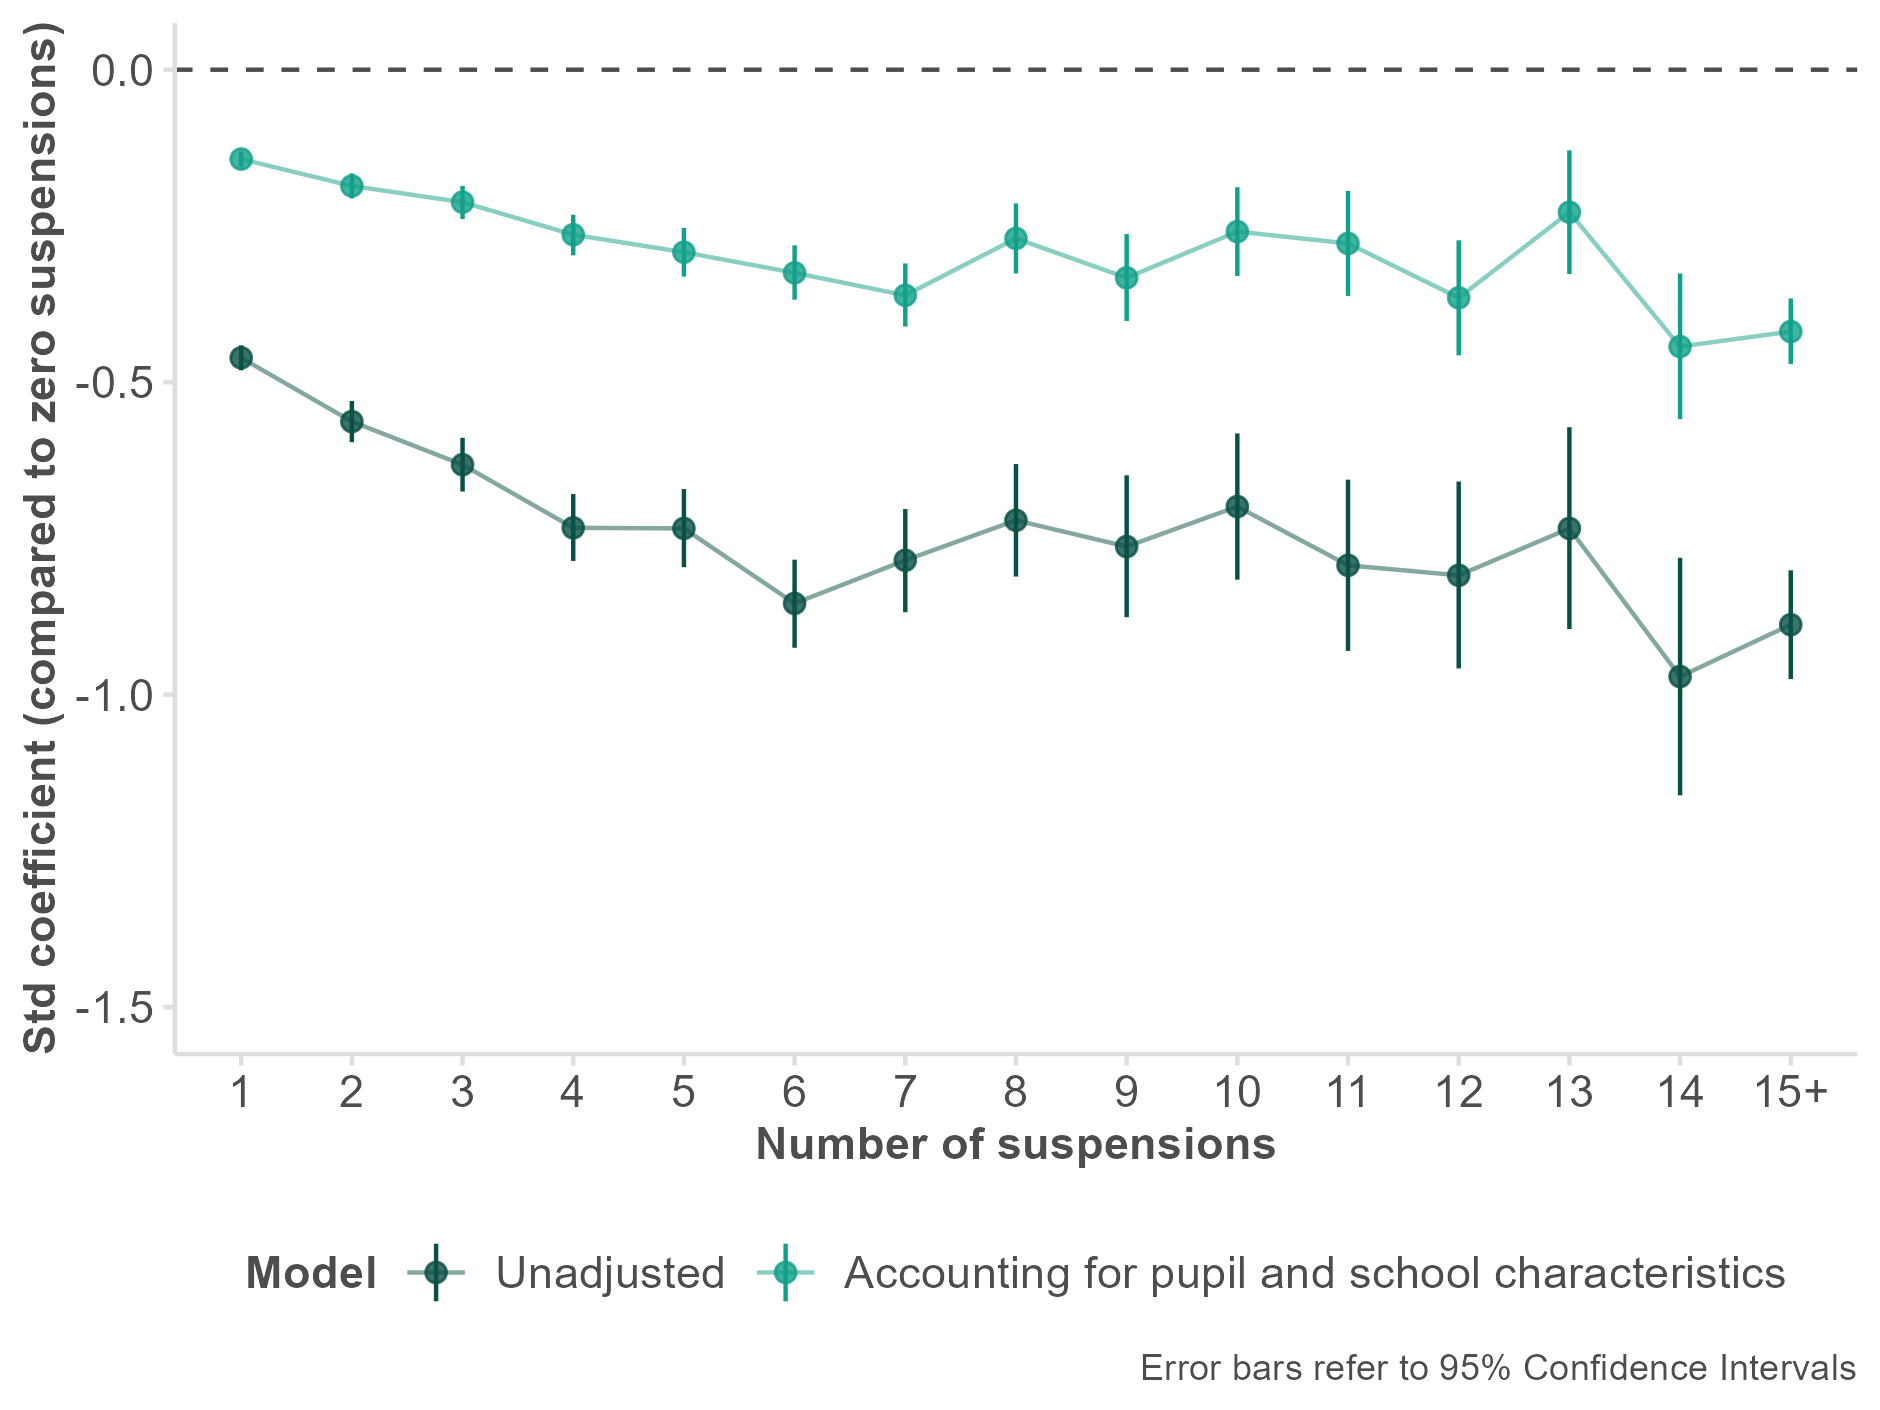
We found that individual and school factors account for 50 to 70 per cent of the effect of multiple suspensions on KS2 outcomes. Figure 3 presents results from our models of the unadjusted and adjusted relationship between the number of suspensions and KS2 outcomes. The effect of multiple suspensions was identified relative to zero suspensions. As we standardised the KS2 results with a mean of zero and a standard deviation of one, our results show the effect size in standard deviation units of experiencing suspensions, compared to no suspensions. In our unadjusted model, pupils with one suspension scored, on average, 0.46 SDs lower than those with no suspensions. Pupils with ten suspensions scored 0.7 SDs lower, and pupils with 15+ suspensions scored 0.89 SDs lower. After adjusting for pupil and school characteristics, these effect sizes decreased to -0.14, -0.26 and -0.42 SDs respectively.
The negative relationship between multiple suspensions and KS2 outcomes remained statistically significant but adjusting for pupil and school characteristics attenuated the effect, suggesting that a pupil’s pre-existing characteristics – for example, their attainment in KS1 – as well as school characteristics play a large part in both experiencing multiple suspensions and poorer KS2 outcomes. It is important to note that the limited occurrence of multiple suspensions in primary school introduced uncertainty in estimating effects beyond a few suspensions, as indicated by the overlapping error bars in Figure 3.
Figure 3 A coefficient plot showing the relationship between the number of suspensions and KS2 results in unadjusted and full models accounting for pupil and school characteristics
Although the association between suspensions and KS2 outcomes persisted after controlling for a wide range of pupil and school characteristics, we cannot be sure that suspension itself causes worse KS2 outcomes. Other unmeasured characteristics, such as their behaviour in the classroom, are likely contributing to this relationship.
Conclusion
Through this analysis, we found that, on average, suspended pupils left primary school having not met the expected standard in reading and maths. We also found that the negative effects of multiple suspensions remained significant after accounting for a range of pupil and school characteristics.
This analysis shows that being suspended in primary school is linked to poorer outcomes, even if we cannot say that suspension causes low attainment. We also know that there is a link between low attainment in KS2 and suspensions in secondary school. In our longer report exploring the relationship between suspensions and KS4 outcomes, we found a strong, negative relationship between the number of suspensions and attainment.
Findings from this analysis and our report suggest that suspension, and risk of suspension, may be a key indicator for schools that a pupil is at risk of low academic achievement. The case for intervention to disrupt this negative trajectory is bolstered by the knock-on effects of poor attainment on adult outcomes including labour market participation and earnings. Furthermore, the bidirectional relationship between suspension and attainment throughout a pupil’s school career suggests that effective sharing and use of data on pupils’ history across phases is important so that schools can plan interventions proactively.
Notes
For further information regarding our methodology, see Appendix B of our report ‘Outcomes for young people who experience multiple suspensions’.
We measured attainment by averaging a pupil’s score in reading and mathematics. Scores for each subject were from the national curriculum tests, adjusted to account for the difficulty of the paper. Although scaled scores typically range between 80 and 120, we included teacher-assessed scores (ranging between 59-79) for pupils who did not reach the lowest measurable score in the test. This was to ensure their scores were represented in the distribution of scores. If only one score (reading or mathematics) was available, that score became the average for that pupil. Pupils with missing data in both subjects were excluded from the analysis.
This publication includes analysis of the National Pupil Database (NPD): https://www.gov.uk/government/collections/national-pupil-database
The Department for Education is responsible for the collation and management of the NPD and is the Data Controller of NPD data. Any inferences or conclusions derived from the NPD in this publication are the responsibility of the Education Policy Institute and not the Department for Education.
This work contains statistical data from ONS which is Crown Copyright. The use of the ONS statistical data in this work does not imply the endorsement of the ONS in relation to the interpretation or analysis of the statistical data. This work uses research datasets which may not exactly reproduce National Statistics aggregates.