The government has now published its latest round of guidance as it aims to get all pupils back in school in the autumn term.
The government is right to seek to bring all children back into education from September, provided the health advice supports this decision. Learning loss since March is likely to have been significant and will undoubtedly have increased the already unacceptable attainment gap between disadvantaged pupils and other students. EPI research shows that at GCSE level, this gap was already at 18 months of learning.[1]
It is guidance that is very much focused on what schools should do rather than what they must do. Recognising that strict social distancing and rigorously maintained small bubbles of pupils would make fully opening impractical for most schools, the government has explicitly said that such approaches are not ‘all-or-nothing’ options and say that they will still ‘bring benefits even if implemented partially’. For example, teachers can move between year groups, and wider groups might mix for specialist teaching. The emphasis is therefore on reducing the risk of infection not on eliminating it, but we don’t know the extent to which that will happen.
One of the many concerns facing both schools and parents has been not just whether pupils should be going to school but how they are going to get there. The advice continues to be to avoid public transport and walk or cycle if at all possible.
Despite the diversity of the school system in England around half of pupils in England do still attend their nearest school, but that does not mean that they live right next to their school, and data collected via the school census demonstrates the scale of the challenge.
Primary schools typically draw in pupils from up to 2 miles away. For secondary schools this increases to over 3 miles, and understandably these distances are larger for schools based in rural areas.[2] Pupils attending special schools travel further still, typically around three times the distance for pupils in mainstream education.[3] We’ve estimated in the past that in rural areas, 1 in 10 pupils in special schools travel over 20 miles to get to school.
All of these are straight line distances and under-estimate the true distance that pupils travel – our estimates suggest that a straight line of 1.5 miles translates to 2 miles in the real world. But even at these levels, walking or cycling is simply not going to be feasible for a significant number of pupils.
The Department for Transport’s National Travel Survey estimates that 45 per cent of pupils either walk or cycle to school, and a further 35 per cent are taken by car – meaning that 1 in 5 pupils use either public transport or school buses.[4] At secondary level this rises to 1 in 3 pupils (of these around two thirds take public transport).
It is not possible to see whether these pupils could readily switch mode of transport from this source, however there are other ways. Earlier this year we carried out a project, supported by the Nuffield Foundation, to consider what factors outside of school might affect pupil outcomes. We used this as an opportunity to look at data sources that we had not previously explored, including the historic mode of transport data. This used to be collected by the Department for Education, however, the department ended the requirement on schools to provide this information as part of the School Census from 2012.
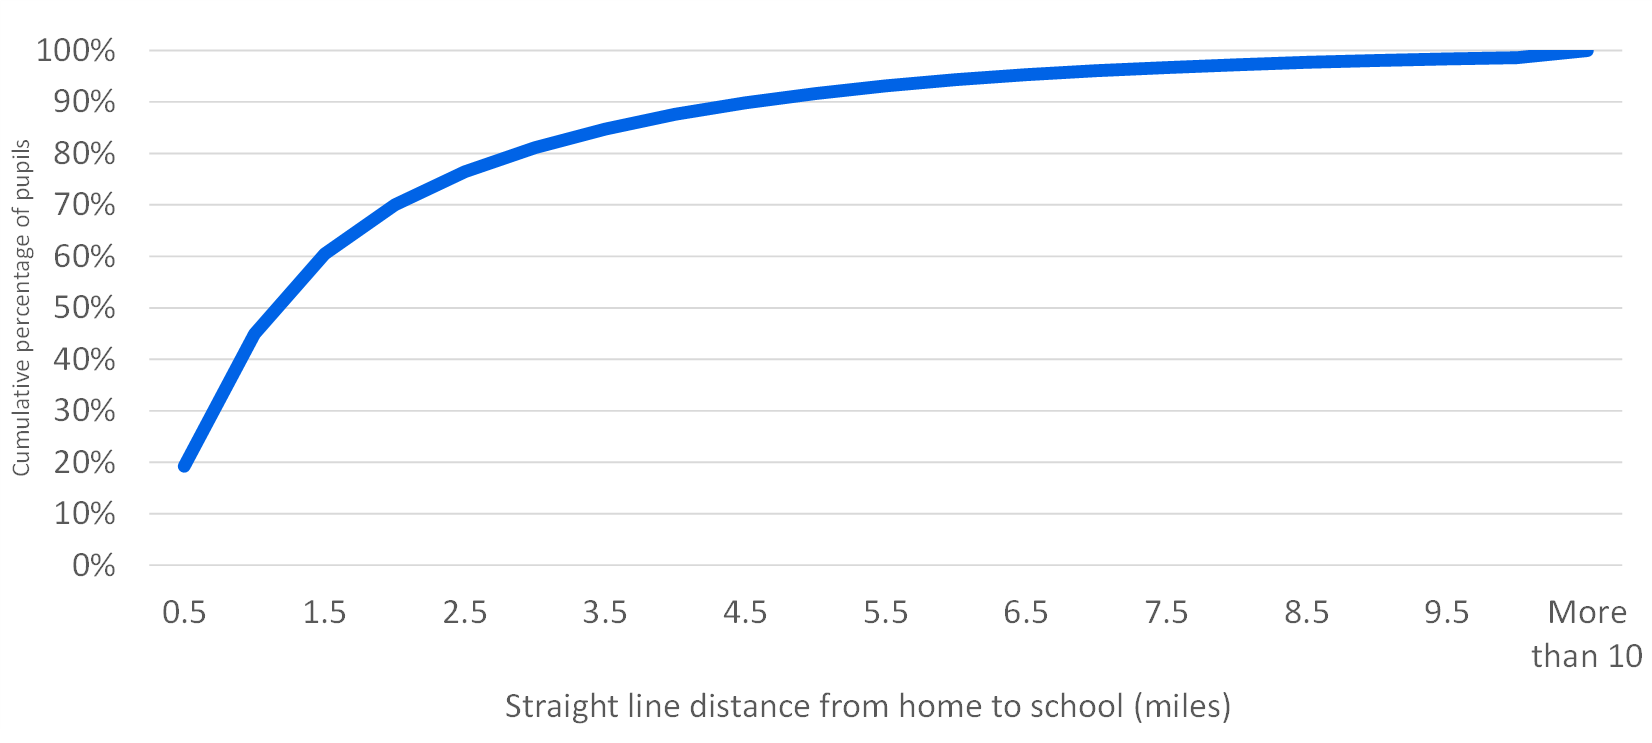
We focused on the Key Stage 4 cohort for 2011 and started by again looking at how far they were travelling to school. Figure 1 shows the cumulative percentage of pupils at each straight-line distance from home to school.
_____________________________________________________________________________________________________________________
Figure 1: Cumulative percentage of Key Stage 4 pupils (2011) by straight-line distance from school

Source: National Pupil Database, Key Stage 4 2011 | Coverage: All pupils in state-funded schools.
_____________________________________________________________________________________________________________________
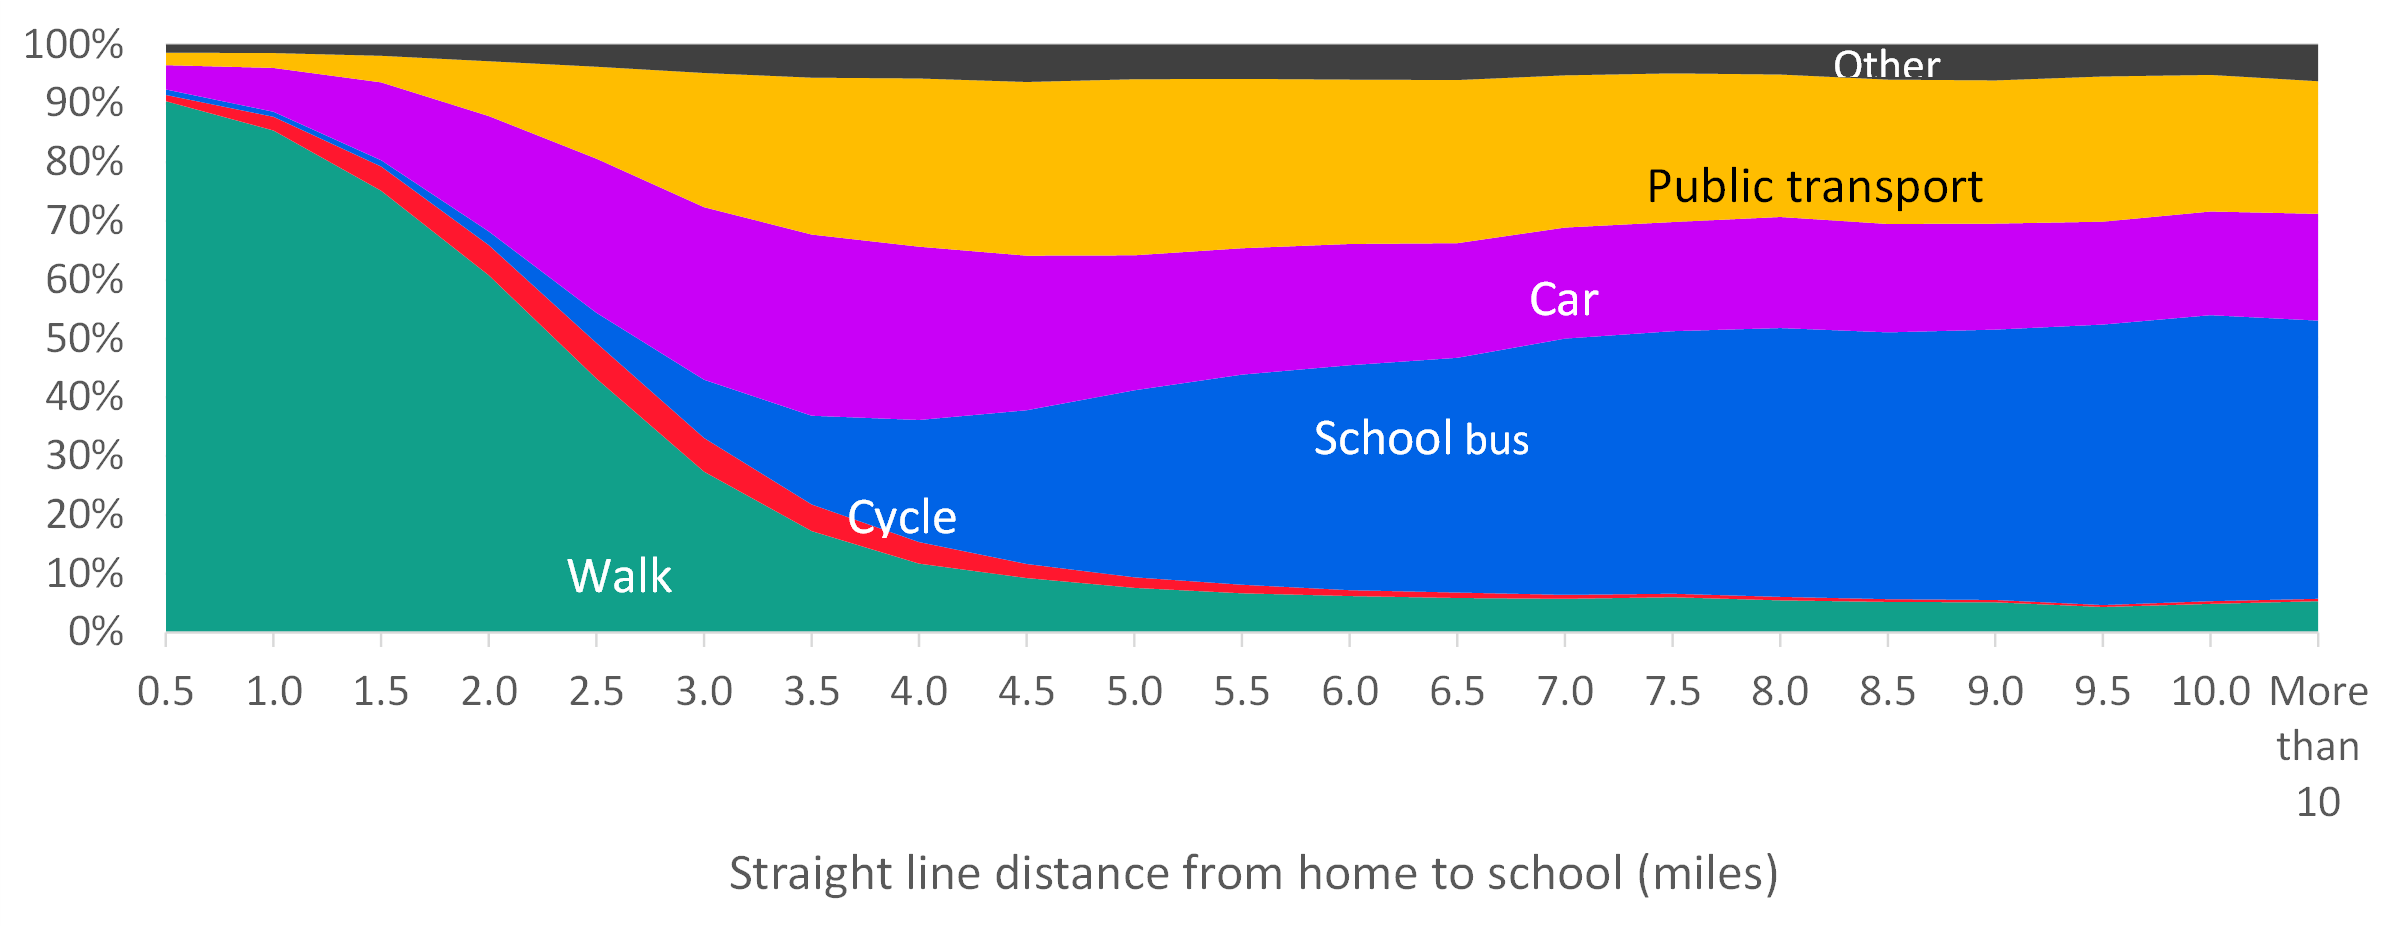
We then looked at how the method of transport varied by how far pupils were travelling to school. Figure 2 shows the method of transport by straight line distance from school. For short distances the majority of pupils walked to school each day. Those that were travelling further relied on a mix of cycling (a very small proportion), public transport, school bus services and private cars. Note that this data is far from perfect, it seems somewhat unlikely that pupils are walking over five miles to school each day.[5]
_____________________________________________________________________________________________________________________
Figure 2: Mode of transport to school by straight line distance between home and school – all schools

Source: National Pupil Database, Key Stage 4 2011 | Coverage: All pupils in state-funded schools.
_____________________________________________________________________________________________________________________
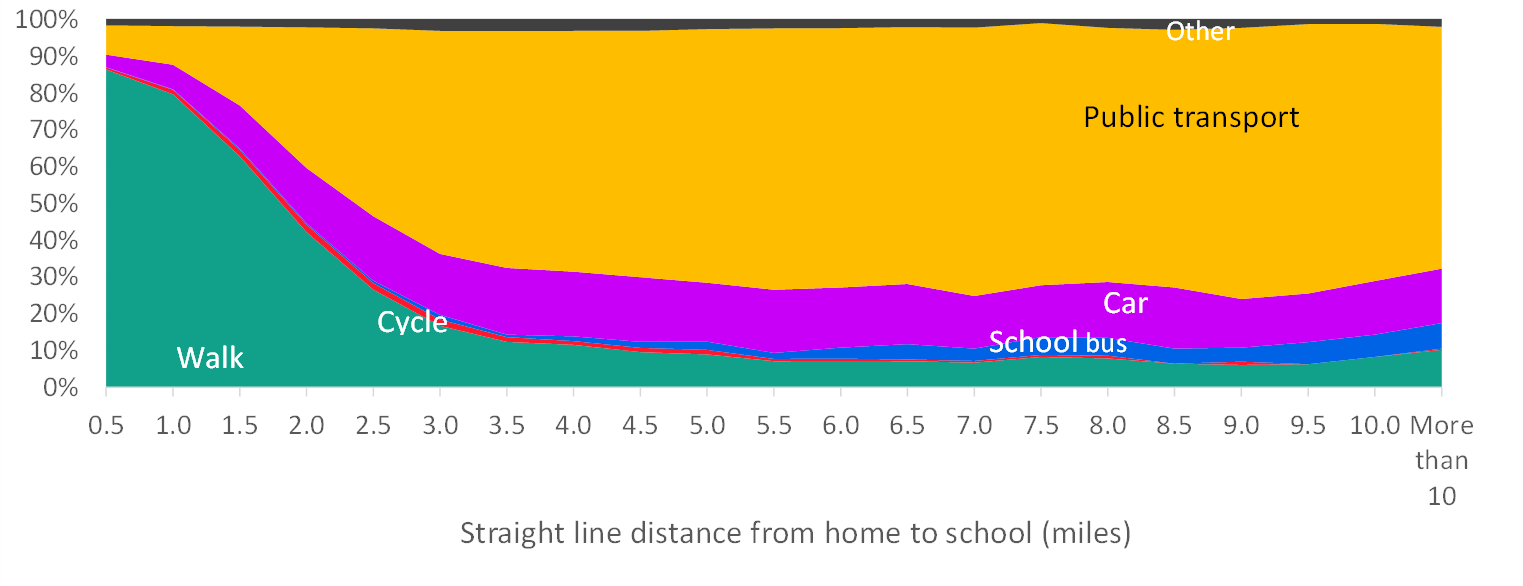
The extent to which these alternatives are used is naturally going to depend on the services offered in the local area. To illustrate this point, Figure 3 shows how this breakdown differs in London. Nationally, pupils who travel several miles to school frequently rely on school buses with public transport accounting for a relatively small proportion of journeys (typically around 45 per cent of pupils use school buses and 25 per cent use public transport). In London, public transport dominates, accounting for around 70 per cent of longer journeys.
This is not surprising, London has an extensive and frequent transport network with free and subsidised travel for children (though this has been temporarily suspended as part of the government’s support package to Transport for London). There is less need for school bus services other than for those who require specialist transport.
_____________________________________________________________________________________________________________________
Figure 3: Mode of transport to school by straight line distance between home and school – schools in London

Source: National Pupil Database, Key Stage 4 2011 | Coverage: All pupils in state-funded schools.
_____________________________________________________________________________________________________________________
This analysis suggests that the vast majority of pupils who can walk to school are doing so and only a very small proportion of those within a reasonable walking distance from school are taking public transport or school buses. In other words, if pupils are on school buses, or on public transport, it is because they have no other option unless they have access to a private car.
So while the government is telling schools to create bubbles of entire year groups within schools, there is currently no credible solution to the problem of them then mixing with other year groups, and other schools, on the bus home again. Parents of pupils with health conditions will have even more concerns in such a situation.
These are difficult problems to fix and the government is now asking local authorities to work with schools to identify typical routes to schools and the potential to move to other modes of transport and consider other ways to manage demand on transport.
The government has cited the 2012 London Olympics as an example of how it is possible to make a very real difference to travel patterns where there is a concerted effort to do so and where the general public understand the imperative for doing so. But the situation we face today with an ongoing pandemic presents an assortment of very different challenges to those of eight years ago and many questions remain about the level of risk that school staff, pupils, and their families are being asked to take.
[1] https://epi.org.uk/publications-and-research/annual-report-2019/
[2] https://epi.org.uk/publications-and-research/free-schools-england/ (Annex 1)
[3] https://epi.org.uk/publications-and-research/access-special-schools-england/
[4] DfT, ‘National travel survey: 2018’, July 2019 (table NTS0615)
[5] This may be because the pupil took multiple forms of transport, or because where they travelled from for the purposes of the mode of transport question was different from the home address, or simply incorrectly recorded.

