The white paper earlier this year confirmed the government’s intention that all schools should be part of multi-academy trusts (MATS) by 2030. However, four education secretaries later, the priorities for DfE are now less certain. In the midst of this turbulence, the Schools Bill now appears to have been shelved, and with it the government’s plan to tidy up the fragmented school system.
In the meantime, we have long argued that we need a strong understanding of MAT performance and how we measure it, as research has shown that academisation is not a silver bullet for improving standards. In particular, we need a better understanding of which MATs are most effective, and what it is that those MATs do which sets them apart from the rest.
To help answer this last question, we surveyed 41 MATs and 81 schools between April and July 2022. This was the first wave of the Decisions in Education in England Panel (DEEP) survey, which is part of a multi-year mixed methods project which aims to identify the most effective MATs and school groups (including local authorities, dioceses and federations).
The EPI DEEP survey is open to all school leaders and aims to capture the decisions and policies currently being implemented across MATs and school groups in England today. By correlating our survey findings with the outcomes achieved by those trusts, we hope to reach strong and practical conclusions about best practice in how trusts operate. A major goal of this research is to provide insights which are genuinely helpful for CEOs wishing to improve their trusts. You can read about what taking part involves and register your interest here.
The first wave focuses on financial and workforce management, and this blog presents some of the first, early analysis of our findings.
We focus here on analysing responses to a single question, in which we ask MAT leaders how centralised their financial decision-making is, and which financial decisions they leave to schools to decide.
We find that for some financial decisions, almost all trusts take a common approach, while there are other financial decisions where we find substantial variation in how trusts settle them.
Identifying these areas of consensus and variation is useful in itself, so that trust leaders and decision-makers can understand how much their practice varies from others. But uncovering these patterns is also the first step towards further analysis linking different practices to outcomes.
There are various reasons why financial decisions are made at different levels in different MATs. It could be a deliberate move on the part of the trust to ensure better decision-making and more effective management. Different trusts may also be making different decisions due to differing circumstances surrounding their MAT.
However, a MAT’s decision-making process may be less of a deliberate strategy and more of a historical way in which they have made various financial decisions.
Our early results
In the survey, MAT CEOs were asked to rate on a scale of zero to five how centralised their decision-making is for a range of financial areas, zero being totally devolved to school level and five being totally centralised. Figure 1.1 shows the percentage of MAT leaders who responded with either a zero or a five, indicating either fully centralised decision-making or fully individual decision-making, on each of the thirteen survey questions.
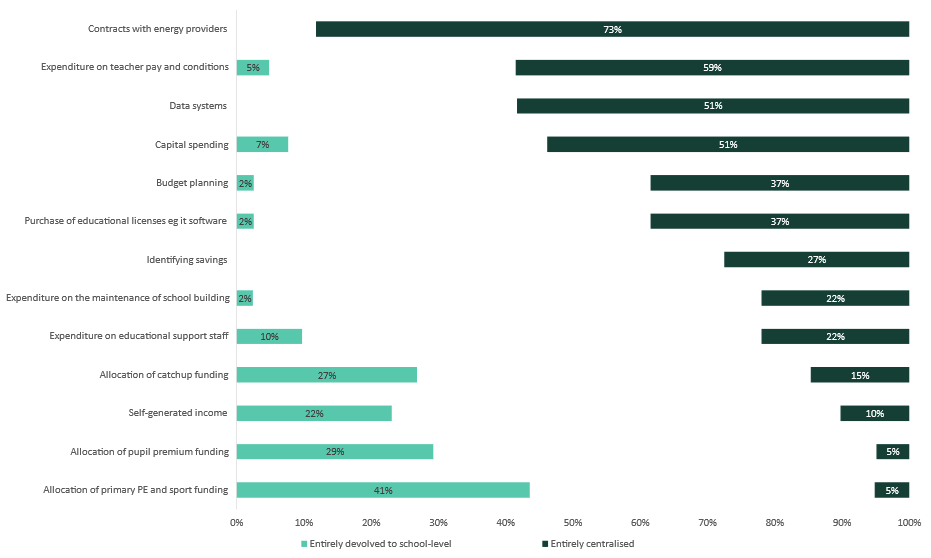
Figure 1.1 The proportion of MATs with either fully devolved or fully centralised decision-making across a range of areas
Figure 1.1 reveals that decisions relating to energy contracts, data systems (such as common systems for timetabling, attendance and assessment), capital spending, and teacher pay and conditions tend to be made predominantly at the MAT level. This is demonstrated in more detail in Figure 1.2. However, individual schools more often make decisions regarding pupil premium allocation, and PE and sports funding.
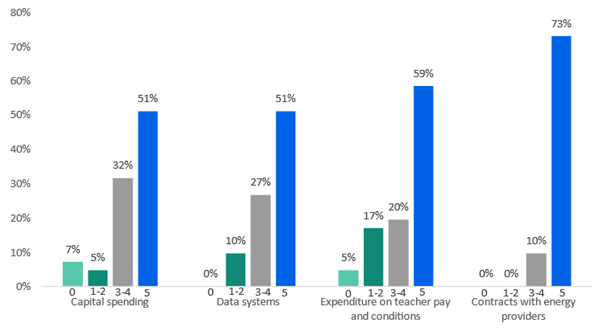
Figure 1.2 MAT responses to financial decisions that tend to be mostly centralised (0 = fully devolved, 5 = fully centralised)
Areas of consensus
In Figure 1.1, we saw that a high proportion of the MATs in our sample leave decisions about the allocation of pupil premium and sports and PE funding almost entirely at the individual school’s discretion.
Figure 1.3 shows how this varies between types of MAT.
We differentiate the 41 MATs in our survey by size, using the conventional typology that sorts MATs into starter trusts (fewer than 1,200 pupils), established trusts (1,200-5,000 pupils), national trusts (5,000 to 12,000 pupils) and system trusts (more than 12,000 pupils). In addition to this we also identify diocesan MATs: we define these as MATs where at least 60 per cent of their schools have a diocese affiliation. In terms of size, all diocesan MATs in our sample are ‘established’ size, with the exception of one which is ‘national’ size. Given that we find diocesan MATs tend to give quite different responses to similar sized MATs, we report them here as a separate group, and they are not included in either the national or established trust analysis. Starter trusts are not included, given a low number of responses among starter trusts.
Differences between MAT types should be treated with caution given low numbers. Based on this small sample of data, it appears there is little relationship between the size of a MAT and how they make their financial decisions. However, our small sample means this cannot be treated as conclusive. It is possible that, with more responses from each group type, we would see greater differences between them.
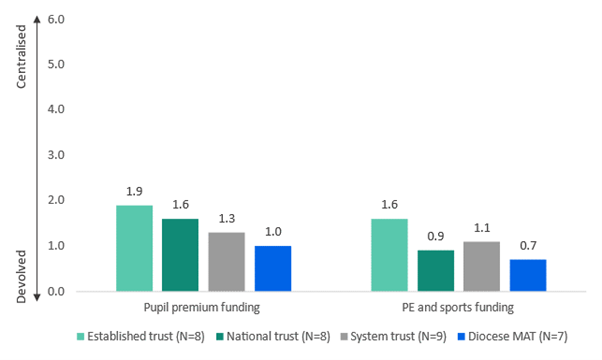
Figure 1.3 Average response for the four MAT types on the two areas of financial decision-making which tended to be made at the school level
In the case of allocating pupil premium and PE and sports funding, established trusts appear slightly more centralised in comparison with other trusts, whilst diocesan trusts are the most devolved in these areas.
Turning to financial decisions mostly made at trust level, Figure 1.4 compares differences between MAT types.
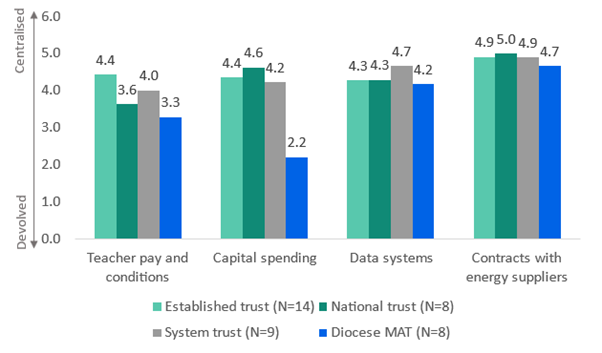
Figure 1.4 Average response for the four MAT groups on the four areas of decision-making which tended to be decided at the central MAT level
Almost all MATs make decisions regarding energy provider contracts at a central level.
Financial decisions for data systems are also mostly decided at the MAT level, with negligible variation between types of MATs.
There is slightly more variation in how teacher pay and conditions, and capital spending are decided, with diocesan MATs being comparatively less centralised in these decisions.
Across the board, diocesan MATs tend to be more devolved in decision making.
Dioceses have traditionally had a more arms-length relationship with schools, including in terms of capital spending. When dioceses academise to form trusts, we might expect them to form comparatively closer relationships with member schools, but it appears from this data that some of this historical arms-length approach is being retained. As more and more dioceses are forming trusts, it will be interesting to observe any continuing differences in operations, and to investigate any associated differences in outcomes.
This section has demonstrated that there is consensus among MATs, or at least commonalities in practice, in how to take certain financial decisions.
The next section introduces financial decisions where there is far more variation in how MATs approach them.
Areas of varied practice
We find substantial variation in the degree of centralisation in financial decision-making for three areas: self-generated income, expenditure of support staff, and allocation of catchup funding.
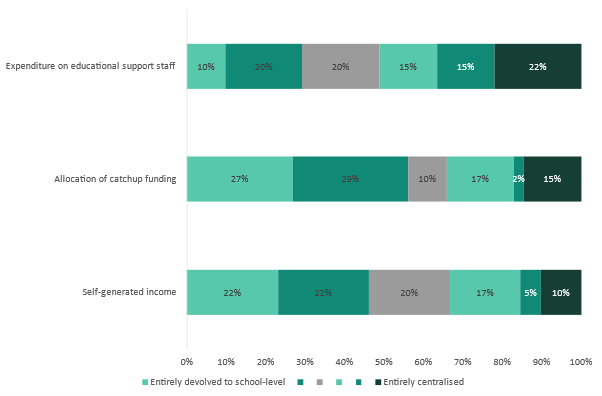
Figure 1.5 Distribution of responses for areas with most varied practice
While a third of MATs in our sample indicate that allocation of catchup funding is entirely devolved to schools, 15 per cent indicate that this decision-making is entirely centralised. Responses on decision-making related to expenditure on support staff are particularly varied, with MATs nearly evenly split between response categories 0-2 (52 per cent) and categories 3-5 (48 per cent).
It appears therefore that there is a lack of consensus across MATs as to the most effective way to spend certain types of funding. For example, when deciding how to allocate catch-up funding, some MAT leaders believe that an individual school will know how best to spend their catch-up funding and where the greatest need is. However, other MAT leaders may choose to effectively ‘pool’ all of the catch-up funding of their schools and allocate it across the trust according to a more high-level strategy.
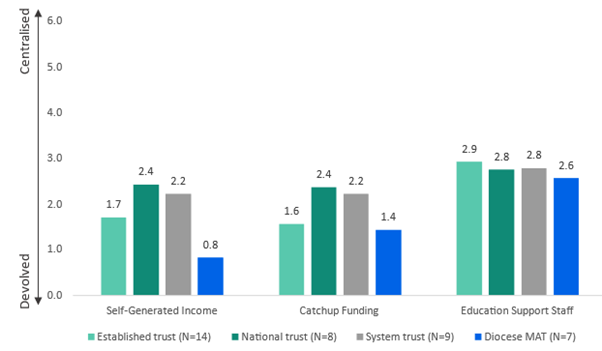
Figure 1.6 Average response to the three areas where there was little consensus on making specific financial decisions, by MAT type
Figure 1.6 shows the average response to these areas of decision-making across different types of MATs. We find that most MAT types average between 2.0 and 3.0 for each decision-making area, indicating variation within each MAT type. We see negligible differences between MAT types for decision-making on education support staff spending. By contrast, there is more variation between MAT types for decisions on self-generated income and on allocating catchup funding, though small numbers mean we should treat these differences with caution. Overall, larger MATs (national and system trusts) appear slightly less devolved on average, and diocesan and established MATs are more devolved. As found for areas of consensus, diocesan MATs appear particularly likely to devolve decisions on self-generated income to schools, returning an average response of 0.8.
This survey data has the potential to provide robust evidence of best practice – but to achieve this we must increase our sample size
This blog is a small snapshot of the possible insights we can gain from collecting and analysing new data on how MATs operate. Ultimately, we aim to build a rich database of MAT practices and policies that we can link to performance data, in order uncover rigorous evidence of how the best MATs achieve their outcomes.
Sample size is a major challenge to achieving our aims.
With current response rates, we do not have enough valid data to accurately determine patterns and trends between how financial decisions are made and outcomes relating to these decisions. For example, in figure 1.7 we compare turnover rates of teaching assistants to the centralisation of decisions regarding expenditure on education support staff.
These turnover rates are an example of the quantitative metrics we are developing in order to measure effectiveness of multi-academy trusts.
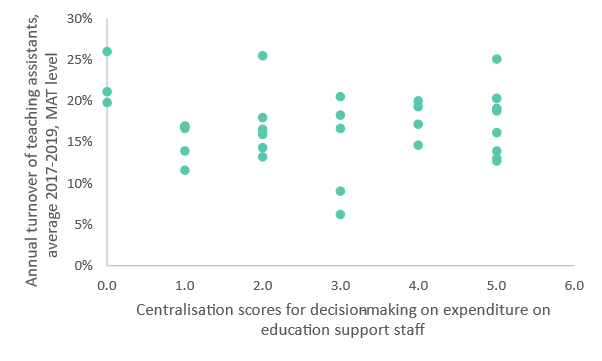
Figure 1.7 plots the centralisation of decision-making relating to the expenditure on education support staff and teaching assistant turnover.
With this limited sample, support staff turnover appears to be unrelated to whether the individual school or the MAT decided on expenditure on support staff. This may be a ‘true’ finding, but we cannot draw any concrete conclusions using such a small sample size.
To build on our data and expand the number of respondents, we are opening a second round of the survey after the October half-term to gather similar data relating to decision-making, pupil inclusion and outcomes.
There is great potential in the survey’s findings if we have good quality data. School leaders’ participation is essential to achieve this.
You can read about what taking part involves and register your interest here.