The Education Policy Institute (EPI) has published its Annual Report on the state of education in England, including the attainment gap between disadvantaged pupils and their peers.
Education in England: Annual Report 2020, which is published in partnership with the Fair Education Alliance (FEA) and Unbound Philanthropy, also examines the gap at a local level, across different school subjects, and among different groups of pupils – including by varying levels of disadvantage.
The new report finds that:
- The attainment gap between disadvantaged pupils and their peers has stopped closing for the first time in a decade. Policymakers have not succeeded in responding to earlier reports warning of a major loss of momentum in closing the gap.
- Disadvantaged pupils in England are 18.1 months of learning behind their peers by the time they finish their GCSEs – the same gap as five years ago.
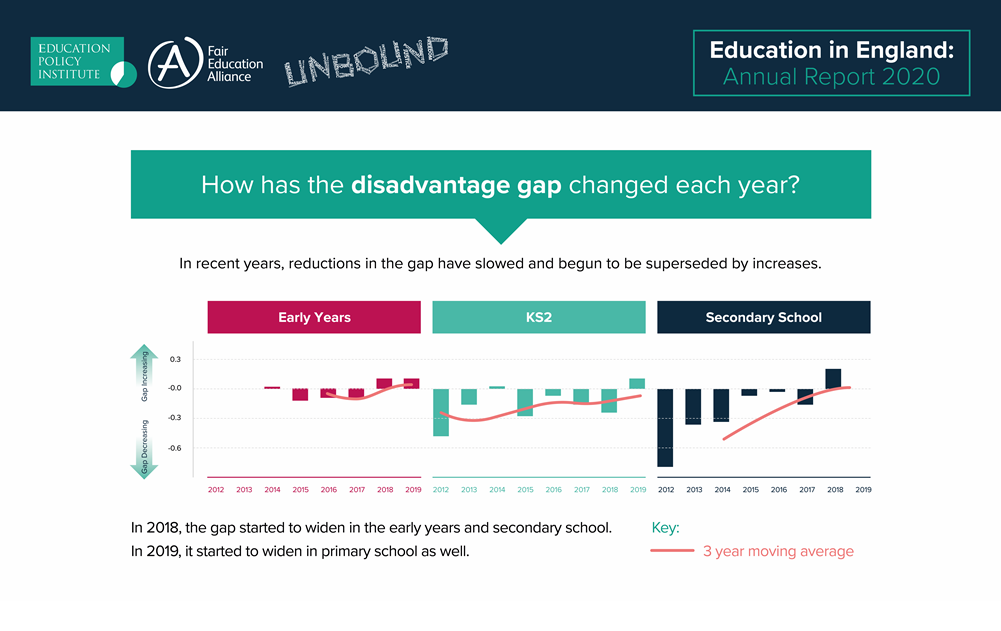
- The gap at primary school increased for the first time since 2007 – which may signal that the gap is set to widen in the future.
- The stalling of the gap occurred even before the COVID-19 pandemic had impacted the education system.
- Researchers have identified the increasing proportion of disadvantaged children in persistent poverty as a contributory cause of the lack of progress with narrowing the disadvantage gap.
You can download the full report here.
Key findings
The education disadvantage gap: the latest trends
The disadvantage gap in England has stopped closing, and there are now several strong indications that it has started to widen:
- At secondary school, by the time they take their GCSEs, disadvantaged pupils (those who have been eligible for free school meals at any point in the last six years) are over 18.1 months of learning behind their peers. This gap is the same as it was five years ago.
- At primary school, the gap between poorer pupils and their peers is 9.3 months, having increased for the first time since at least 2007. This could be a turning point, in which the disadvantage gap now continues to widen at this phase.
- In the early years (pupils in Reception year), the gap has stagnated at 4.6 months, having largely stayed the same since 2013.
- When will the gap close? Last year EPI modelled that it would take over 500 years to eliminate the disadvantage gap at GCSE, based on the rate of progress. This year’s data suggests an even more extreme conclusion: the gap is no longer closing at all.
How do different levels of poverty affect the disadvantage gap?
This year for the very first time, EPI researchers have analysed the gap for pupils across different levels of disadvantage:
- Children with a high persistence of poverty (those on free school meals for over 80% of their time at school) have a learning gap of 22.7 months ‒ twice that of children with a low persistence of poverty (those on free schools meals for less than 20% of their time at school), who have a learning gap 11.3 months.
- Progress in closing the gap has been slowest for pupils with a high persistence of poverty, with the gap remaining much the same after almost a decade. Disadvantaged pupils with lower persistence of poverty have also experienced worsening gaps, although to a lesser degree.
- Significantly, the proportion of pupils with a high persistence of poverty is on the rise. Since 2017, the proportion of pupils in this group has risen from 34.8% to 36.7%. This recent increase appears to be an important contributor to the lack of progress with the gap overall.
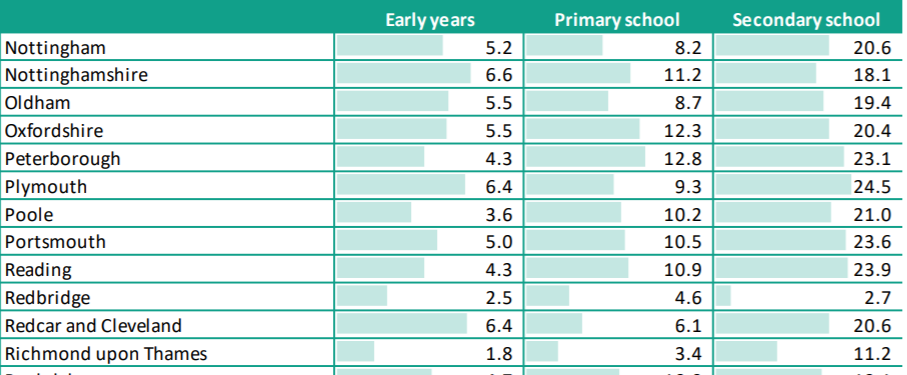
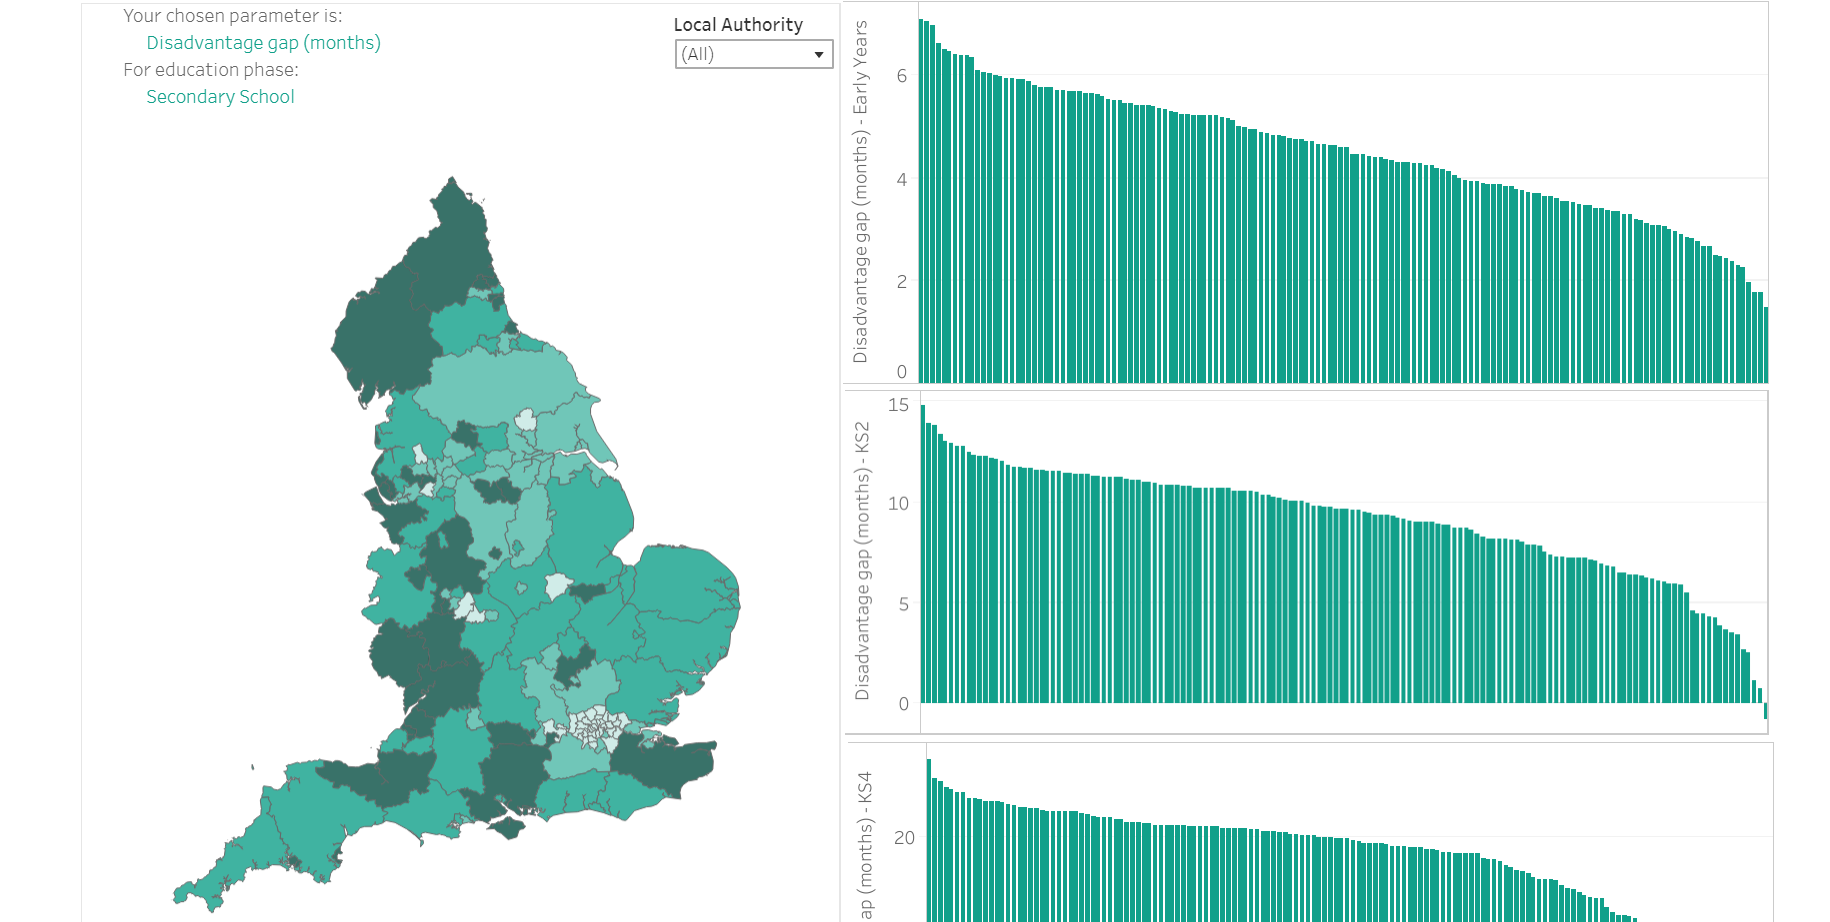
How does the disadvantage gap vary in different areas in England?
Across the country, there is wide variation in the disadvantage gap:
- Large disadvantage gaps remain well-established in several regions in England but are particularly acute in the North, West Midlands and parts of the South.
- In some areas, poorer pupils are over two full years of education behind their peers by the time they take their GCSEs, including in Blackpool (26.3 months), Knowsley (24.7 months) and Plymouth (24.5 months).
- In contrast, there are very low GCSE disadvantage gaps concentrated in London, including in Ealing (4.6 months), Redbridge (2.7 months) and Westminster (0.5 months).
This year, for the first time, EPI researchers have also calculated the disadvantage gap at a local level after having controlled for high persistence of poverty in each area.
This reveals that differences in local demographics are essential to understanding why gaps are different in different parts of the country. Under this adjusted measure, many areas that currently rank as some of the worst in the country substantially improve their position once high persistent poverty levels are considered:
- Out of 150 local authorities in England, Knowsley is ranked as having the second-worst education disadvantage gap in the whole country. However, it improves its ranking by 28 places after having adjusted for persistent poverty levels.
- Other areas also see big changes in their rankings under this poverty-adjusted measure: Sunderland moves from having the 12th largest gap to 55th, Liverpool from 23rd largest to 83rd, Hartlepool from 25th largest to 65th.
- Each of these areas have large disadvantage gaps, but a major reason for this may be the large proportion of poor children who are in persistent poverty.
Equally, the poverty-adjusted measure also highlights areas which should be performing better, given their favourable local demographics:
- Surrey makes the biggest fall down the rankings after having adjusted for poverty levels, by 30 places (84th to 54th worst gap).
- Other local authorities who lose out significantly in the rankings after applying this measure include Wiltshire (53rd to 26th worst gap), Leicestershire (71st to 43rd worst gap) and Buckinghamshire (104th to 78th worst gap).
Areas with the largest education disadvantage gaps, adjusting for persistent poverty:
Controlling for persistent poverty levels, out of 150 local authorities, areas with the largest gaps in the country are now South Gloucestershire (worst disadvantage gap), West Berkshire (second worst gap) and Blackpool (third worst gap).
(A full breakdown of all local disadvantage gaps, including by parliamentary constituency and other levels, can be found here).
How does educational attainment vary by pupil ethnicity?
Attainment varies significantly among pupil ethnic groups:
- Gypsy/Roma pupils are almost three years (34 months) behind White British pupils at GCSE level. In contrast, Chinese pupils are two whole years (23.9 months) ahead of White British pupils in learning at this stage of their education.
- Some ethnic groups have experienced growing inequalities over recent years. Black Caribbean pupils were 6.5 months behind White British pupils in 2011, but this gap has now regressed to 10.9 months, meaning that the gap has widened for Black Caribbean pupils by well over four months in the last eight years.
- Gaps have also widened for pupils from other black backgrounds, and for pupils with English as an additional language who arrived late to the school system.
- EPI researchers plan to carry out further work to better understand the factors behind these significant ethnicity gaps and the changes in the gaps over time. While it is likely that poverty is contributing to some of these trends, there is also a need to understand the extent to which other societal and educational factors are creating and worsening inequalities amongst these groups of pupils.
How does the disadvantage gap vary among more vulnerable pupil groups?
For the very first time, EPI researchers have measured the trend in the disadvantage gap for children in the care system (known as ‘looked after children’) and children who are receiving support from children’s services (known as ‘children in need’). These pupils are significantly educationally disadvantaged:
- Looked after children (LAC) are nearly two and a half years (29.0 months) behind their peers by the time they finish their GCSEs. Progress in closing this gap is slow; it has reduced by only 1 month (3.3%) over the last six years.
- Children in need (CIN) are 20 months behind their peers, while children in need with a Child Protection Plan (typically those who have experienced neglect, or physical, sexual or emotional abuse) are over two years (26 months) behind their peers.
- It is notable that around a quarter of children with a Child Protection Plan do not receive either the Pupil Premium or Looked After Premium from the government. The large gaps among these groups support recent EPI proposals to extend the Looked After Premium to children with Child Protection plans.
Progress in reducing gaps for pupils with Special Educational Needs and Disabilities (SEND) has begun to slow since 2015, particularly for pupils with greater needs:
- Pupils with SEND who have an Education, Health and Care Plan (typically those with greater needs) are well over three years (41.1 months) behind their peers at the end of secondary school, while those with SEND without an EHCP are two full years (24.4 months) behind their peers.
_____________________________________________________________________________________________
Additional documents and resources
Geographical analysis pack: disadvantage gap breakdowns including by local authority and parliamentary constituency.
Disadvantage gap data: an interactive version of the geographical breakdowns, with downloadable data tables.
Infographic: A visualisation of the key findings from the report
Technical Appendix
The methodology used for this year’s report set out in full
This report is published in partnership with the Fair Education Alliance (FEA) and Unbound Philanthropy

![]()