Summary
- Expenditure on ‘back-office’ functions (administrative and clerical staff, administrative supplies, and bought in professional services) is the third largest source of expenditure for schools after teachers and education support staff.
- Reported school expenditure increased by 59 per cent between 2002-03 and 2009-10 and had doubled by 2016-17, reaching an average of £590 per pupil in that year.[1]
- On average, academies are spending more per pupil on ‘back-office’ functions than local authority maintained schools though in this analysis we do not include all administrative expenditure by the local authority.
- Larger academy trusts are spending more per pupil than smaller trusts, raising questions about trusts achieving economies of scale. After controlling for other characteristics primary academies in the largest trusts spend £216 per pupil more than those in small trusts, amongst secondary academies the difference is £141.
Discussion
So far in this series we have focused analysis of school expenditure on the ‘front-line’ delivery of education, including how schools spend money on teachers and teaching assistants. In this analysis we look at what might be defined as ‘back-office’ functions.
The term perhaps carries somewhat negative connotations; an area of expenditure to be minimised in order that it can instead be spent on those directly delivering education. But it is also the case that expenditure in this area can improve overall efficiency and outcomes, or free up teacher and leader time to focus on learning – for example . through employment of school business professionals.
We define ‘back-office’ as administrative and clerical staff; administrative supplies; and bought in professional services (such as finance, personnel, and legal services).
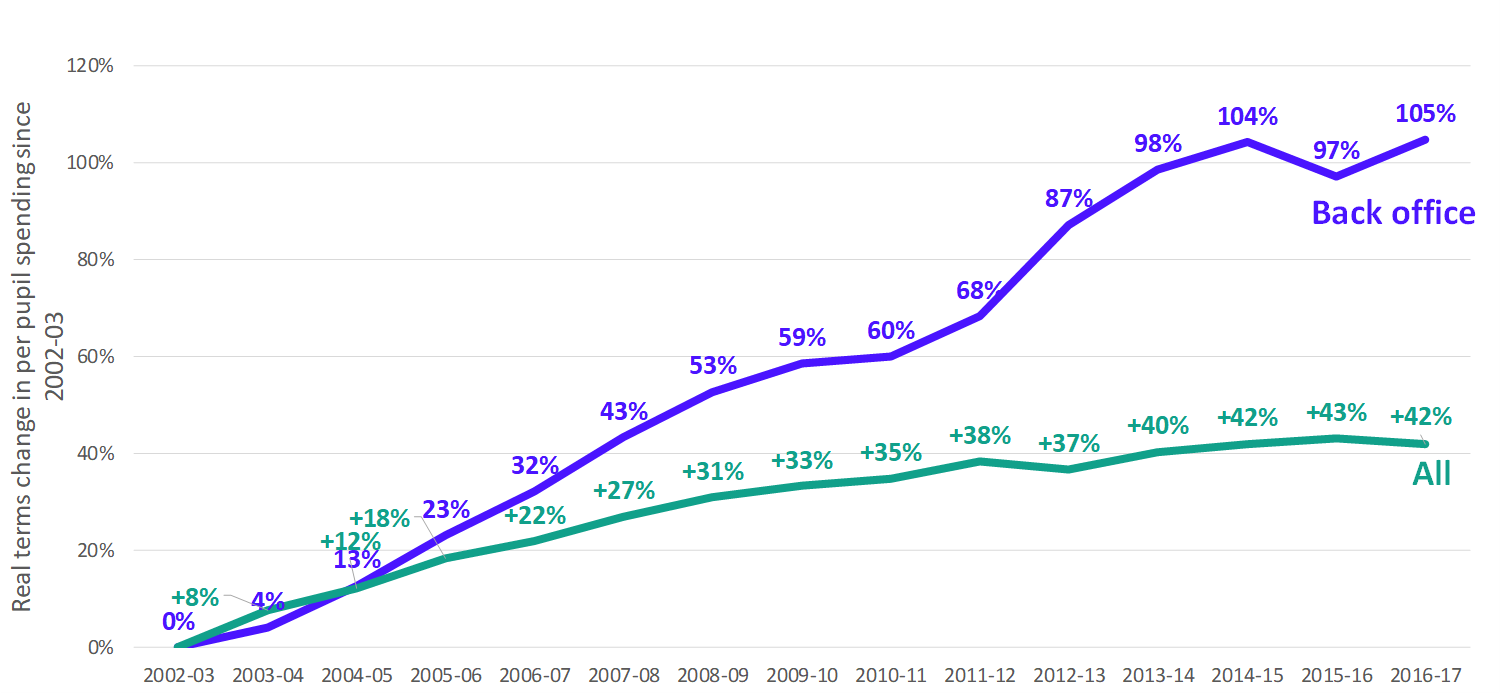
Taken together these sources of expenditure represent the third largest area of expenditure, after teaching staff and education support staff, averaging £590 per pupil in 2016-17. Expenditure on back-office functions has increased considerably since 2002-03. Figure 1 shows that between 2002-03 and 2016-17, per pupil expenditure on back-office more than doubled in real terms (up 105 per cent). This rate of increase is more than double the overall rate of increase in school expenditure.
However, the expenditure data for local authority maintained schools does not include services provided by the local authority unless they were purchased directly by the school (e.g. it does not include services delivered by local authorities using money that has been top sliced from schools). Therefore, some of the changes after the rapid rise in the number of academies post-2010 may be attributed to a change in reporting – i.e. the spending being reported against individual academies or academy trusts even if the total spending is the same.
Figure 1: Real terms change in per pupil spend on back-office functions and across all expenditure from 2002-03 to 2016-17 [2]
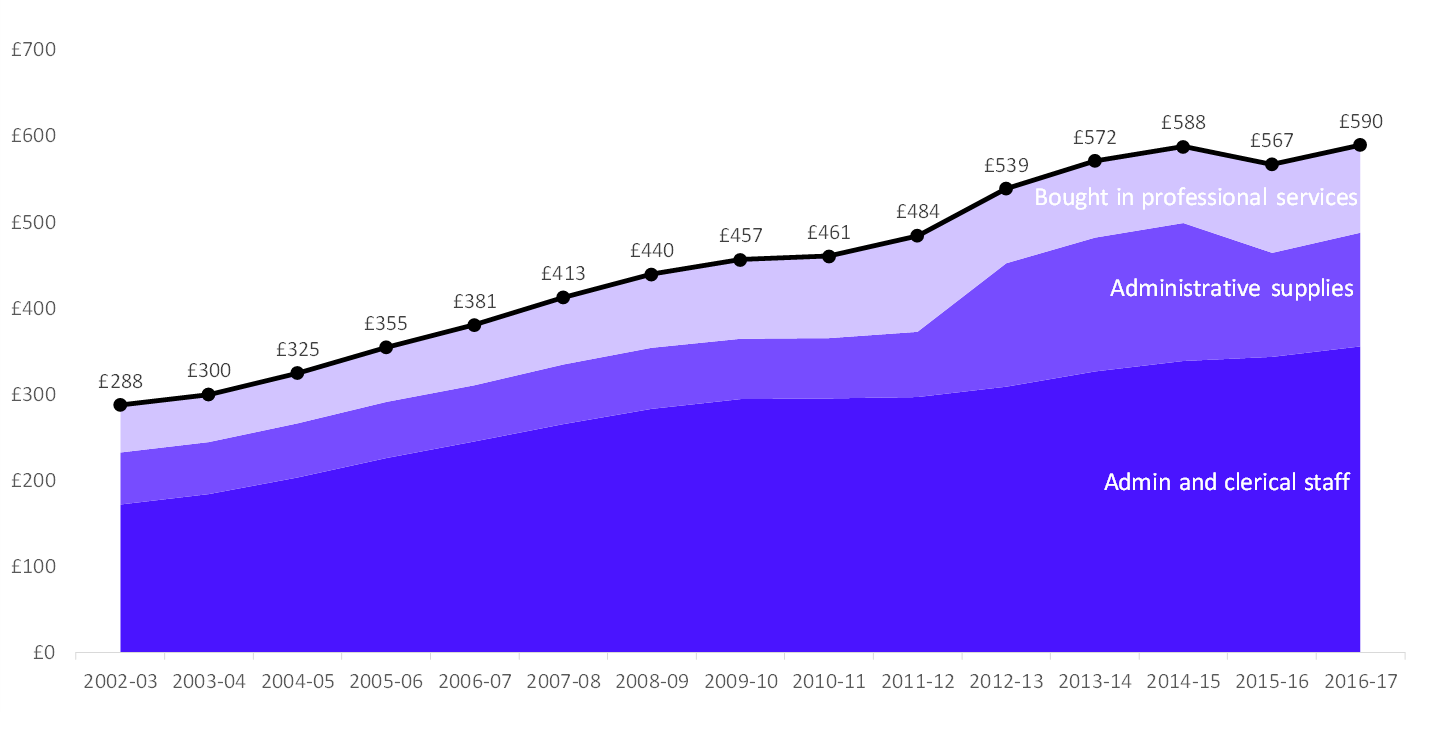
Expenditure on administrative and clerical staff represents about 60 per cent of back-office expenditure, a proportion that has remained largely consistent as expenditure has grown. Figure 2 shows the growth in each area of expenditure. Note that while there are big shifts between 2011-12 and 2012-13 this point represents a change in how the data was collated and so does not necessarily truly represent such a large year-on-year change in expenditure patterns.
Figure 2: Per pupil spend on back-office functions by type of expenditure, 2002-03 to 2016-17 (2016-17 prices)
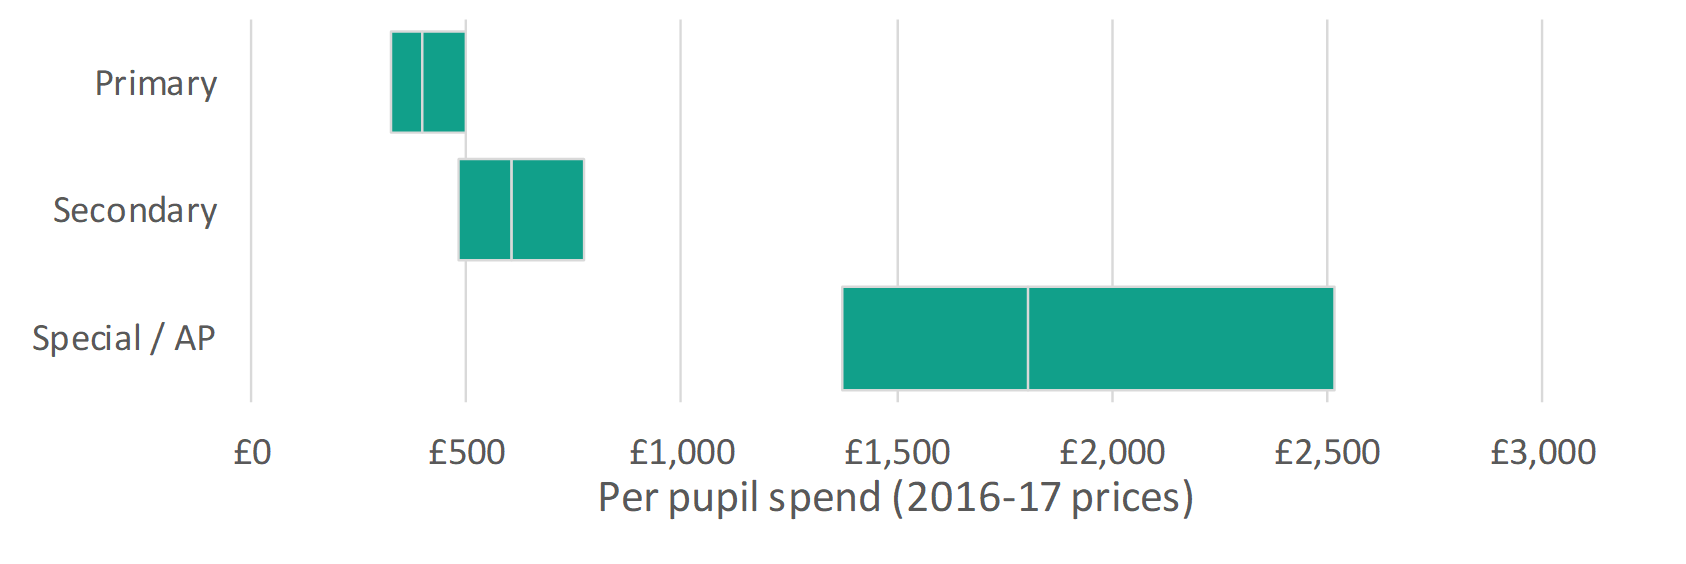
In 2016-17 the median expenditure amongst our sample of primary schools was £400 compared with £605 in secondary schools and £1,805 in special schools.[3] In Figure 3 we show the distribution of this per pupil expenditure by school phase in 2016-17. As with our previous analysis with education support staff, note the difference between the high spenders (those at the top quartile) and the lower spenders (those at the bottom quartile). In 2016-17, high spending primary schools spent 55 per cent more per pupil than low spending primary schools on back-office functions and high spending secondary schools spent 61 per cent more per pupil that low spending secondary schools
Figure 3: per pupil expenditure (lower quartile, median, upper quartile) on back-office functions in 2016-17
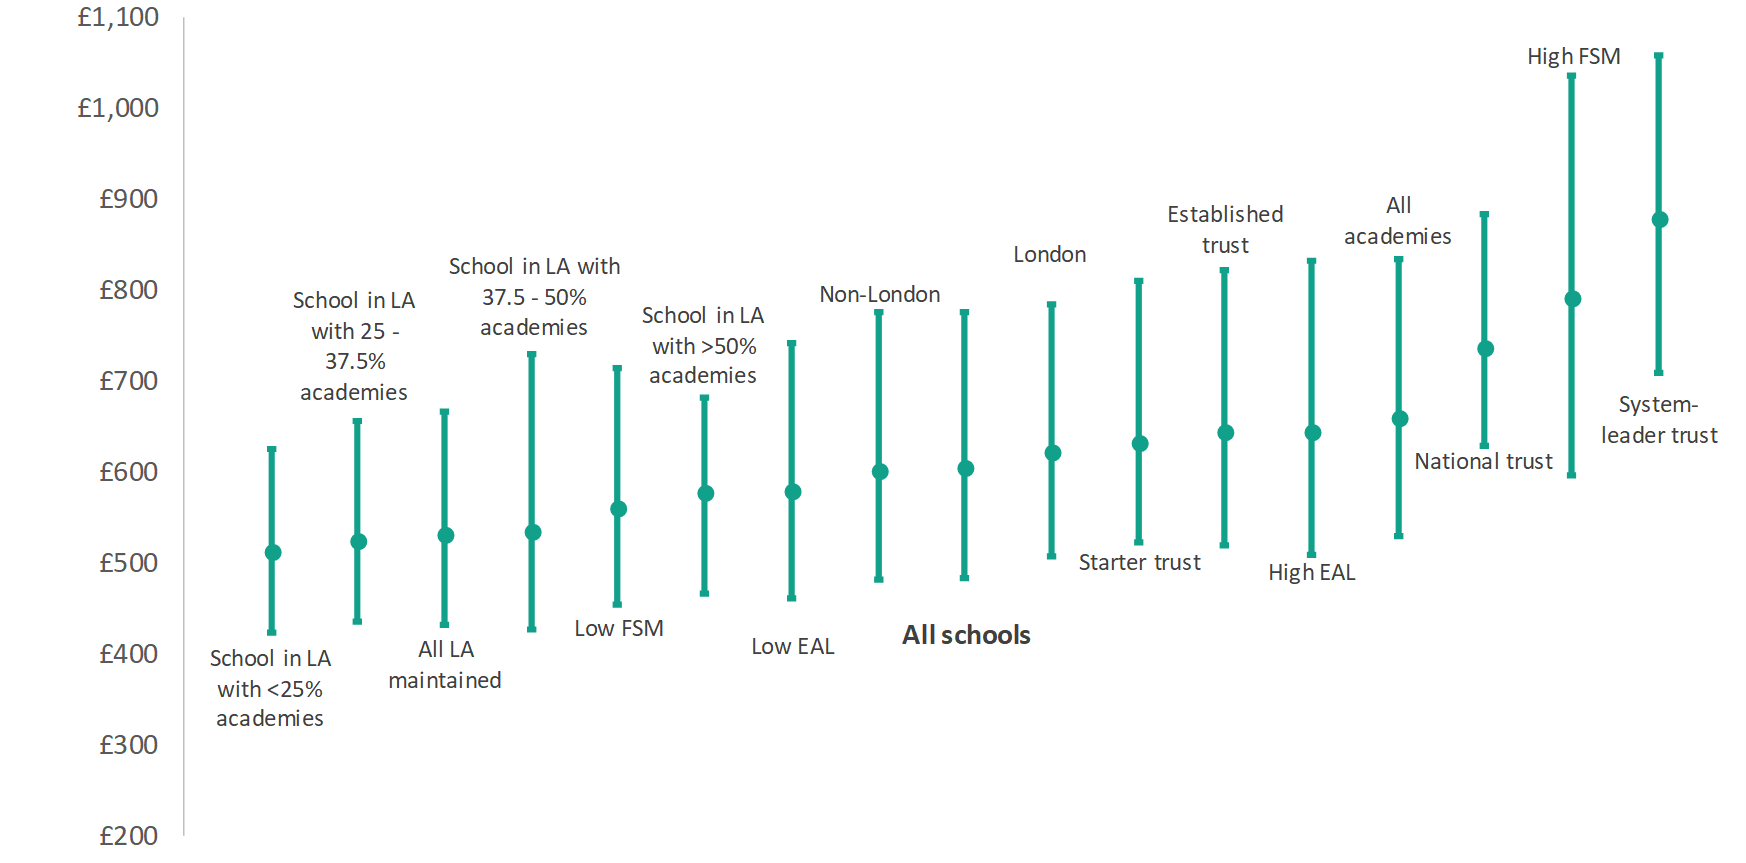
Some of these differences relate to the characteristics of the school. When we examined expenditure on teachers and on teaching assistants, we tended to see the largest differences in average expenditure when we compared schools with low proportions of pupils eligible for free school meals and schools with high proportions of pupils eligible for free school meals. When we examine expenditure on back-office functions, governance arrangements appear to be an important factor. In Figure 4 (primary) and Figure 5 (secondary) we group schools by a range of characteristics and plot the median per pupil expenditure within that group alongside the upper and lower quartiles.
We find that:
- Overall, local authority maintained schools appear to spend less, per pupil, than academies on back-office functions. In primary schools the median per pupil expenditure for local authority maintained schools was £379 and for academies it was £548. Amongst secondary schools the median per pupil expenditure for local authority maintained schools was £530 and amongst academies it was £659.
- This means that academies are spending, on average, 44 per cent more per pupil on back-office functions in primary schools and 24 per cent more per pupil in secondary schools.
This comparison between academies and local authority maintained schools comes with an important caveat however. This is expenditure incurred by the school itself – whether that is through individuals employed by the school or from services purchased from the local authority or other providers. We cannot see from these data the size of any top slice from the schools budget for the local authority to provide services – which are then not accounted for in the detailed breakdowns.[4] So it is difficult to draw comparisons with the total cost between these two groups.
Figures 4 and 5 also highlight interesting differences within the academies group, in which academies in system leader trusts (the largest trusts) spend the most, on average, on back-office functions. In fact:
- In primary academies, those in system leader trusts had a median expenditure of £761, compared with a median expenditure of £515 amongst starter trusts.
- In secondary academies, those in system leader trusts had a median expenditure of £878, compared with a median expenditure of £632 amongst starter trusts.
Figure 4: Median expenditure on back-office functions (vertical bars show upper and lower quartiles) – primary
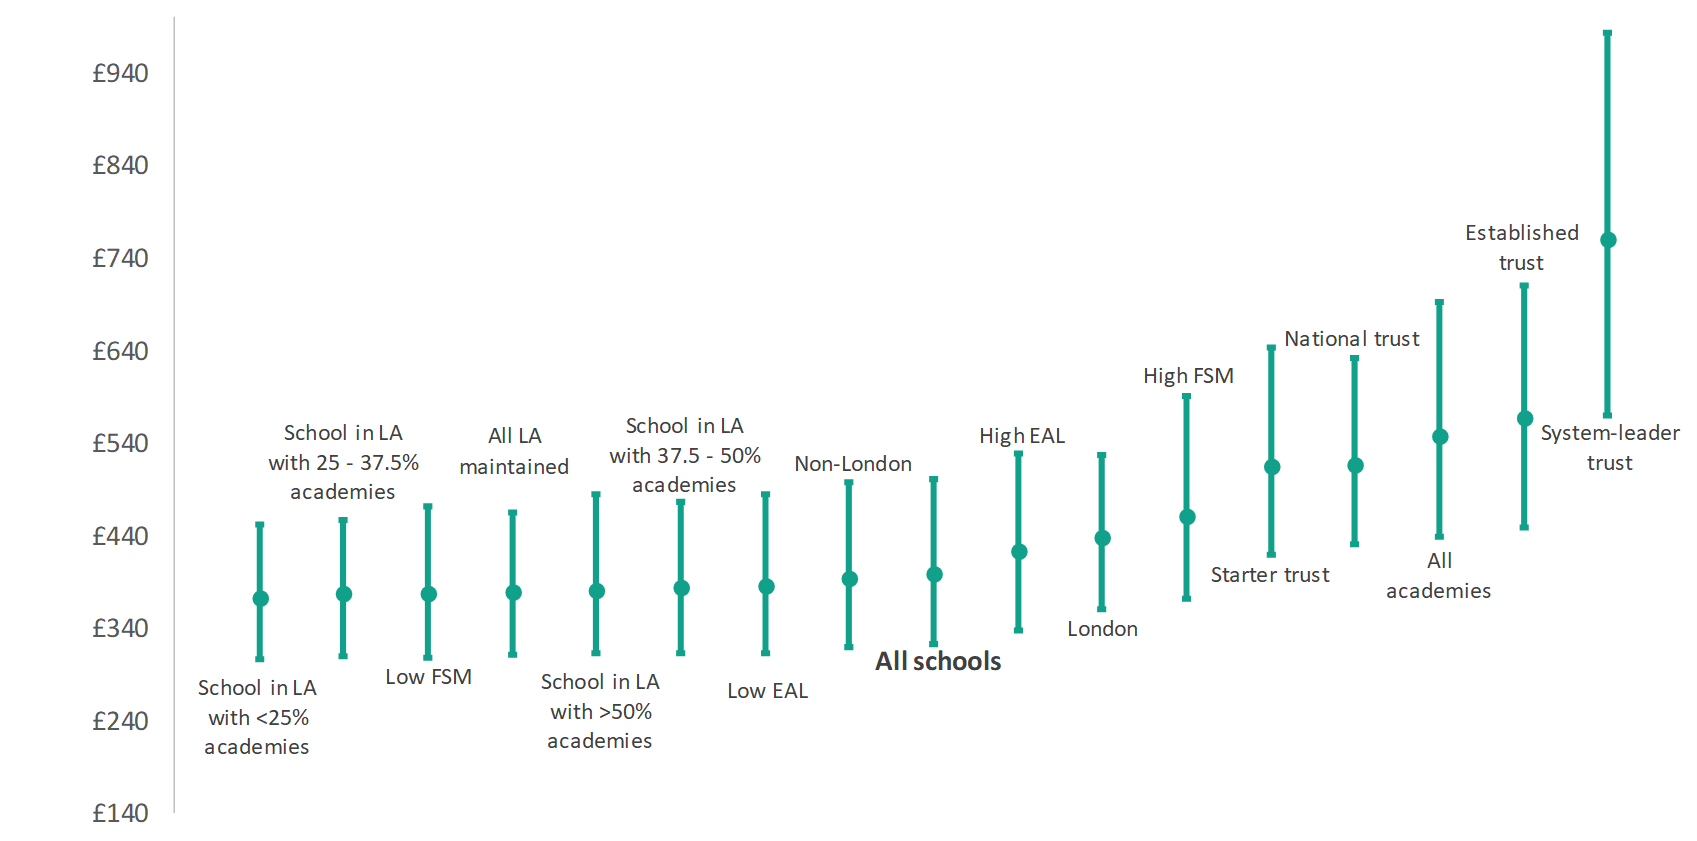
Figure 5: Median expenditure on back-office functions (vertical bars show upper and lower quartiles) – secondary
So, academies in system leader trusts are spending around 40 per cent more (secondaries) and 50 per cent more (primaries) than academies in the smallest academy trusts on back-office functions. These smaller trusts are, in turn, spending more than local authority maintained schools – though that comes with the caveat above.
But we know that the characteristics of schools in large trusts are often different from other schools. They have disproportionately higher levels of disadvantage, special educational needs and disabilities, and more pupils for whom English as an additional language, all things associated on their own with higher expenditure on back-office functions.
In Figure 6 we present a simple regression model which attempts to isolate the effects of individual characteristics having controlled for the other factors in the model. Even after doing this there appears to be a clear relationship between expenditure on back-office functions and the size of the academy trust.
Figure 6: Regression of per pupil spend on back-office functions by characteristics [5]
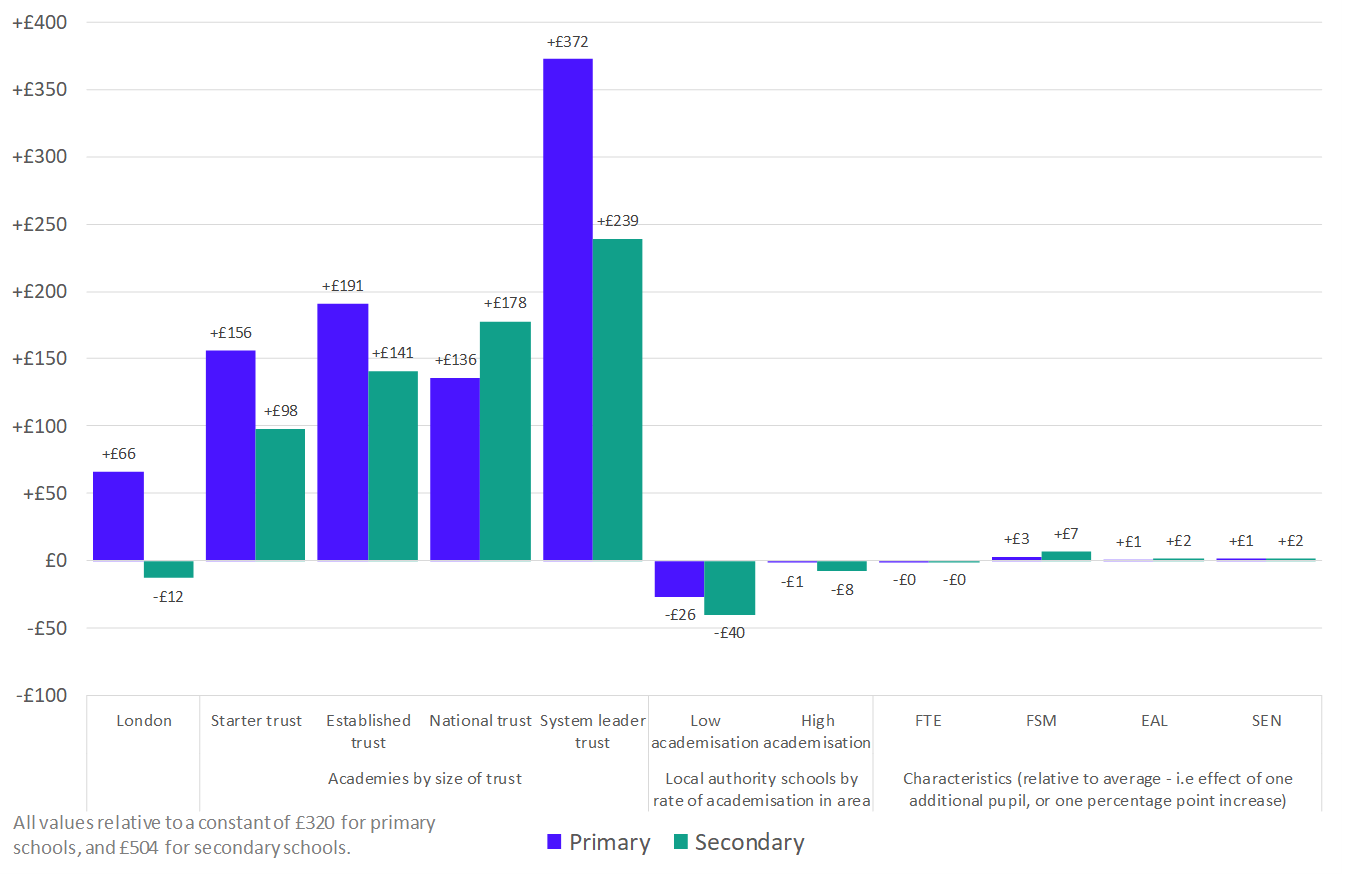
This is a fairly simple analysis and is not designed to prove causality, but it does raise questions as to why these larger groups of schools appear to be spending more on back-office functions than other schools, when you might hypothesise that they should yield savings through economies of scale.
The first thing to consider is the extent to which such efficiencies can actually be realised – i.e. what difference does having more pupils make to per pupil expenditure? The outputs in Figure 6 suggest that number of pupils (FTE) makes very little difference to how much you spend (per pupil) on back-office functions.
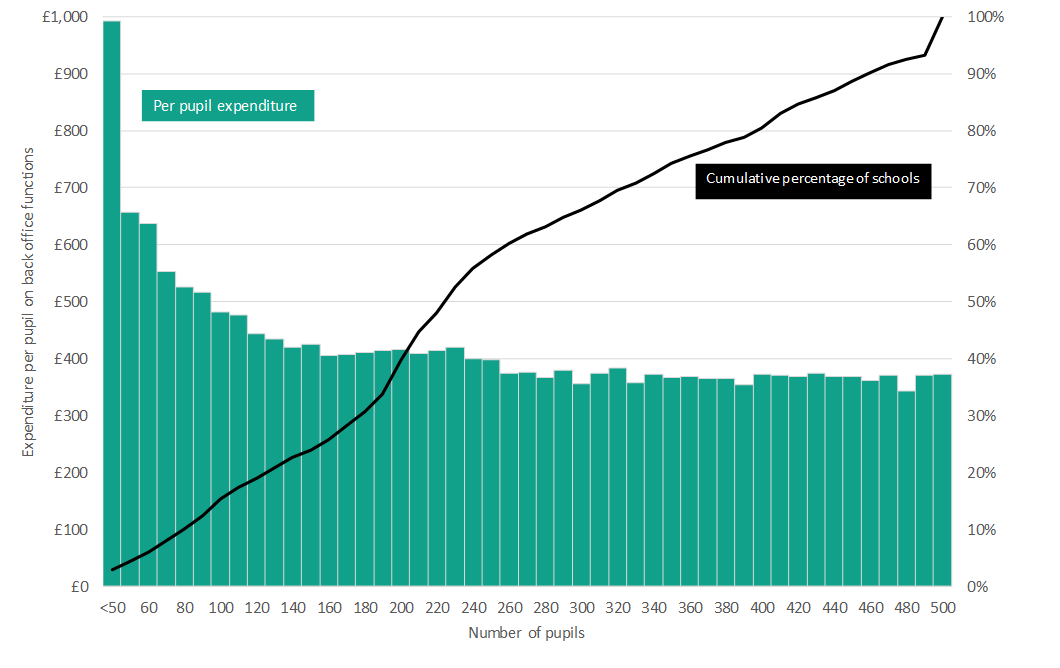
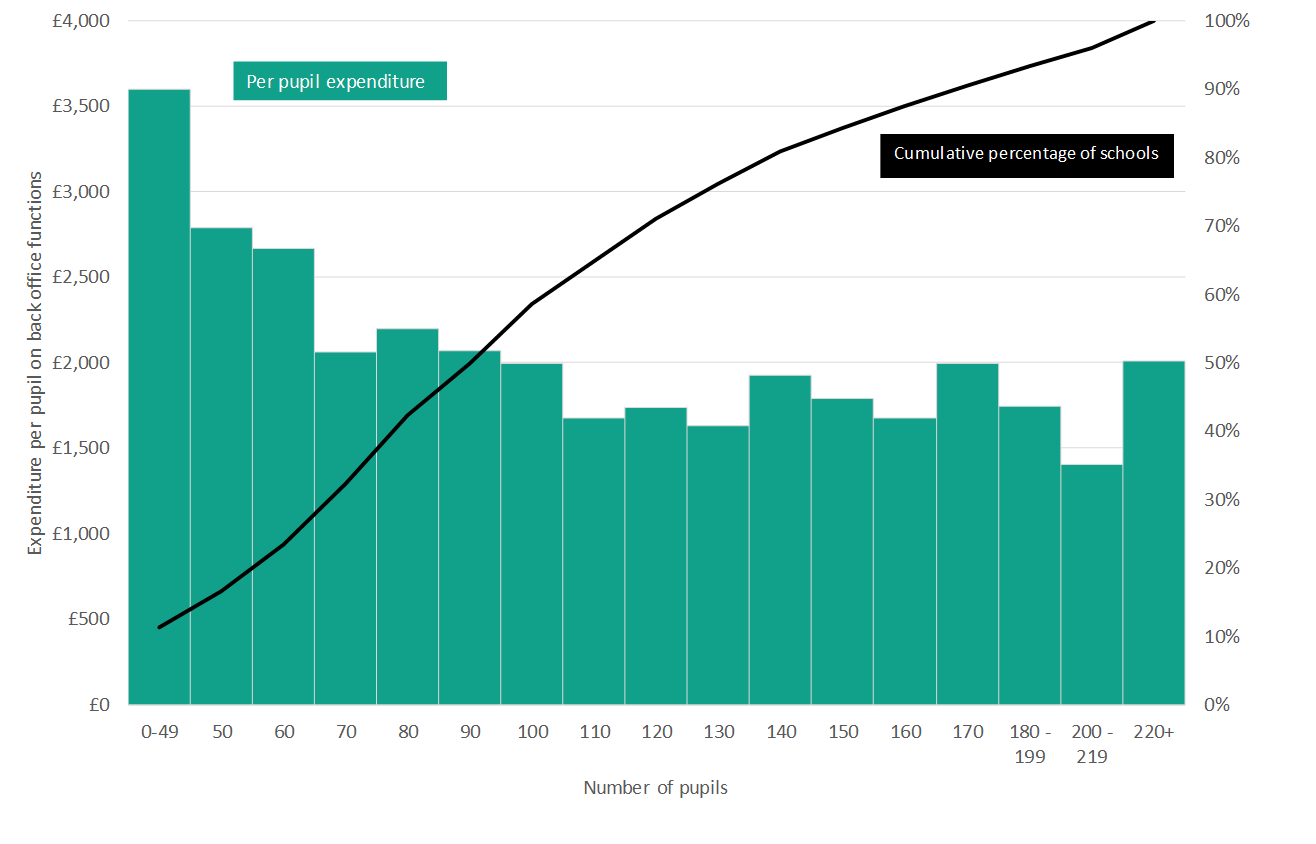
To look at that in more detail we examine how per pupil expenditure on back-office functions varies by the number of pupils in the school. In Figure 7 we group schools by the number of pupils and show the average per pupil expenditure on back-office functions. We have restricted analysis to local authority maintained schools only to take away at least one source of variation in expenditure.
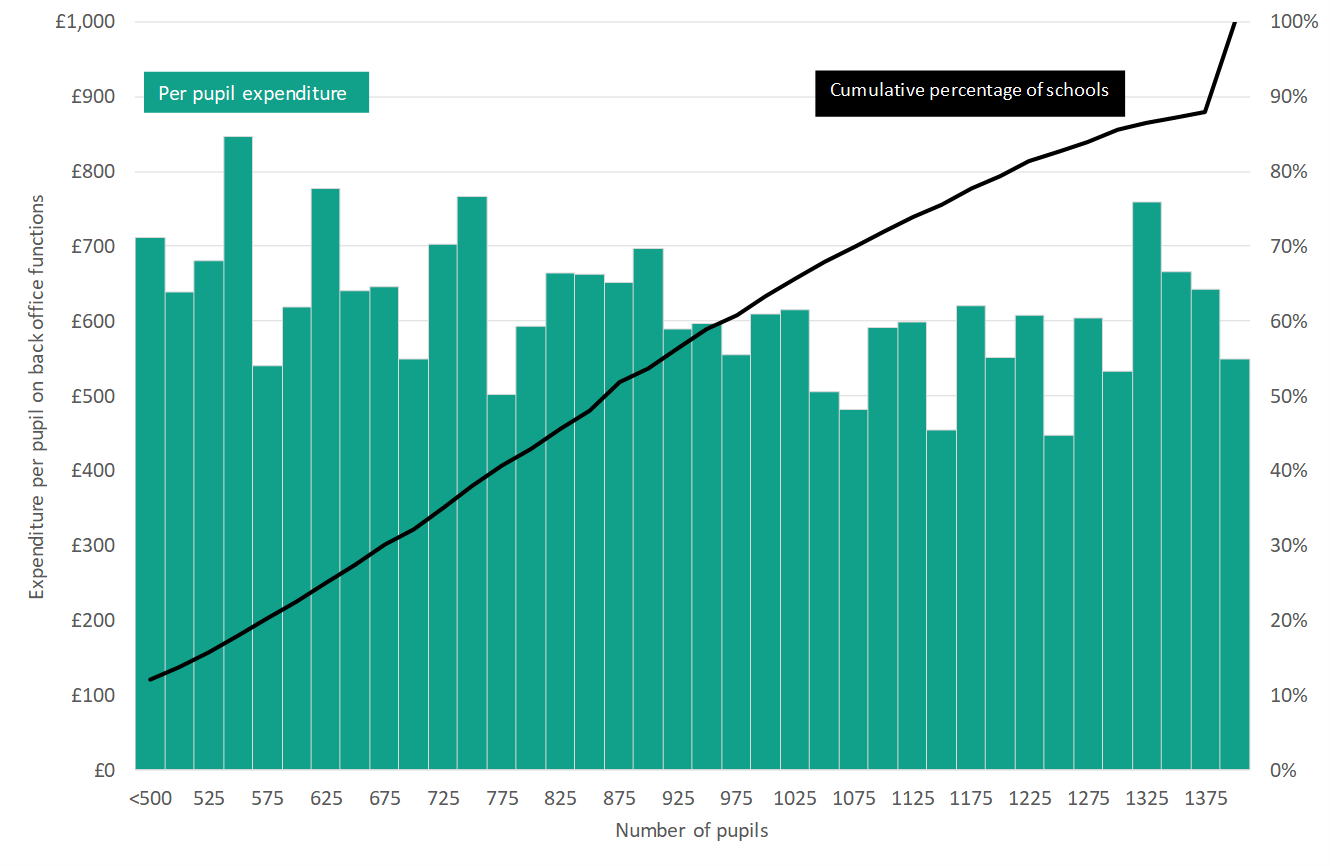
The relationship is most clear in primary schools. Moving from a very small school (fewer than 100 pupils) to simply small (around 200 pupils) leads to a noticeable reduction in per pupil expenditure. Moving then to an average size primary school does not appear to save much more by way of expenditure, become larger still and the savings appear negligible. There does appear to be a continued downward trend in secondary and special schools as the number of pupils increases, but even here, large reductions would require considerable increases in pupil numbers.
Figure 7: Average per pupil expenditure on back-office functions by size of school in local authority maintained primary (top), secondary (middle), and special (bottom) schools 2016-17
So overall, joining with more schools to create higher pupil numbers does not seem to be associated with reducing per pupil expenditure on back-office functions.
That is not to say that they are not achieving more with that money, we simply cannot tell from the data alone. For example, these schools may be employing school business professionals who may be identifying longer term efficiencies and savings or freeing up teacher time.
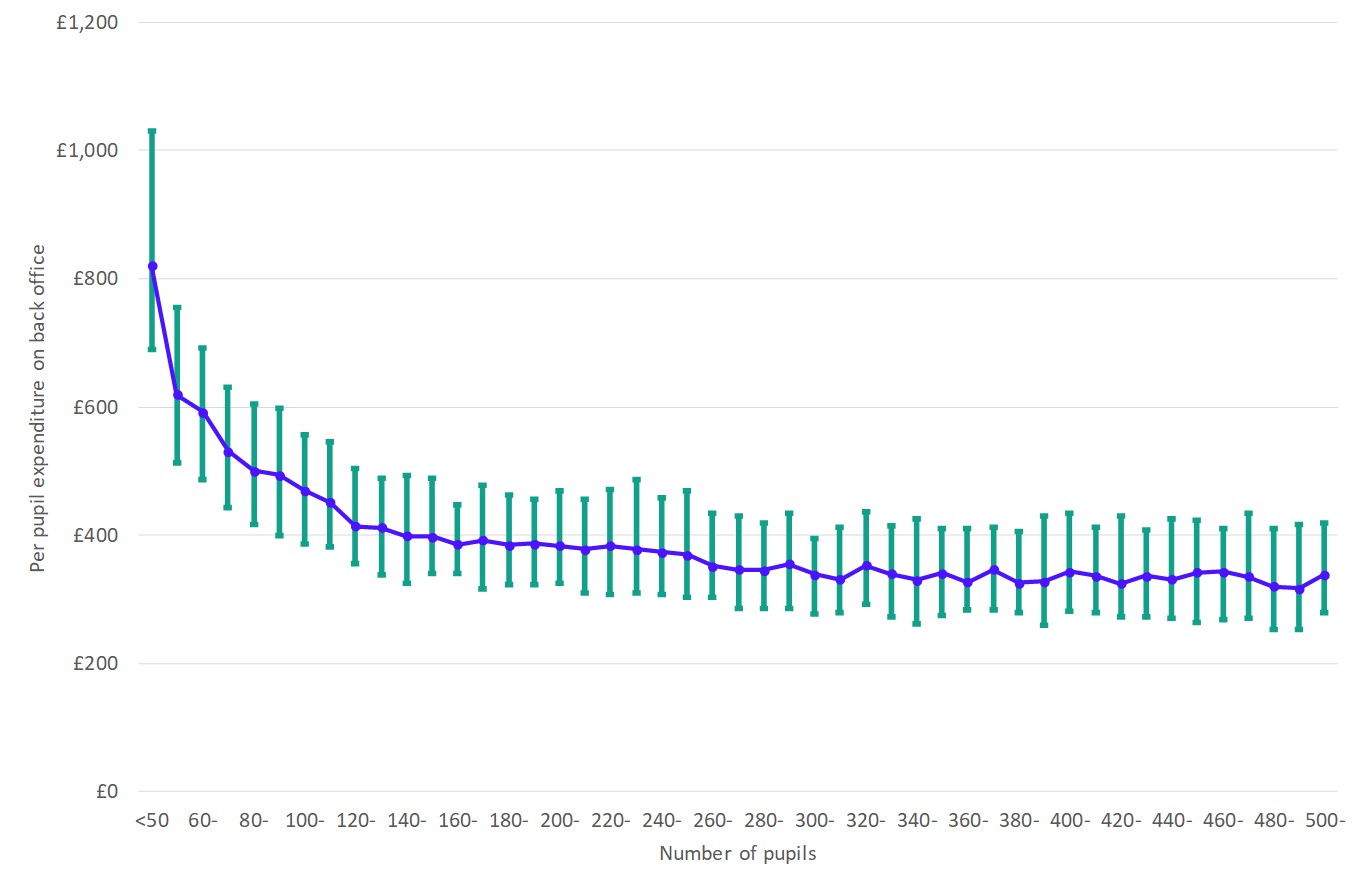
What we do know is that again these simple averages are masking a range of spending decisions within schools. In Figure 8 we repeat the spend per pupil in local authority maintained primary schools and this time show the range of expenditure within each group. So, even amongst schools of similar sizes, the amount spent on back-office functions varies considerably.
Figure 8: Lower quartile, median, and upper quartile per pupil expenditure on back-office functions by size of school – local authority maintained primary schools
Conclusion
By 2016-17 schools in England were spending nearly £600 per pupil on ‘back-office’ functions, an amount that has doubled in real terms since 2016-17.
Since 2010, there has been a considerable focus on school autonomy with the rapid expansion of the academies and free schools programme and the potential to achieve economies of scale in large multi-academy trusts.
What we have found here is that the largest academy trusts are actually spending more than smaller trusts even after controlling for other school characteristics. This raises questions about whether economies of scale are being realised or indeed whether they can be – simple descriptive statistics show that there is very little difference between small and very large primary schools in terms of per pupil expenditure on back-office functions for example.
What we cannot see from this analysis is whether this larger spending represents value for money. We cannot see for example, its impact on teaching and learning and ultimately pupil outcomes. As with other areas of expenditure, how that money is being spent may be far more important than the overall level of expenditure. There would clearly be merit in a more detailed examination of the way that trusts and individual schools are operating in order to properly understand the relative efficiency of different approaches.
[1] As we explain later in this analysis, we have not included local authority level expenditure on administrative functions in this analysis. Therefore, some of the increases seen after the increase in the number of academies from 2010 may reflect reporting changes rather than changes in overall spending.
[2] DfE, ‘Trends in school spending 2002-03 to 2016-17’, August 2018 https://www.gov.uk/government/publications/trends-in-school-spending-2002-to-2016
[3] As with the earlier analysis in this series, expenditure by school characteristics is based on a school level dataset constructed from the schools Consistent Financial Reporting and Academies Accounts Return, looking at expenditure in 2002-03, 2009-10 and 2016-17. Because of the incompleteness of these datasets it has only been possible to do this for a subset of schools – just over half of all primary and secondary schools and about two-thirds of special schools. As such, the results are not directly comparable from the national level results and should be treated with caution, but we believe they reflect the broad underlying patterns. The datasets are missing expenditure data for administrative and clerical staff for nearly all schools other than in 2016-17. Therefore, we have not been able to draw comparisons over time for anything other than headline, all schools, figures.
[4]For further analysis that does consider the size of top-slices taken by local authorities see Peter Davies, Colin Diamond and Thomas Perry, ‘Implications of autonomy and networks for costs and inclusion: comparing patterns of school spending under different governance systems’, November 2019. They still find that academies spend proportionately more on back-office functions than local authority maintained schools.
[5] All values relative to a constant of £320 for primary schools, and £504 for secondary schools. Base case is a local authority school in an area where 25-50% of pupils are in academies. Average percentages per characteristics (primary / secondary): FSM 14.1% /1 2.9%; EAL 13.5%/12.4%; SEND 20.6%/16.2%