EPI’s Jon Andrews and Robbie Cruikshanks explore 2022’s GCSE results.
It may feel like we’re back to normal, but pupils’ school experience has been anything but
With much of the discussion in the run up to the release of GCSE results focused on the fact that these are the first set of summer exams since 2019, it is tempting to believe that we have now returned to normality. But, for students receiving GCSE results, the path to this point has been anything but normal. For most, the last time they had a school year that wasn’t affected in some way by the pandemic was when they were in year 8, with national lockdowns during year 9 and year 10, as well as ongoing high pupil and staff absences a likely feature of their time in year 11. Evidence on the impact of the pandemic on pupil outcomes – or learning loss – is limited for this cohort, as the availability of data has meant that research has tended to focus on younger pupils. But such research has highlighted learning loss persisting into the 2021/22 academic year and disparities by both pupil characteristics and between different areas of the country.
The government and the qualifications regulator, Ofqual, set out a number of measures to mitigate the effects of the disruption, with changes to both exam and non-exam assessment. These included optional topics and content in English literature, history, ancient history, and geography; advance notification as to the focus of examinations in all other GCSE subjects; providing formula sheets in exams; and changes to fieldwork and practical activity.
The results come after two years of no summer series of examinations, and the use of centre and teacher assessed grades for GCSEs which led to an increase in average grades
As we have argued before, some grade increases were inevitable. Even in a perfectly moderated system, the issue of the benefit of the doubt, or what a pupil is capable of achieving, would naturally lead to an increase in outcomes. Imagine two very similar students working at the borderline of a grade 3 and 4. In a normal year, we might expect one of them to fall just below the threshold in the exam – not quite the perfect question for them, not their best answer, distracted by something outside of the exam entirely. But the teacher, using professional judgement, cannot distinguish between them, and they both get the higher grade.
What we saw was a noticeable shift in grades between 2019 and 2021, with the proportion of entries amongst 16 year-olds being awarded a grade 4 or above increasing from 70 per cent to 79 per cent. In 2021, the average grade awarded across all GCSE subjects was 5.2 – an increase of 0.6 from 2019, just over half a grade. The increase mattered, but it was perhaps more modest than some of the discourse around “grade inflation” would suggest.
The inevitable question for government and Ofqual was then what to do with grades in 2022 and beyond? There were three options available:
- accept the current grade distribution as the “new normal”;
- return immediately to the 2019 distribution, viewing 2020 and 2021 as very specific to the use of centre and teacher assessed grades;
- aim to return to the 2019 distribution but do so over multiple years.
We will not revisit the arguments for and against each of these approaches here. This was a problem to which there was no perfect solution, but we felt that the third provided the fairest approach across different cohorts while recognising that this year’s cohort have seen their education disrupted by the pandemic.
In September 2021, Ofqual confirmed that they would adopt this approach when they set out how the grade distribution would be set in 2022. In short, grades in 2022 would be at a midpoint of those in 2019 and 2021. While nothing is confirmed beyond this year, the intention would then be to return to 2019 levels in 2023. This does not mean that results will necessarily be exactly at the mid-point of the two years. There is still a professional judgement in setting grade boundaries and ultimately, if two pupils get the same mark, they have to be awarded the same grade – so on a purely practical level it may have proved difficult to be precise.
All of this means that we expect results to be lower than last year, and we know roughly how much lower. We will provide some analysis of those headline figures (such as the proportion getting grade 4 or above) but as they are broadly fixed by the decision to gradually return to a 2019 type distribution, they do not tell us anything about changes in overall standards or learning loss in the pandemic.
There will be things worth looking out for in the various statistical publications that will be released alongside results. We expect Ofqual to publish the results of the National Reference Test (NRT) in English and mathematics, which are sat by a representative sample of year 11 students. The NRT provides a consistent measure over time for older pupils, with analysis published later last year suggesting outcomes in English had held steady but there had been falls in mathematics.
There will also be results published for different areas of the country. Our work on the impact of the pandemic found its effects more acutely felt in parts of the north and midlands than in London, and last week’s A level results showed a widening gap between London and the south east and the rest of the country. No doubt there will also be interest in the results of independent schools where there were large increase in the proportion of pupils achieving grade 7+ or above over the last two years – but as John Jerrim argues, it’s important to set these differences within the context of relative changes.
We will be adding our own number crunching and analysis throughout the day. Sadly, we cannot quantify and fully reflect the sheer amount of effort and resilience it has taken from students, parents and carers, and school and college staff to get through the turbulence of the last two years to this point. We wish you all the very best as results are opened.
Headline results are lower than last year by design
Data note: Where possible, the results we refer to will relate to 16-year-old pupils in England. This is because this most closely aligns with our normal measures of GCSE performance that relate to pupils at the end of Key Stage 4 in England. However, there are some occasions where the availability of data means we will use statistics relating to all entries in England (i.e. including other ages). This leads to slight differences in the measures.
As expected, GCSE results this year were between the highs of 2021 and those of 2019 when there was last a summer exam series, though slightly closer to 2021. Overall, amongst 16-year-olds in England 75.3 per cent of all awards were at grade 4 or above, this is 3.8 percentage points lower than in 2021 but still 5.4 percentage points higher than in 2019. At the higher end of the distribution, 27.0 per cent of all awards were at grade 7 or above, this is 3 percentage points lower than in 2021 but still 5.2 percentage points higher than in 2019.
Figure 1: This chart shows the grade distribution across all GCSE subjects in England. As expected, the distribution sits somewhere between 2019 and 2021, though it is slightly closer to 2021.

Figure 2: The proportion achieving each grade or above is different from 2019 at all points of the attainment distribution. It illustrates again how the approach to grading this year has attempted to begin to reverse the increases seen in 2020 and 2021.
Overall, the average grade awarded to 16-year-olds in England this year was 5.0. This is down from 5.2 in 2021 but still above the average grade of 4.8 from 2019.
A better way to track performance over time is to look at the results from the National Reference Test in English and mathematics taken by a representative sample of year 11 pupils. As with results last year, it suggests that outcomes in English have actually held up despite the disruption of the pandemic with no statistically significant change in outcomes. However, there has been a statistically significant decline in mathematics performance at all grades. It is difficult to draw direct comparisons with assessments earlier for younger pupils, but our own analysis of learning loss during the pandemic suggested bigger losses in mathematics than in reading (though other studies have illustrated learning losses in writing).
The subjects that saw the biggest increases in the last two years have, inevitably, seen the biggest fall in results this year
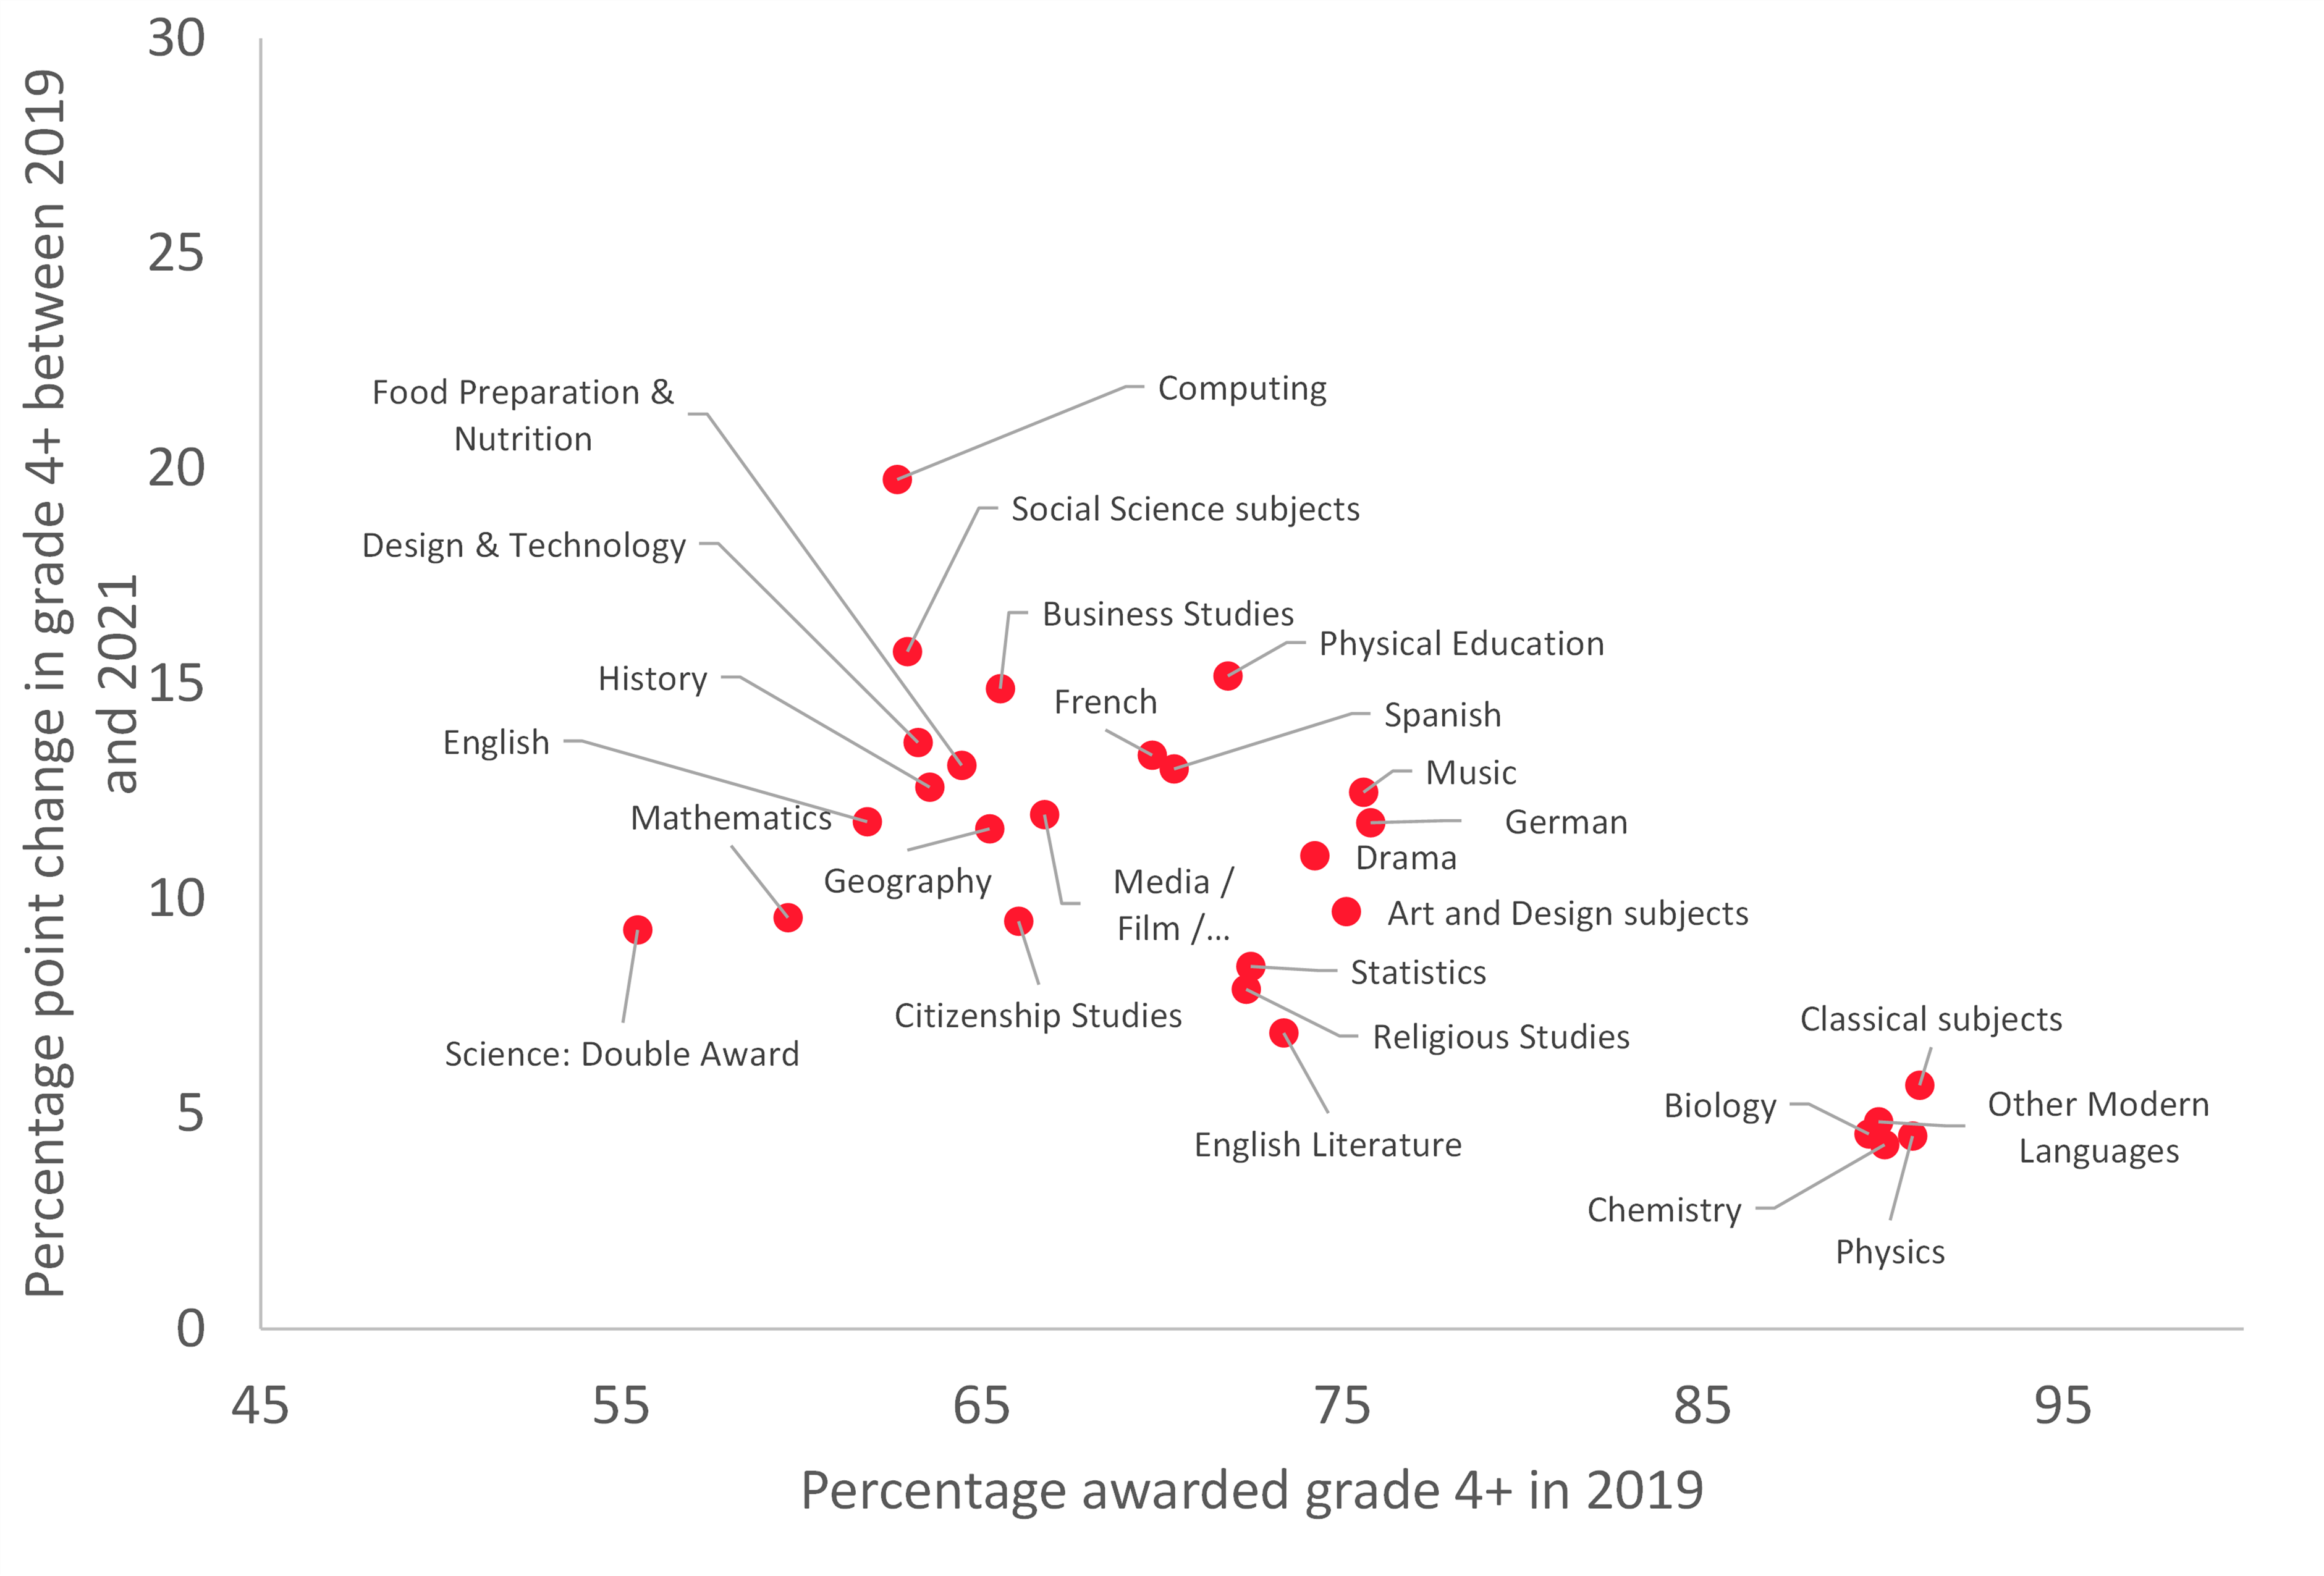
Every subject saw increases in the percentage of pupils awarded a grade 4 or above between 2019 and 2021, but these increases were not uniform. Unsurprisingly, they were generally lowest in subjects with already high attainment, such as the individual sciences where pupils tend to have high prior attainment and the vast majority would be expected to achieve grade 4 or above. The percentage point increases in biology, chemistry and physics were all around five percentage points. The largest increases were seen in computing, social sciences, and physical education where the percentage of pupils awarded grade 4 or above increased by over 15 percentage points.
Figure 3: Changes in the percentage awarded grade 4 or above between 2019 and 2021 was not consistent across subjects.
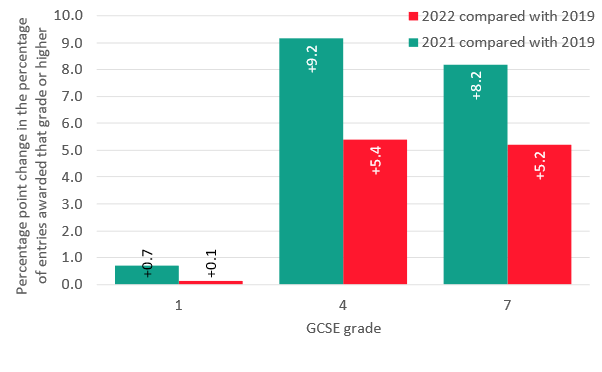
Today’s data shows that those subjects that experienced the largest increases have now experienced the largest falls, with the percentage of pupils awarded grade 4 or above in computing, social sciences and business studies all now over 5 percentage points lower than they were in 2021. Importantly however, all of these subjects are still well above where they were in 2019 and where we might expect them to be in 2023.
Figure 4: Those subjects that had seen the biggest increases in the percentage awarded grade 4 or above between 2019 and 2021 have now seen the largest decreases.

Regional disparities persist, with some indication of differential effects due to the pandemic
There are long standing disparities in the attainment of pupils in different parts of the countries. While regional differences are relatively small compared to, for example, the difference between the highest and lowest performing schools, it was still the case that pupils in the south east and in particular London outperformed pupils elsewhere.
In 2019, pupils in London typically achieved an average GCSE grade of 5.0 while results in the north west, the north east and Yorkshire and the Humber were on average half a grade lower. Analysis of learning loss during the pandemic (which has tended to focus on younger pupils) has also suggested greater learning losses for pupils in the north and in parts of the midlands. Although data is not yet available for regional grade averages in 2022, we can see how regional disparities have developed through the percentage of pupils awarded a grade 7 or higher.
Today’s results show that regional disparities continue with the highest results seen in London and the south east and the lowest results in the north east. But beyond just these raw outcomes it’s important to consider whether this has changed since 2019. We know that overall, results in 2022 are higher than in 2019 but have the increases have not been evenly distributed? We can explore this both through the percentage point gap in achievement, and also an odds ratio of results in 2022 versus results in 2019 for each region – in essence, how much more likely is it that an entry is awarded a grade 7 in 2022 than in 2019. The chart below shows both the raw percentage outcomes and how this translates into an odds ratio. We can see in terms of raw gaps, that the gap between London other regions has widened since 2019. But the changes in the odds are broadly similar across all regions.
It does translate into some stark differences. In London, around a third of grades achieved were at grade 7 or above. In the north and midlands it was under a quarter.
Figure 5: Regional disparities in pupil outcomes have persisted and in raw terms have actually widened slightly. The chances of achieving a grade 7 in London are considerably higher than in the north.

Girls continue to outperform boys, the gap at grade 4 remains the same as it was last year, and narrower than it was in 2019. At grade 7, a narrowing of the gap this year has not been sufficient to unwind two years of increases.
In 2021, 82.5 per cent of entries from girls achieved a grade 4 or above in comparison with 75.6 per cent of entries from boys – the gap between boys and girls narrowed by one percentage point in each of 2020 and 2021. This year, 78.7 per cent of entries from girls achieved a grade 4 or above in comparison with 71.9 per cent of entries from boys. In other words, the gap between boys and girls has remained broadly the same, with the gap only slightly narrowing by 0.1 percentage points in comparison with last year, while it has narrowed by 2.1 percentage points since 2019.
Last year it was a slightly different story amongst the highest attaining, where the gap widened slightly at grade 7 or above. Just over a third of entries from girls (34.5 per cent) and just over a quarter of entries from boys (25.5 per cent) were awarded a grade 7 or above. This gap had increased by just under a percentage point since 2020 and by over two percentage points since 2019. This year 30.7 per cent of entries from girls achieved a grade 7 or above compared to 23.3 per cent of entries from boys. This represents a narrowing of the gap from 2021 by 1.7 percentage points, putting the gap closer to 2019 levels than was seen last year but still wider than when pupils last sat exams.
Figure 6: Girls continue to outperform boys at both grade 4 and above, and grade 7 and above. The gap at grade 4 had narrowed over the last two years and has remained at that level while the gap at grade 7 has narrowed after two years of widening.

For most subjects, the attainment gap between boys and girls has narrowed from 2019 for grade 4 and above, while for grade 7 and above the gap has increased. In other words, girls continue to outperform boys in the vast majority of subjects, and at higher attainment levels girls have outperformed boys to a greater degree than they did in 2019. In 2022, physics is the only subject where boys consistently outperform girls at both grade 4 and grade 7.
Figure 7: The attainment gap between boys and girls at grade 4 and above has narrowed for almost all subjects except for citizenship studies and mathematics. Girls continue to outperform boys in all subjects except physics.

Figure 8: For the highest attaining entries, the gap between girls and boys has increased when compared to 2019 for most subjects. In statistics and physics, where boys outperform girls at grade 7 or above, the gap has narrowed in favour of girls.