Thousands of parents across the country will be immersed in the process of applying for secondary schools for their children, who are due to start Year 7 next year. Many of those parents will have already trudged through open-evenings, head teacher talks, Ofsted reports and school performance data.
And today, two and a half weeks before the 31st October secondary school application deadline, the Department has published new provisional secondary school performance data for 2016. The timing isn’t accidental. These tables have been intentionally published today to help parents to make an informed decision about which school to choose for their child.
But this new data is also important for policy makers and schools themselves. For the first time, all secondary schools will be assessed against a new ‘Progress 8’ measure. Performance against this measure could have significant implications for schools. It is the basis on which Government sets the minimum, or floor, standards that it expects all schools to meet. It will also form part of the new definition of ‘coasting schools’. Underperformance against either of these standards means that the school is eligible for intervention by the Government, which could include becoming a sponsored academy.
What is Progress 8?
Progress 8 is designed to measure how well pupils progress from the beginning to the end of secondary school. The score for each pupil is based on whether their actual GCSE scores are higher or lower than those achieved by pupils who had similar attainment at the end of primary school. It gets its name from the fact that it measures performance across eight subjects, however there are restrictions as to what counts. In order to fill all eight slots pupils will need to have taken GCSEs in English and maths (both of which are double-weighted), three subjects from the English Baccalaureate, and three other GCSEs or approved qualifications
A school’s Progress 8 score is the average score across all pupils and the higher the score, the better a school is deemed to have performed.
The government argues that this is a fairer way of assessing how well secondary schools are performing for two reasons.
Firstly, it measures schools by the value they add to pupils’ achievement, rather than simply the end result (e.g. the old 5 A* to C measure). Secondly, because schools will be judged on the progress of all pupils, these changes also mean that schools will need to focus on pupils across the ability spectrum, not just those who are near to the 5 A* to C grade threshold.
What does this provisional data tell us?
Firstly, it is important to stress that no school will be formally judged against the data published today. Both the floor standard, and the new coasting definition, will be assessed using the revised data published in the Performance Tables in the new year. Individual schools are likely to see revisions to their data by that point and, although the data has been published, we are deliberately not making reference to individual institutions. What we can do is use this provisional data to give a sense of the number of schools that may be captured by these new standards and the extent to which they capture a different set of schools to the old measures.
The floor standard
The Government has already announced that schools will be below the floor if they have a Progress 8 score that is both below -0.5 and significantly below average. A score of -0.5 means that, on average, each pupil achieved half a grade lower in each subject than pupils with similar prior attainment nationally.
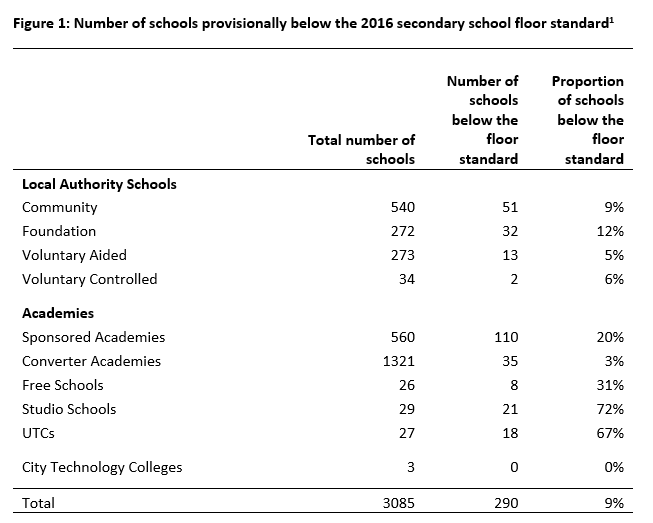
Of the 3,085 state-funded mainstream schools with a Progress 8 score published today, 290 (or 9 per cent) are below this new floor standard. This is slightly lower than the proportion of schools that were below the floor standard in 2014 and in 2015 (around 11% in each year).
This is broken down by type of school below. It is notable that certain types of schools are over represented. For example, a fifth of sponsored academies and over two thirds of Studio Schools and UTCs are below the floor standard. This does not necessarily reflect the performance of these interventions (sponsored academies for example were generally low performing schools prior to conversion) but it does reflect the need for ongoing support and intervention in the academies sector as well as amongst maintained schools.
Coasting schools
The Department for Education has set out its intention to intervene in a further set of schools where, over a three-year period, results have not necessarily been low but pupils have not progressed at the rate that they should. It refers to these as ‘coasting schools’.
The nature of the intervention will be determined by the relevant Regional Schools Commissioner. It is not necessarily the case that all coasting schools will become academies in the way that all inadequate schools do. The Schools Causing Concern Guidance sets out a structured set of conclusions that RSCs might reach on coasting maintained schools:[2]
- no further action if they are convinced the school is supporting its pupils well;
- the school needs some additional support and challenge;
- the governing body of the maintained school should be required to enter into arrangements;
- additional governors or an Interim Executive Board (IEB) are needed; or
- a sponsored academy solution is necessary.
The definition, and the need for intervention, will also apply to schools that are already academies.
This will be the first year in which schools are judged to be coasting. We do not yet have a full definition of what constitutes a coasting school as the DfE have been waiting to assess the 2016 data. To date, what they have announced that a school will be defined as coasting in 2016 if:
- In 2014 and 2015, less than 60% of pupils achieved 5 or more A*-C grades including English and maths at GCSE and the percentage of pupils making expected progress in English was below the national median and the percentage of pupils making expected progress in mathematics was below the national median;[3] and
- It falls below a new level set against the progress 8 measure in 2016. We do know that this level will be above the absolute floor standard of – 0.5.
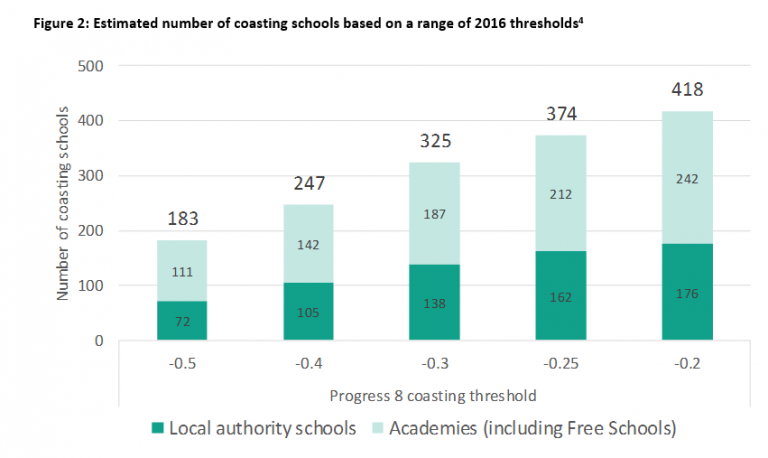
This is an interim measure. Over time, all three years will be based on Progress 8. For now, we’ve attempted to estimate the number of schools that will be defined as coasting using a variety of different thresholds for the 2016 element of performance, moving from the floor standard of -0.5, through to -0.2.
In Figure 2 we show the number of schools that were below the minimum standards for 2014 and 2015 that are then below each Progress 8 cut-off in 2016. It shows that if DfE were to set the threshold at -0.4, just under 250 schools would be defined as being coasting. If, however they set it at -0.2 the total would be over 400. It is worth remembering that many of the schools captured under the coasting definition are also below the floor standard. This analysis shows that there are 183 schools that have a score of below -0.5 in 2016 that were also below minimum standards in 2014 and 2015.
Do the new measures capture different schools?
Given that Progress 8 should provide a fairer assessment of school performance than attainment alone, we might expect to see a change in the characteristics of schools judged to be below minimum standards. Historically, floor standards have disproportionately captured schools with high levels of disadvantage as these pupils tend to have lower prior attainment and go on to achieve worse outcomes at GCSE.
In Figure 3 we consider the proportion of schools below the floor or coasting by level of disadvantage in the school (proportion of pupils eligible for free school meals). We see that such bias still exists – i.e. a school with above average levels of disadvantage is still more likely to be below the floor standard – but the disparity is reduced.
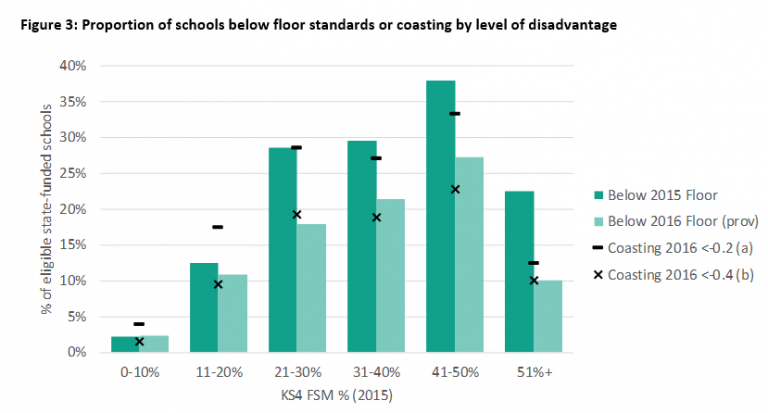
Looking at the 2015 floor standard:
- a school with between 11-20% FSM (around average) would have had a 12% chance of being below the floor;
- a school with between 31-40% FSM (around average) would have had a 30% chance of being below the floor.
Using the 2016 standard, this was largely unchanged for the low FSM group (at around 11%) but had fallen to 20% in the high FSM group.
It is the distribution of schools labelled as coasting that should be most concerning for Government as this was a measure introduced to capture schools in “leafy areas with more advantages”.[5] Yet it is clear that schools are far more likely to be labelled as coasting if they have rates of disadvantage that are above average. In the short term this is not surprising, the interim measures using attainment in 2014 and 2015 are strongly correlated with levels of deprivation. Over time it will be important to develop the coasting schools measures so as to truly meet the policy intention.
[1] Consistent with Performance Tables, school type is taken as at September 2015. It is likely that many of the schools grouped under Local Authority Schools have since become academies. Restricted to schools with at least 6 pupils at the end of key stage 4.
[2] https://www.gov.uk/government/publications/schools-causing-concern–2
[3] Note that for schools that opted in early to Progress 8 the 2015 element of the coasting definition is taken to be the most favourable of Progress 8 or the attainment and progress measure.
[4] As above, there are likely to be local authority schools here that have already become academies. In addition for academies we include the results of predecessor schools so this does not necessarily reflect underperformance as an academy but we have included here as these schools still require monitoring and support. Where a school has multiple predecessors we have pooled their results together.
[5] https://www.gov.uk/government/news/hundreds-of-coasting-schools-to-be-transformed