The Department for Education (DfE) has followed up their release of headline results in July with a provisional analysis of 2016’s key stage 2 assessments, with more information on the distribution of scaled scores, geographic variation and gender gaps.
The Education Policy Institute’s previous notes outlined what the new tests cover and the implications that these new arrangements are likely to have on the overall performance measures for primary schools. These illustrated a significant raising of the bar for standards and an increase in inconsistency across results by subject area for pupils. Here we explain what more we’ve learned today and what it might mean for school accountability.
The key findings we set out below include:
- Only 53% of primary pupils are reaching the DfE’s new expected standard.
- The proportion of pupils achieving the expected standard is highest in grammar, punctuation and spelling (72%) and lowest in reading (66%).
- The local authorities with the highest proportion of pupils achieving the expected standard were Kensington and Chelsea and Richmond upon Thames (67%) and the lowest was Peterborough (39%).
- The gender gap was greatest in writing, with 81% of girls achieving the expected standard compared to 68% of boys.
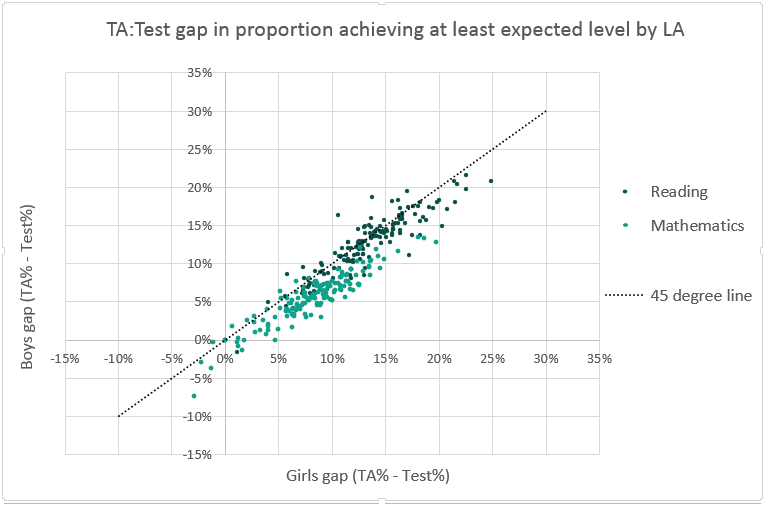
When we analyse the results of tests compared with teacher assessments in each subject, we find that, in maths, boys do relatively worse in their teacher assessments than we would expect from their formal test scores (relative to how well girls perform under both conditions).
Our take on this year’s results across key stages, plus useful background on each, can be found at our dedicated Results Hub.
What are the key trends for standards?
The new data confirms that the number of pupils achieving the new ‘expected standard’ is lower than those achieving the previous benchmark of national curriculum level 4 – 53% across all of reading, writing and mathematics compared to 80% in 2015.
Despite the new standards being intended to be broadly similar to a level 4b – acknowledging that the differences in curricula prevent direct comparisons – the EPI estimates that the proportion achieving them 6 was percentage points lower than that previous benchmark applied to all three. As DfE note, it is likely that results will improve inthe first few years following these changes as pupils and teachers adapt. This reduction is partly due to the fact that a larger proportion of pupils achieving the benchmark for a given subject fail to achieve it for the others, compared to the previous system.
In a turnaround from recent years, the proportion reaching the expected standard is highest in grammar, punctuation, and spelling (72%) and lowest for reading (66%) among the tested subjects. This is perhaps surprising given all of the recent associated controversy about grammar curriculum changes.
These results are generated by the Standards and Testing Agency converting raw test marks into a ‘scaled score’, running from 80 to 120, and the DfE’s new analysis gives detail on the distribution of scores. A ‘high score’ has been set for each subject to ensure that roughly a fifth achieved it in 2016, and it is subject to confirmation in later years. This makes it difficult to interpret the associated results, but among the tested subjects the proportion achieving this is highest for grammar, punctuation and spelling (23%) and lowest for mathematics (17%). By way of comparison, the proportion of pupils teachers assessed as ‘working at greater depth’ in writing was 15%.
More generally, the variation in scaled scores was widest in reading and narrowest for mathematics. Combined with its unexpectedly low relative position in terms of the numbers achieving the standard, this means it is likely that scrutiny of the testing method and implementation of the new curriculum will be most intense for this subject.
These new results also cover teacher assessments in science, reading and mathematics in addition to those for writing (which are part of headline measures used for accountability). The proportions achieving the standard were highest for science (81%) and lowest for mathematics (70%). DfE note that for reading and mathematics, teacher assessments appear to have generated bigger proportions achieving the standard than their test counterparts, and more so than in recent years for national curriculum tests.
How do results vary across the country and types of schools?
Consistent with previous key stage 2 assessments, and the findings of EPI’s Annual Report, there were large differences across local authorities in 2016. The proportion reaching the expected standard across reading, writing and mathematics varies from 39% in Peterborough to 67% in Kensington and Chelsea and in Richmond-Upon-Thames. Consistent with the patterns for pupil-level variation, the range in LA performance is greatest for reading.
Regional variations are also consistent with recent trends, with relatively good performance in London and the South East. As before, there was also relatively strong performance in parts of the North, including Trafford, Warrington and Redcar and Cleveland, with Gateshead this year ranked 9th on the headline measure compared to 39th for level 4b in 2015. There were generally worse outcomes in the Midlands, Yorkshire and Humber and the East of England. Variation across LAs is more significant than the overall variation between regions – the proportion achieving the expected standard ranged from 49% in the West Midlands to 57% in Inner London.
As in recent years, the proportions reaching the expected standard are similar across maintained schools and academies and free schools overall. Across the different types of academies, 57% achieved the standard in converter academies, compared to 43% in sponsored academies and 48% in free schools. The variation in performance across academies of different ages appears similar to in 2015’s results. Given the different starting points and characteristics of these schools it is not possible to draw conclusions about the different types’ effectiveness in raising standards based on these data on their own.
What lies behind the gender gaps?
Maintaining recent trends, girls outperformed boys in 2016 overall, with 57% compared to 50% achieving the expected standard across reading, writing and mathematics.
For individual subjects, the gap was greatest in writing (81 compared to 68%) and also substantial for reading (70 compared to 62%) and for grammar, punctuation and spelling (78 compared to 67%). However, there was no difference in the mathematics test – in fact more boys achieved a ‘high’ score (18 compared to 15%). This is consistent with the comparisons made in 2015 at level 4 and the higher level 4b.
The causes of gender differences in tests are the subject of a significant body of research, but the local authority data published by DfE today also give some insight in the case of key stage 2 assessment. The chart below plots for each local authority the difference between the proportion reaching expected standards in teaching assessments and in tests for boys, against the equivalent figure for girls. As DfE note, for both reading and mathematics more pupils reached the benchmarks under the teaching assessment than in tests, so most of the dots are in the top-right quadrant. There is also a great deal of variation across local authorities in these differences – that could suggest inconsistency in LA moderation in this first year of the new system, or variations in teaching methods that have differing impacts on test results and teacher assessment.
The dotted line shows the pattern that we would expect to see if these differences were always equal in an area between girls and boys – e.g. whenever the results were better for girls in the teaching assessments compared to the tests, the same percentage-point difference would be seen for boys.
As it happens, for mathematics girls’ relative performance in teaching assessments is greater than boys’ relative performance in teaching assessments in most authorities (141 out of 150 LAs with data provided). Nationally, the proportion of boys reaching the expected standard under teacher assessments is 7 percentage points more than the proportion under tests, but for girls the difference is 9. Nationally, for reading the absolute gap is no different for boys and girls on average, but the relative performance for girls in teaching assessments is still greater than that for boys in 108 LAs.
This might suggest that in the 2016 mathematics assessments, boys’ performed better under more formal test conditions than when being observed and assessed by a teacher (relative to how girls performed in both), or that teachers have been more generous in teacher assessments for girls relative to their overall ability – either could be down to differing responses to the conditions of assessment, or variations in how strongly different aspects of the curriculum are tested across the two methods and which of those the respective genders find more difficult. This might play a modest part in the headline gender gap, based on tests and not teacher assessment, being substantial in reading but zero for mathematics.
What are the implications for school accountability?
The release of performance tables in December will signal the specific impacts of these results for individual schools and identify those at risk of formal intervention. The DfE analysis suggests that the rankings of local authority results follow similar patterns to those for last year’s national curriculum tests, although the year-on-year correlation in that is slightly lower than a comparison made between 2014 and 2015. This suggests that a change in curriculum and assessment method is causing some additional instability in terms of local performance variation. However, their school-level analysis suggests a similar variability to last year, so the picture is not completely clear.
For 2016, the headline attainment and progress performance measures are changing, and will be based on the percentage of pupils achieving the expected standards, average scores in individual subjects, and average progress compared to key stage 1 assessments using a ‘value added’ measure of relative performance changes (comparing key stage 2 outcomes to pupils nationally with similar prior attainment scores).
There will also be new floor standards, setting the performance thresholds at which DfE’s intervention arrangements will kick-in. A school will need to either:
- Ensure at least 65% of pupils meet the expected standard in English reading, English writing and mathematics; or
- Achieve sufficient progress scores in all of these subjects.
Today’s results suggest meeting the achievement part of these standards will be very challenging – with the overall proportion of pupils achieving the expected standard only 53% (and 52% including only state funded schools). This means the progress standard becomes especially important. Schools have been given their progress scores and their national distribution, and the DfE have previously announced that the number of schools below the floor standard will be similar to that of last year.
The importance of progress is also true for ‘coasting schools’, where DfE intend to use three years of data to identify schools that are not ensuring all pupils “reach their potential”, via an attainment measure and a progress measure. Final provisions rely on passing regulations under the Education and Adoption Act 2016, but this will feature a threshold of 85% reaching the expected standard in reading, writing and maths. That would seem a target unachievable to most schools. Indeed, the Department’s graphical summary of their school-level analysis of correlation between 2016 and 2015 results suggest that no schools reached this level – though the detail behind this has not been published.
The new accountability framework therefore looks to have an increased focus on progress as the key measure, so it is likely that the distribution of schools that are at risk of greater scrutiny will change.