Which babies are more likely to experience screen time? Among those who watch, who watches the most? And how does using screens interplay with other home activities? Our analysis finds that most babies surveyed for Children of the 2020s experience up to an hour a day (49%) or no screentime (28%); a very small minority (2%) experience over three hours. Number of siblings is strongly related to screen use, and while family income-level is related to amount watched – among those who watch any – there is no pattern by income-level in terms of whether babies access any screens vs none. For the 2% of babies viewing over three hours, there seems to be the most negative relationship with engagement in other regular activities. But for babies watching up to two hours of screentime there is much less – or no – link. In fact, an increase to two hours is associated with more pretend play, turn-taking, and singing.
Screentime for under-fives is a hot topic for policymakers, parents, and researchers. The Department for Education (DfE) recently announced it is developing guidance in this area, with publication expected in April.[1] Research on screen-use among two-year-olds, commissioned by the Department, has been released alongside this announcement.[2] It uses data on toddlers from the second wave of the Children of the 2020s cohort study.
The research concentrates on average minutes of screentime experienced, and finds that at age two, ‘there is strong social patterning of screen time in England’, with children in low-income families and with parents with lower qualifications likely to experience more screentime.[3]
To provide additional evidence on screentime in the early years, we also analyse data from Children of the 2020s – focussing on the first wave of the survey, when babies were around nine months old. Over 8,000 families took part in Children of the 2020s. They were selected to be representative of the population in England in late 2022.[4]
Parents were asked:
‘Typically, how many minutes a day does [baby] watch television, videos, or other digital content on a screen?’[5]
This analysis addresses three questions:
- Which babies are more likely to experience any screentime?
- Among those who experience any screentime, which babies experience the most?
- How does experience of screentime relate to experiences of other activities within the babies’ home environments?
Which babies are more likely to experience any screentime?
Rather than simply looking at average levels of screentime, including babies whose parents do not provide any at all, first we look at who is most likely to experience any screentime vs none.
72% of babies in the sample are reported to experience at least some screentime. 28% are reported to experience none.
We focus on the following factors as predictors of babies’ experiences of any screentime:
- Number of siblings in the household
- Number of parents in the household
- Family income level
- Parent/carer education level
We look at each of these factors alone, and then together in a statistical model, to see which seem most strongly to be related to experience of any screen use.[6]
In the model, we also control for babies’ exact age when the survey took place, the age of their parent/carer, their gender, their birthweight, and their ethnicity. We find very similar patterns whether we account for each of the other factors of interest, and the controls, or not.
Number of siblings is strongly associated with use of screens
Consistently, as Figure 1 shows, it is the number of siblings in a baby’s household that seems to make a big difference to screen use. The more siblings a baby has, the less likely they are to be reported to watch screens. 80% of those with no siblings experience some screentime, vs 57% of those with four or more.
Differences by parental education are less pronounced, and ‘n-shaped’ – babies whose parents have no or level 1 qualifications are less likely to watch screens than those with school-level qualifications, and those with postgraduate qualifications are least likely.[7]
Differences according to whether there are one or two parents in the household are small and not statistically significant in our model. Differences by income level are also small, and not statistically significant. So, we find negligible patterning by family income level in whether babies experience any screentime vs none at all.
Figure 1: Estimated percentage of babies experiencing any screentime[8]

Which babies experience the most screentime?
Among those babies who experience any screentime, the average amount per day is reported as 41 minutes (though see Figure 3, below, for more on the variation within this). Figure 2 again shows an overall relationship where those with no siblings experience more screentime compared to those with siblings, and an ‘n-shaped’ relationship with parents’ education level – with babies whose parents have the highest qualifications watching the least. Babies with parents with no or level 1 qualifications watch less than those with level 2 qualifications.[9]
However, among those experiencing any screentime, we see that babies with one parent in the household watch more (average 47 minutes) than those with two (39 minutes). We also see that family income-level is related to screentime – though not among those in the lowest three quintiles. The average per day across families with the lowest or middle incomes is 42 minutes, and among families with the highest incomes, 36 minutes.
Overall, then, the social patterning in screen viewing is not clearly pronounced nor linear. This contrasts with the patterns reported once children within the Children of the 2020s study are two, and there are more nuances to consider. [10]
Figure 2: Estimated minutes of screentime experienced among babies experiencing any screentime[11]

How does screentime relate to other activities within babies’ home environments?
To examine the relationship between screen-use and other activities, we divide babies into five groups: those who experience no screen time; up to an hour; up to two hours; up to three hours; and over three hours. Figure 3 shows the percentage of babies falling into each group. The majority of babies experience up to one hour (49%), followed by those who experience none (28%), then up to two hours (16%), and up to three hours (5%). 2% of babies in the study are reported to experience over three hours a day.
Figure 3: Reported minutes of screentime experienced: percentage of babies

We look at how the amount of screentime viewed corresponds to whether babies experience other activities on a daily basis. We use statistical models controlling for siblings in the house, parents in the house, family income-level, parent’s education level, age of parent/carer, babies’ exact age at survey, babies’ gender, their birthweight, and their ethnicity.
This tells us, for example, whether, on average, babies who experience less screentime are more likely to be read to daily, and whether those who experience a higher level of screentime are less likely.
Some of the discussion and debate around screentime centres on concerns that it displaces other activities that can be developmentally important.[12] Here we investigate whether and the extent to which these concerns are supported by this recent, nationally-representative cohort study data.
Reading and books
Figure 4 shows that the average likelihood of parents looking at pictures in books daily with their baby is the same (76% of parents within each category) whether the baby experiences no screentime, up to one hour, or up to two hours.
It is only when screentime exceeds two hours that the likelihood of looking daily at books reduces.
As Figure 3 shows, a minority of babies (8%) experience over two hours of screentime. This is not an insignificant number, but findings suggest that the relationship between screen use and books is not a straightforwardly inverse one. Patterns appear only at the higher end of screen use. Figure 5 shows a similar relationship between screen use and daily reading. At the upper end of screen-use, reading is less likely.
Figure 4: Estimated percentage of parents looking at pictures in books daily with their baby, according to the amount of screentime experienced by the baby[13]
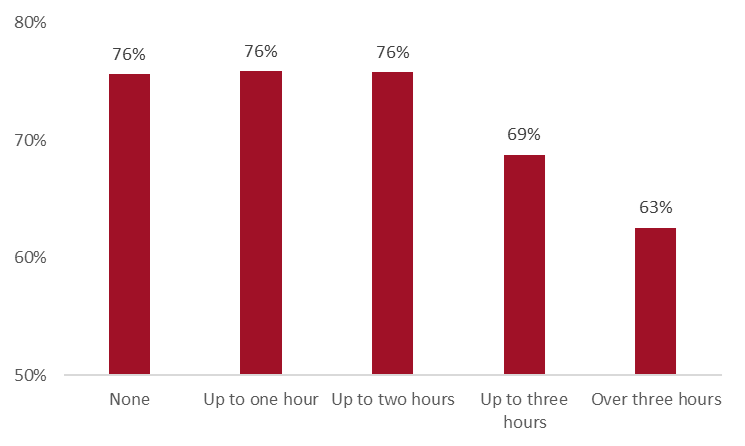
Figure 5: Estimated percentage of parents reading daily to their baby, according to the amount of screentime experienced by the baby[14]

Trips outside
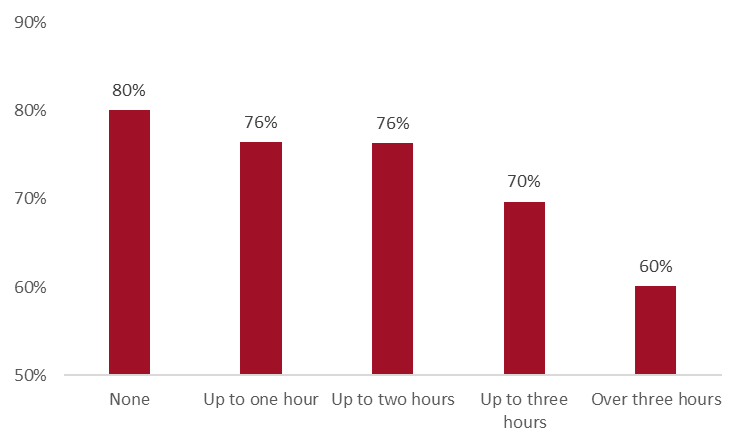
Figure 6 shows a more straightforwardly inverse relationship between parents’ reports of going on daily trips outside with their baby and amount of screentime. 80% of babies who watch no screens experience daily trips out, compared to 60% of those who watch three hours or more. Again, however, the gradient is steepest once screentime exceeds two hours.
The DfE-commissioned research looking at two-year-olds in Children of the 2020s finds that parental mental ill-health is associated with higher levels of screen use.[15] It is plausible that this goes some way to explaining the patterns in Figure 6, if parents whose mental health is poorer are less likely to go out with their baby and more likely to use screens for longer.
Our previous research (looking at older pre-schoolers in the earlier Millennium Cohort) found also that families experiencing financial hardships took far fewer trips out, and had higher screen use.[16]
Figure 6: Estimated percentage of parents taking daily trips outside with their baby, according to the amount of screentime experienced by the baby[17]
Screentime interplaying with other activities
The DfE’s report also notes that, ‘some parents believe that screentime can be beneficial, for example in providing educational content.’[18] This is supported by the fact that for some activities, more screentime is, to a certain point, reciprocally associated with a higher likelihood of undertaking the activity.
Figure 7 shows that parents whose babies experience up to two hours screentime are more likely to report daily pretend play with their baby (86%) compared to those babies with less or no screentime (82%). The same pattern can be seen in Figure 8 for turn-taking activities, and in Figure 9 for daily singing. Levels of screentime over three hours are, however, associated with lower chances of daily engagement in these activities.
This emphasises that ‘screentime’ is a nuanced concept, covering diverse possibilities, and can encompass shared and interactive viewing and shared play.[19]
Figure 7: Estimated percentage of parents engaging in pretend play daily with their baby, according to the amount of screentime experienced by the baby[20]

Figure 8: Estimated percentage of parents engaging in turn-taking play daily with their baby, according to the amount of screentime experienced by the baby[21]

Figure 9: Estimated percentage of parents singing daily with their baby, according to the amount of screentime experienced by the baby[22]

What does this add to the discussion about babies and screentime?
While the findings here are only one piece of the jigsaw of evidence on screentime and under-fives, they raise several points that inform current debate. Specifically, they offer new evidence for babies that both differs from and builds on existing analyses of the Children of the 2020s cohort as children reach age two.[23]
We find no relationship between whether babies experience any screentime or none according to family income level. To the extent that this represents choice, parents across income levels appear to be making similar decisions on this. Instead, the number of siblings in a family is a strong predictor of screen use: having more siblings is related to lower chances of babies experiencing screens. Number of siblings is also linked to the amount of screentime a baby experiences – alongside the number of parents in the house.
Most babies in Children of the 2020s experience no screentime or up to an hour (77%); a very small minority (2%) experience over three hours a day. It is for these children watching over three hours that there seems to be the most negative relationship between the experience and engaging in other regular activities: they are least likely to experience regularly being read to, trips outside, pretend and turn-taking play, and singing with their parent (though many in the over-three-hours group do still experience these things).
For babies experiencing lower levels of screentime, however – up to two hours – there is much less, or no, association between screentime and these other activities. In fact, an increase from no to two hours of screentime is associated with more pretend play, turn-taking, and singing.
We cannot tell from these analyses exactly why babies experience different levels of screentime, and how this interacts with other facets of families’ lives. But our findings suggest that it may be helpful to focus further investigation, support, guidance and policymaking at the higher end of the distribution – looking at the minority of babies who experience three hours, or more, a day.
This will involve understanding the reasons for the high levels of use in this small minority. As the DfE’s publication points out, ‘screen time is often perceived by parents as a valuable way to help them juggle the challenges of the modern household or settle children when over-excited, upset or tired.’[24] It also reports relationships between mental ill health and higher levels of screen use; while elsewhere poverty and hardship are flagged as potential contributors.[25]
Exploring further the type(s) of screen use experienced is also important: whether screen use is shared, interactive, or passive, for example. As well as considering what could support reduced use at the top end – if and when this is desirable – policymakers should also consider what may enable types of screen use that intersect with other activities that can promote infant development and family enjoyment. Our analyses here highlight that screen use is not necessarily mutually exclusive from these positive experiences.