Today the Department for Education (DfE) released the annual statistics on widening access and participation in higher education, covering up to the 2023/24 academic year. The publication includes a wide range of data on progression rates to HE across England, broken down by a series of characteristics as well as the type of higher education to which students progress.
As we did last year, we have investigated the ‘participation gap’ at higher education (HE) between two groups. For example, students who were in receipt of free school meals in school and those who were not. The DfE publication includes a series of charts on these gaps. However, to better understand the magnitude of inequalities in HE participation, we have transformed this data into ‘risk ratios’, or relative risks. Put simply, this analysis tells us how much more likely one set of students is to progress to university than another.
What is relative risk?
To recap, relative risk is a measure used to compare the probability of an event (such as progressing to university) happening in one group compared to another. Whereas the progression rate gap tells us the absolute difference between two groups, the relative risk tells us the scale of the disparity. A relative risk of 1 would mean that the two groups are equally as likely to progress to university. Above 1 would mean that the numerator group is more likely to progress, and below 1 would mean they are less likely to progress.
For example, in 2021/22, non-FSM students had a progression rate to high tariff higher education of 14.6 per cent, while FSM students had a progression rate of 5.3 per cent. We can calculate the relative risk for these groups as follows:
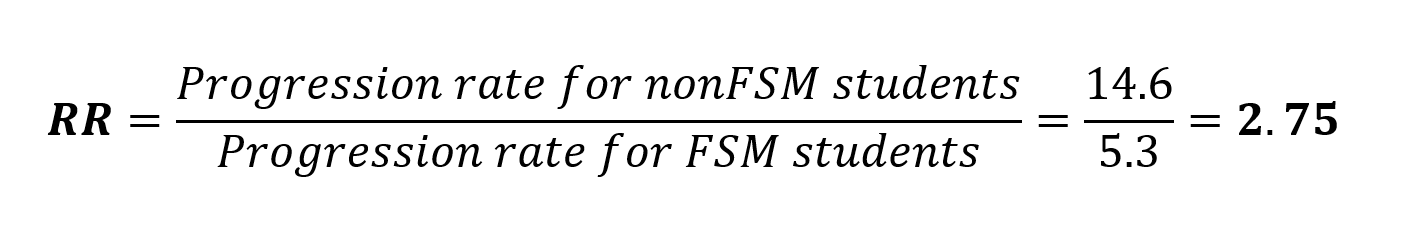
In this example then, the risk ratio for FSM vs non-FSM students would be 2.75, meaning FSM students are 2.75 times more likely to progress to high tariff universities than non-FSM students. This improves our understanding of the gap beyond just considering the difference in probabilities, which at just 9.3 percentage points might seem small.
With the explanation out the way, let’s take a look at the differing relative rates of progression between characteristics in the latest data.
Free school meals eligibility
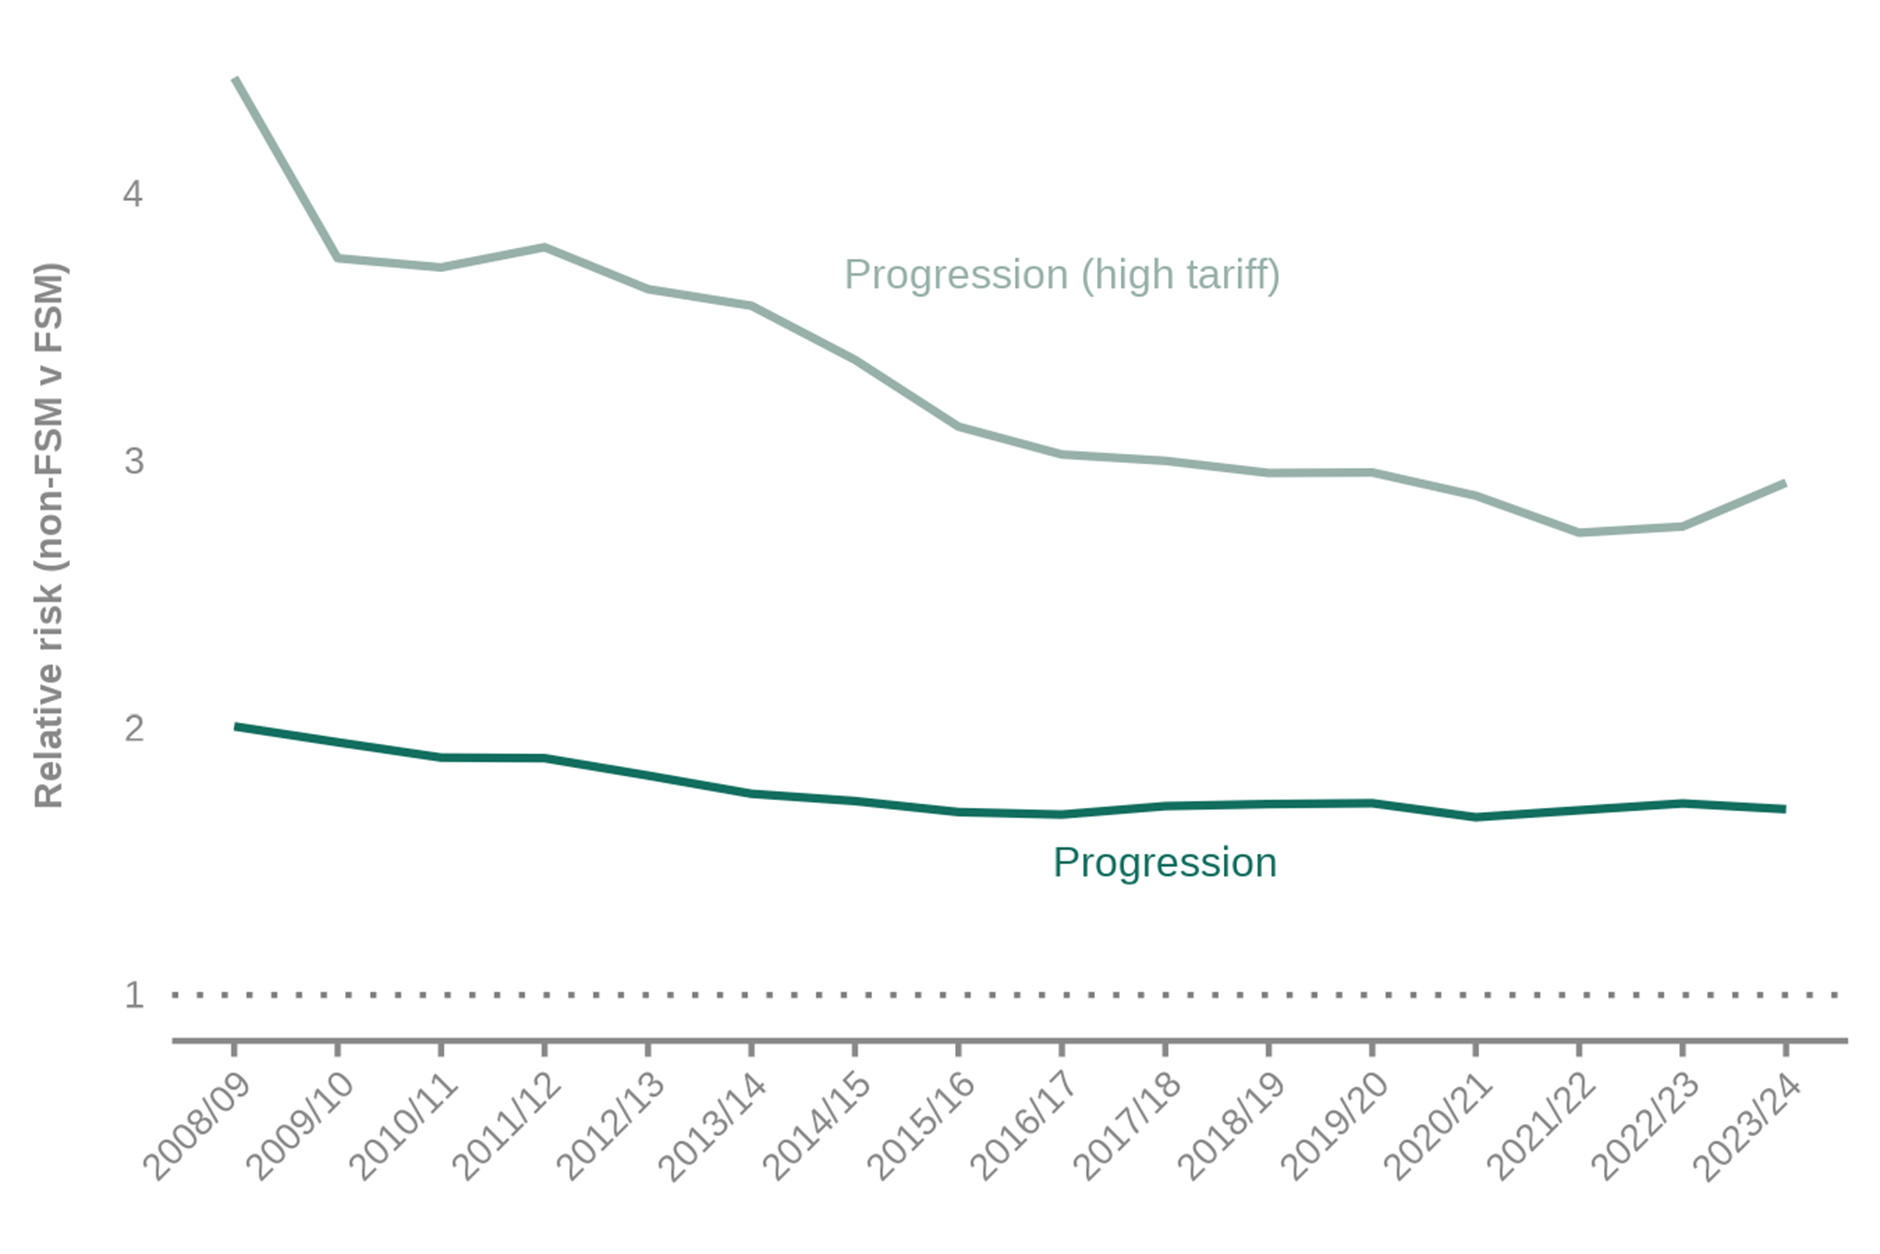
Comparing the relative progress rates for FSM students compared to non-FSM students we can see, perhaps unsurprisingly, that non-FSM students are far more likely to progress to higher education. From 2009 to 2017 FSM students were catching up with their peers, but progress has largely plateaued since then. Last year’s data showed a slight increase in this gap, with non-FSM students 1.71 times more likely to progress than their FSM-eligible peers.
In 2023/24, the relative risk of progression has returned to 2021/22 levels, with non-FSM students again 1.69 times more likely to progress. This is due to progression rates falling for both groups, albeit falling slightly more sharply for non-FSM students. This improvement in the gap is consistent with our findings on the 16-18 attainment gap, which improved for the same cohort (those finishing their level 3 qualifications in 2023).
Progression rates also fell across the board for high tariff HE, but for these courses FSM students saw a greater fall in progression. This has meant that progress on closing the high tariff progression gap has reversed for the second time, following years of improvements. Non-FSM students are now 2.92 times as likely to progress to high tariff HE than their FSM-eligible counterparts, the highest rate since 2019/20.
Relative progression rate and high tariff progression rate (FSM v non-FSM), 2008/09 – 2023/24
POLAR quintiles
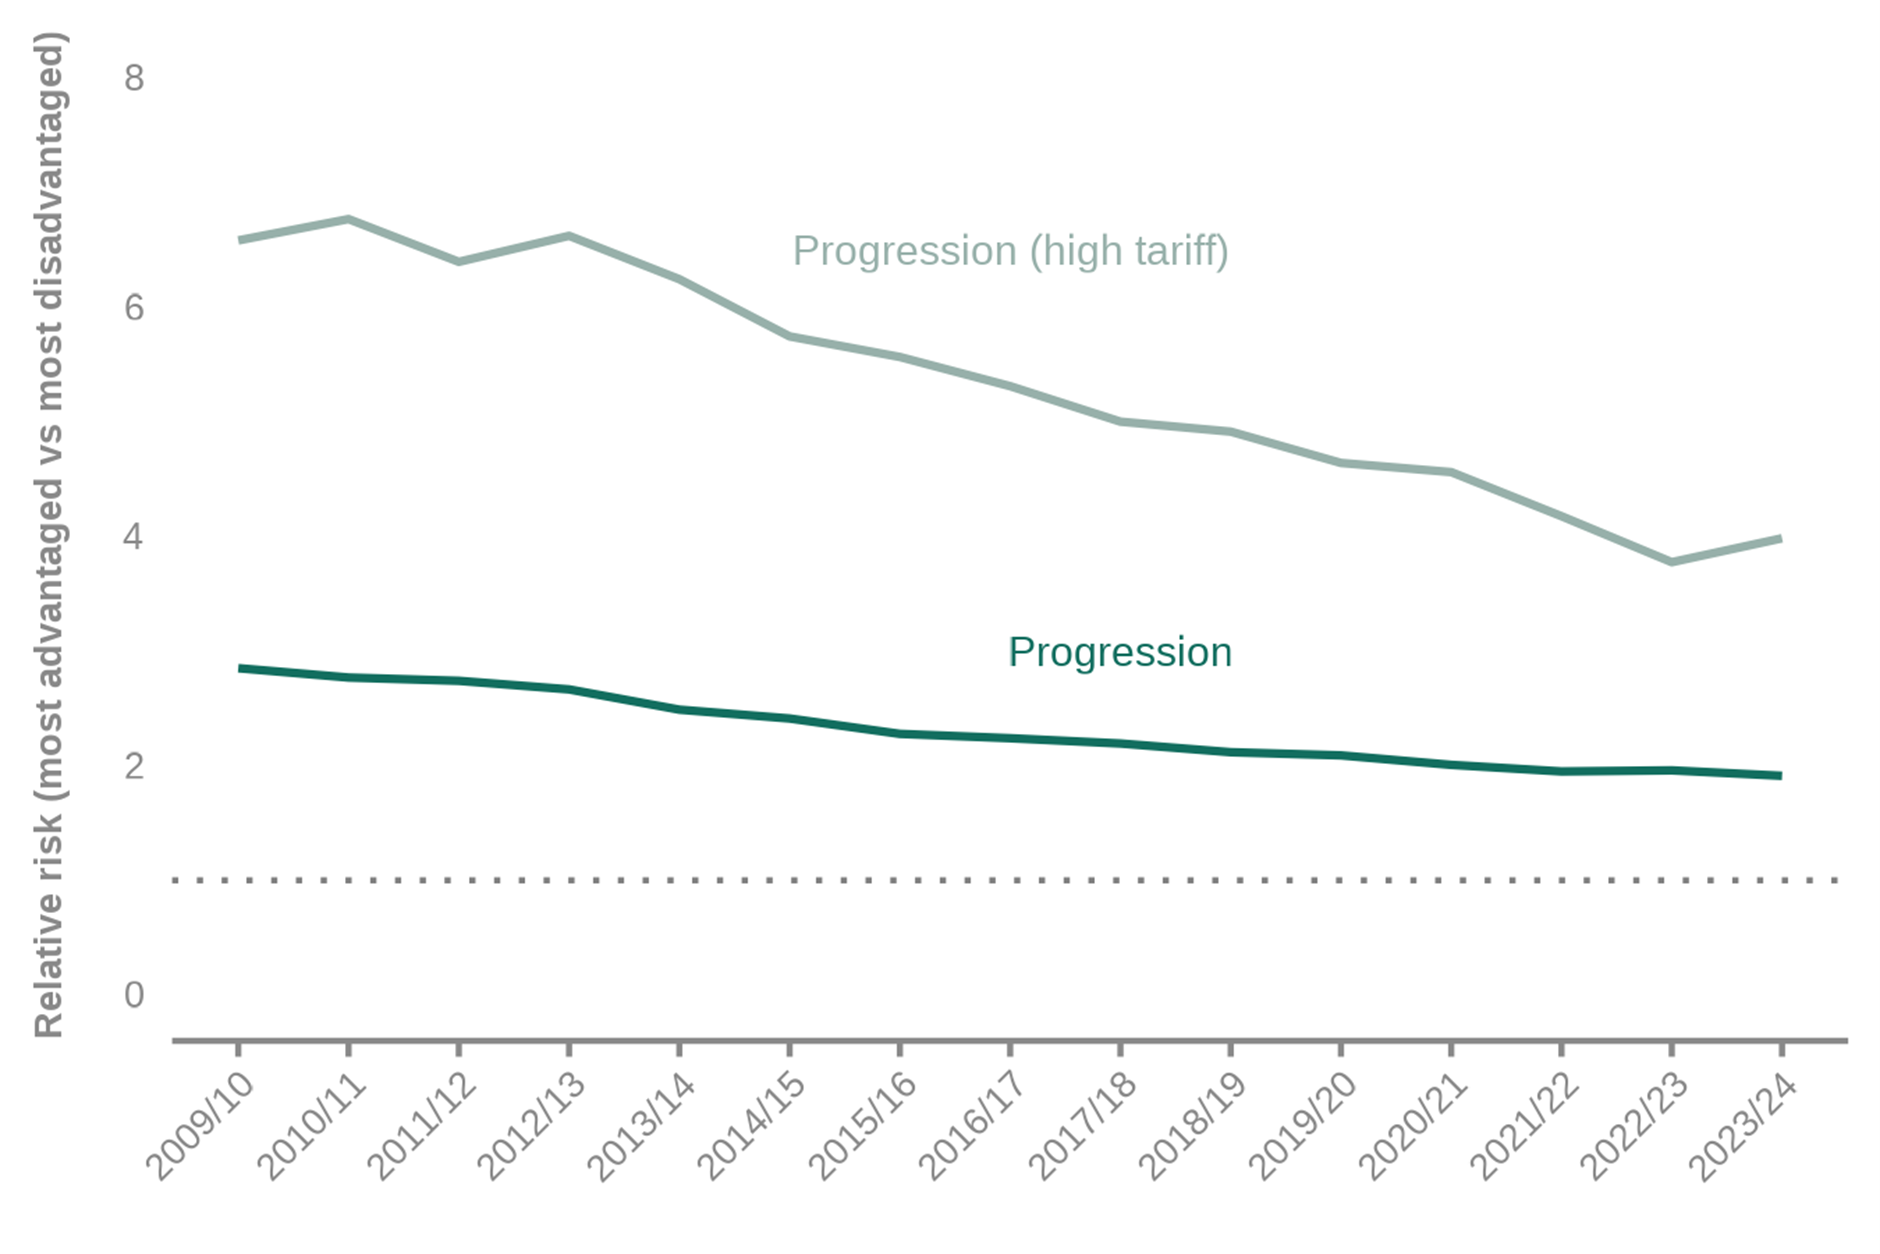
POLAR is an area-based measure of higher education progression, classifying areas into quintiles based on the historic proportion of young people progressing to HE. Here, we compare the most ‘advantaged’ quintile in terms of HE participation to the most ‘disadvantaged’.
Progress on closing the POLAR gap for all HE has continued, marking almost 15 years of narrowing. The most advantaged quintile is now 1.91 times as likely to progress compared to the most disadvantaged.
For high tariff HE however, this progress has reversed for the first time since 2012/13, with the relative progression rate now standing at 3.98 between the two groups.
Relative progression rate and high tariff progression rate (most advantaged POLAR v most disadvantaged POLAR), 2009/10 – 2023/24
Special Educational Needs (SEN)
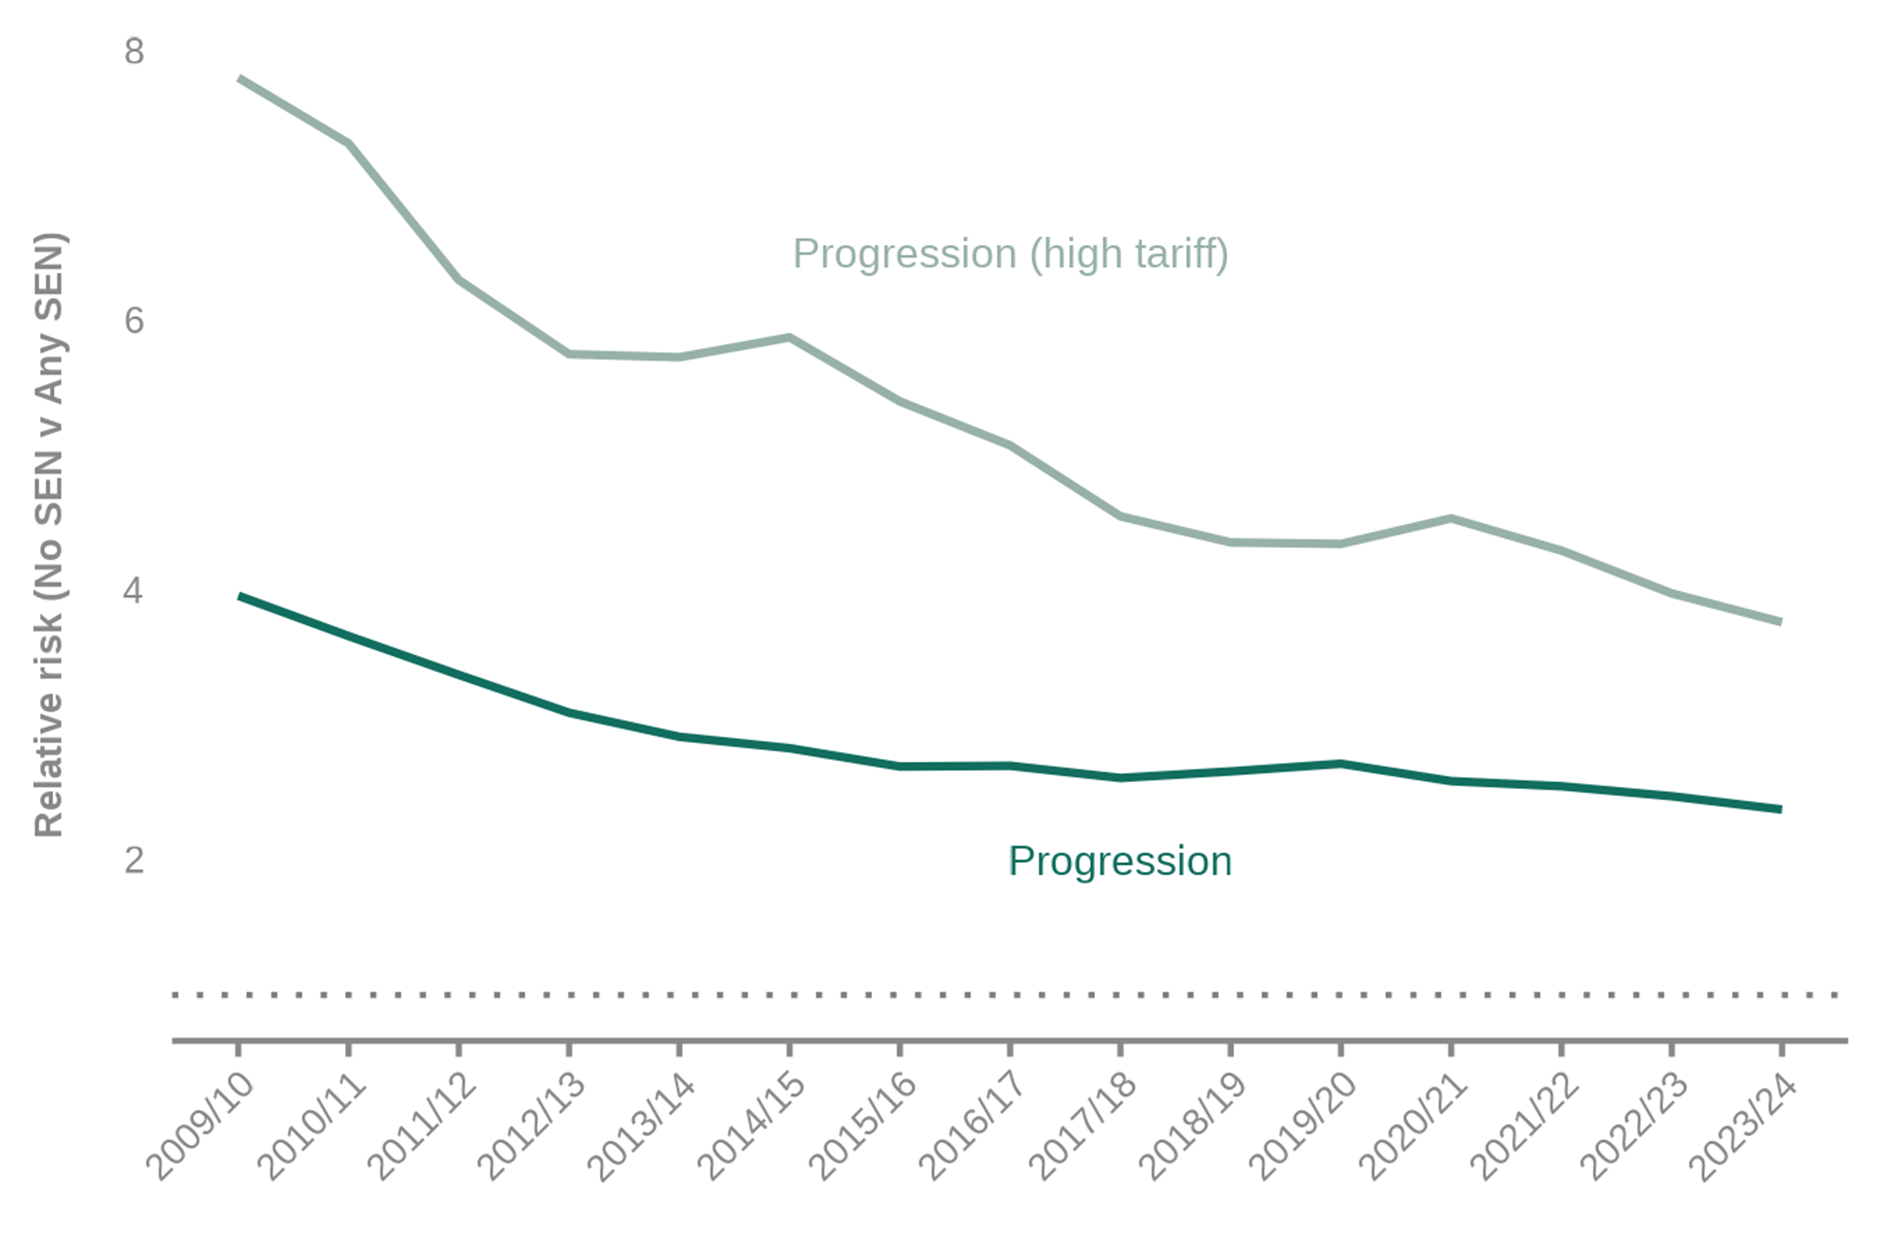
Pupils with special educational needs and disabilities (SEND) are some of the most educationally disadvantaged in the English school system. Our previous research has found that four in ten children are identified as SEND at some point between the ages of 5 and 16.
In terms of progression to HE, there has been steady progress in closing the gap in progression between students with no identified SEN and those with any identified SEN.
For all HE, students with no SEN are now 2.37 times as likely to progress compared to SEN students, down from 3.96 in 2009/10. The relative risk measure has also fallen for high tariff HE, with non-SEN students now 3.76 times as likely to progress, as progression rates have remained static for SEN students while non-SEN progression rates have fallen.
These improvements are consistent with reductions in the 16-19 attainment gap for students with SEND seen over recent years, which may also be related to changes in the composition of this group.
Relative progression rate and high tariff progression rate (No identified SEN vs Any SEN), 2009/10 – 2023/24
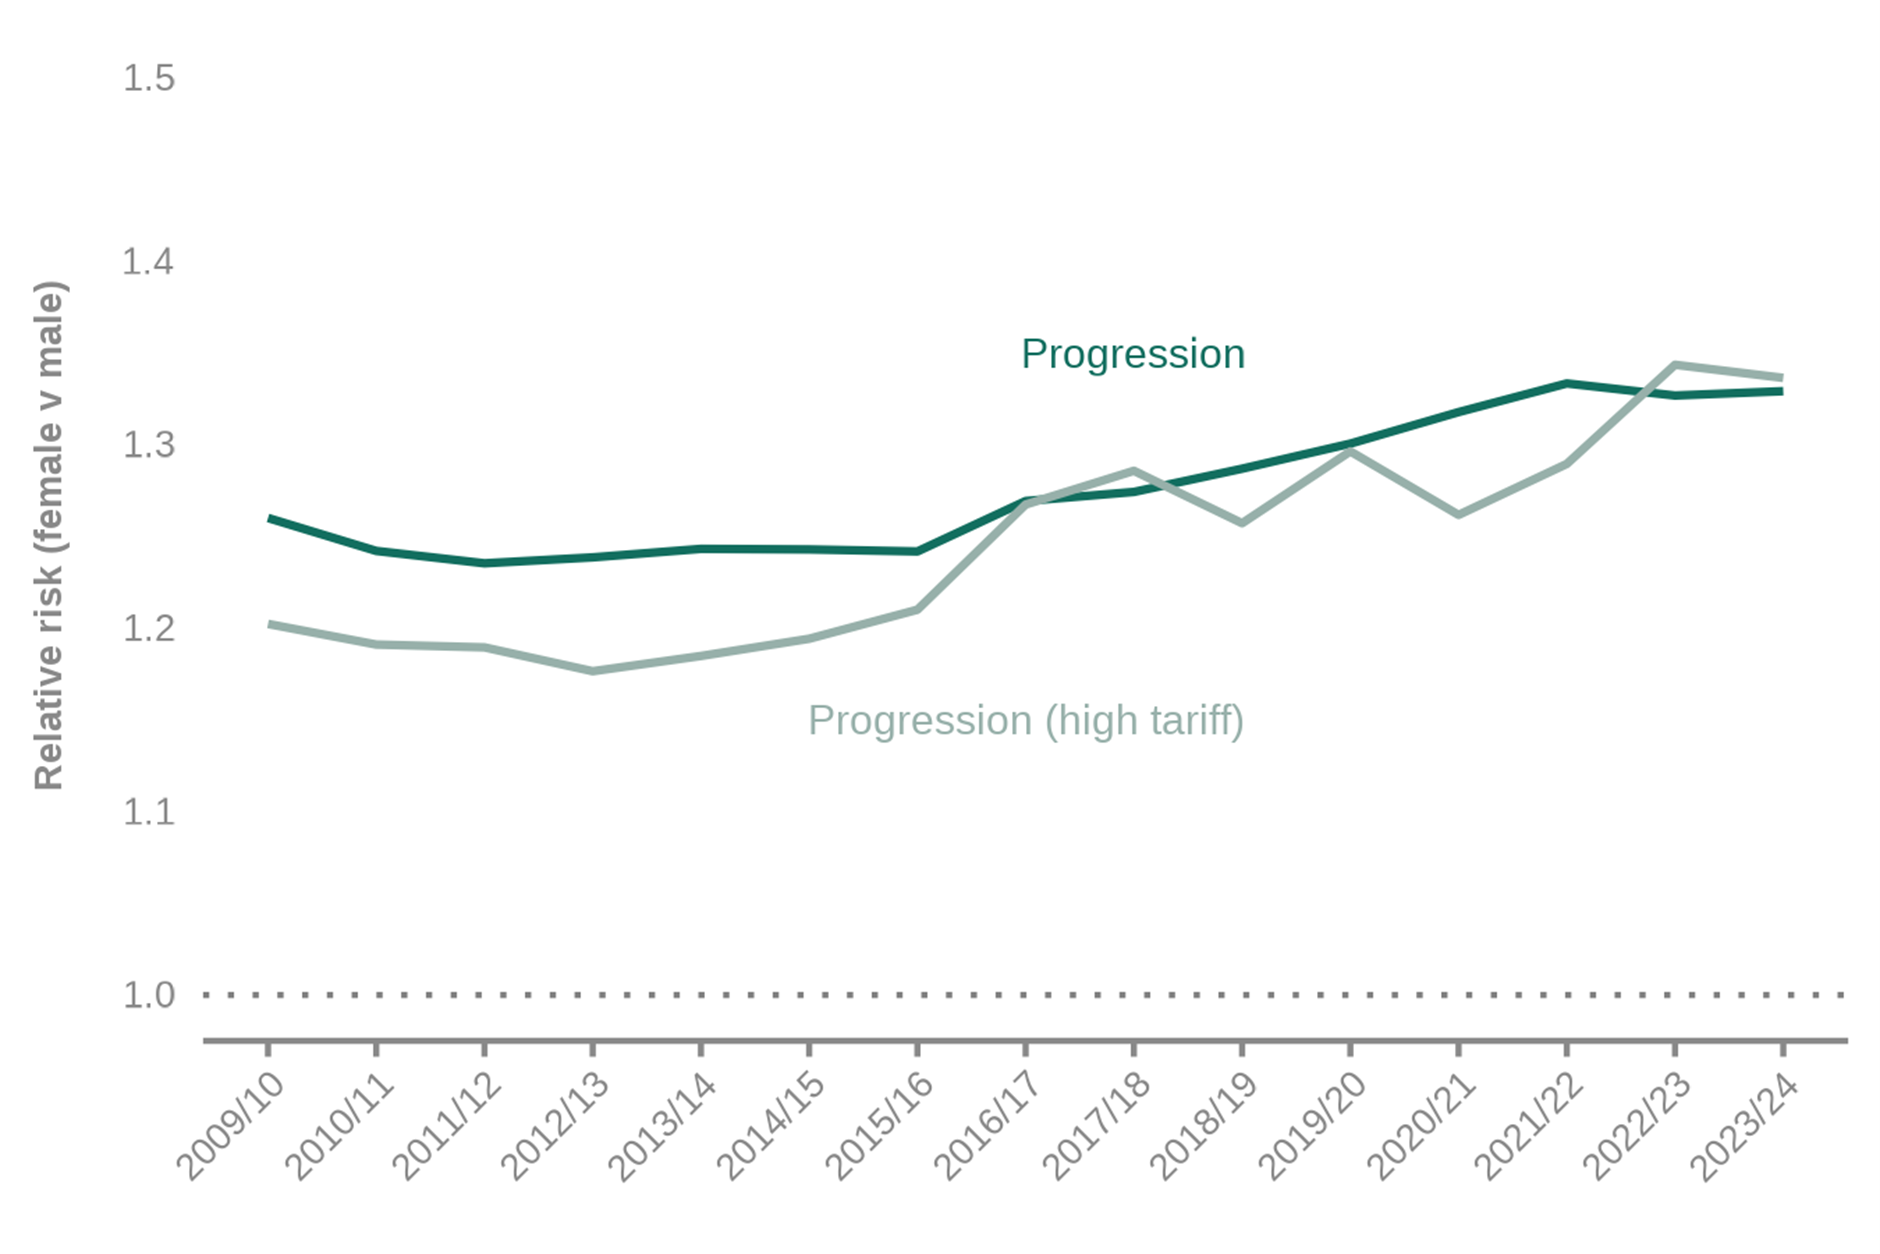
Gender
Finally, a quick look at gender. Our research on gender gaps in earlier phases of education has shown some narrowing since 2019 in the attainment gap that leaves male students behind their female counterparts. Here, the relative progression rate is shown as female vs male, meaning a larger value shows female students being more like than male students to progress.
Female students are 1.33 as likely to enter higher education as male students in 2023/24 compared with 1.26 times as likely in 2008/09, with little movement compared to last year’s data. The high tariff HE rate has also moved little in the last year, with female students remaining 1.34 times more likely to progress compared to male students in 2023/24.
The relative progression rate between female and male students for high tariff universities remains slightly higher than overall relative progression rate. In simpler terms, the difference in likelihood of progression between male students and female students is once again greater for high tariff universities.
Relative progression rate and high tariff progression rate (female v male), 2008/09 – 2022/23
Conclusion
Today’s data on access and participation shows a fall in HE progression rates for almost all groups of students, likely a hangover from the increased acceptance rates of students who sat their A levels during the COVID-19 pandemic, where attainment increased compared to previous years.
This ‘return to normal’ however, has meant little progress has been made in further narrowing of the progression gap between disadvantaged and non-disadvantaged students. This is not surprising given funding for disadvantaged students falls by a third during the 16-18 phase of education, and correspondingly we see them the equivalent of three A level grades behind their better-off peers. We have previously proposed the introduction of a 16-19 student premium to continue the support of the pupil premium given to these young people during their primary and secondary schooling.
If the government is to make real progress in narrowing higher education participation gaps, it must ensure that disadvantaged students are properly supported to secure the grades at 18 they are capable of.