How does overall funding and expenditure relate to school characteristics?
Summary
- Our first paper in this series showed that school expenditure increased by 42 per cent between 2002-03 and 2016-17, but funding, and hence expenditure, varies by the characteristics of schools.
- Expenditure in primary schools has increased at a faster rate than for secondary and special schools (An increase between 2002-03 and 2016-17 of 51 per cent in primary schools versus 36 per cent in both secondary and special schools). But overall, secondary schools are still funded more than 22 per cent higher than primary schools.
- Funding and expenditure for schools with disadvantaged pupils has increased at a faster rate than other schools since 2002-03. By 2016-17, primary schools with high proportions of disadvantaged pupils were spending on average 22 per cent more per pupil than schools with low proportions of disadvantaged pupils, up from 11 per cent in 2002-03 (the equivalent figures for secondary schools are 24 per cent up from 13 per cent).
- Schools in London remain both the highest funded and the highest spenders. Primary schools in London receive 27 per cent more per pupil than primary schools elsewhere, secondary schools in London receive 28 per cent more than secondary schools elsewhere.
- Between 2002-03 and 2016-17 the largest increases in funding were seen in primary schools in London ranging from 41 per cent in schools with low rates of free school meal (FSM) eligibility to 55 per cent in schools with high levels of FSM eligibility. The smallest increases were seen in secondary schools with low levels of FSM – 26 per cent in London and 27 per cent elsewhere. Median expenditure in primary schools increased by 51 per cent over the same period.
School funding
In Part 1 of this series we examined how school expenditure has changed over time using statistics from the Department for Education that covered all state-funded schools in England.
Before examining how that expenditure varies by school characteristics, it is worth considering how these same factors also relate to the level of funding that a school receives. The school funding system in England is broadly progressive, with pupils from more disadvantaged backgrounds attracting, on average, higher funding, as do pupils with low prior attainment, and those with English as an additional language.
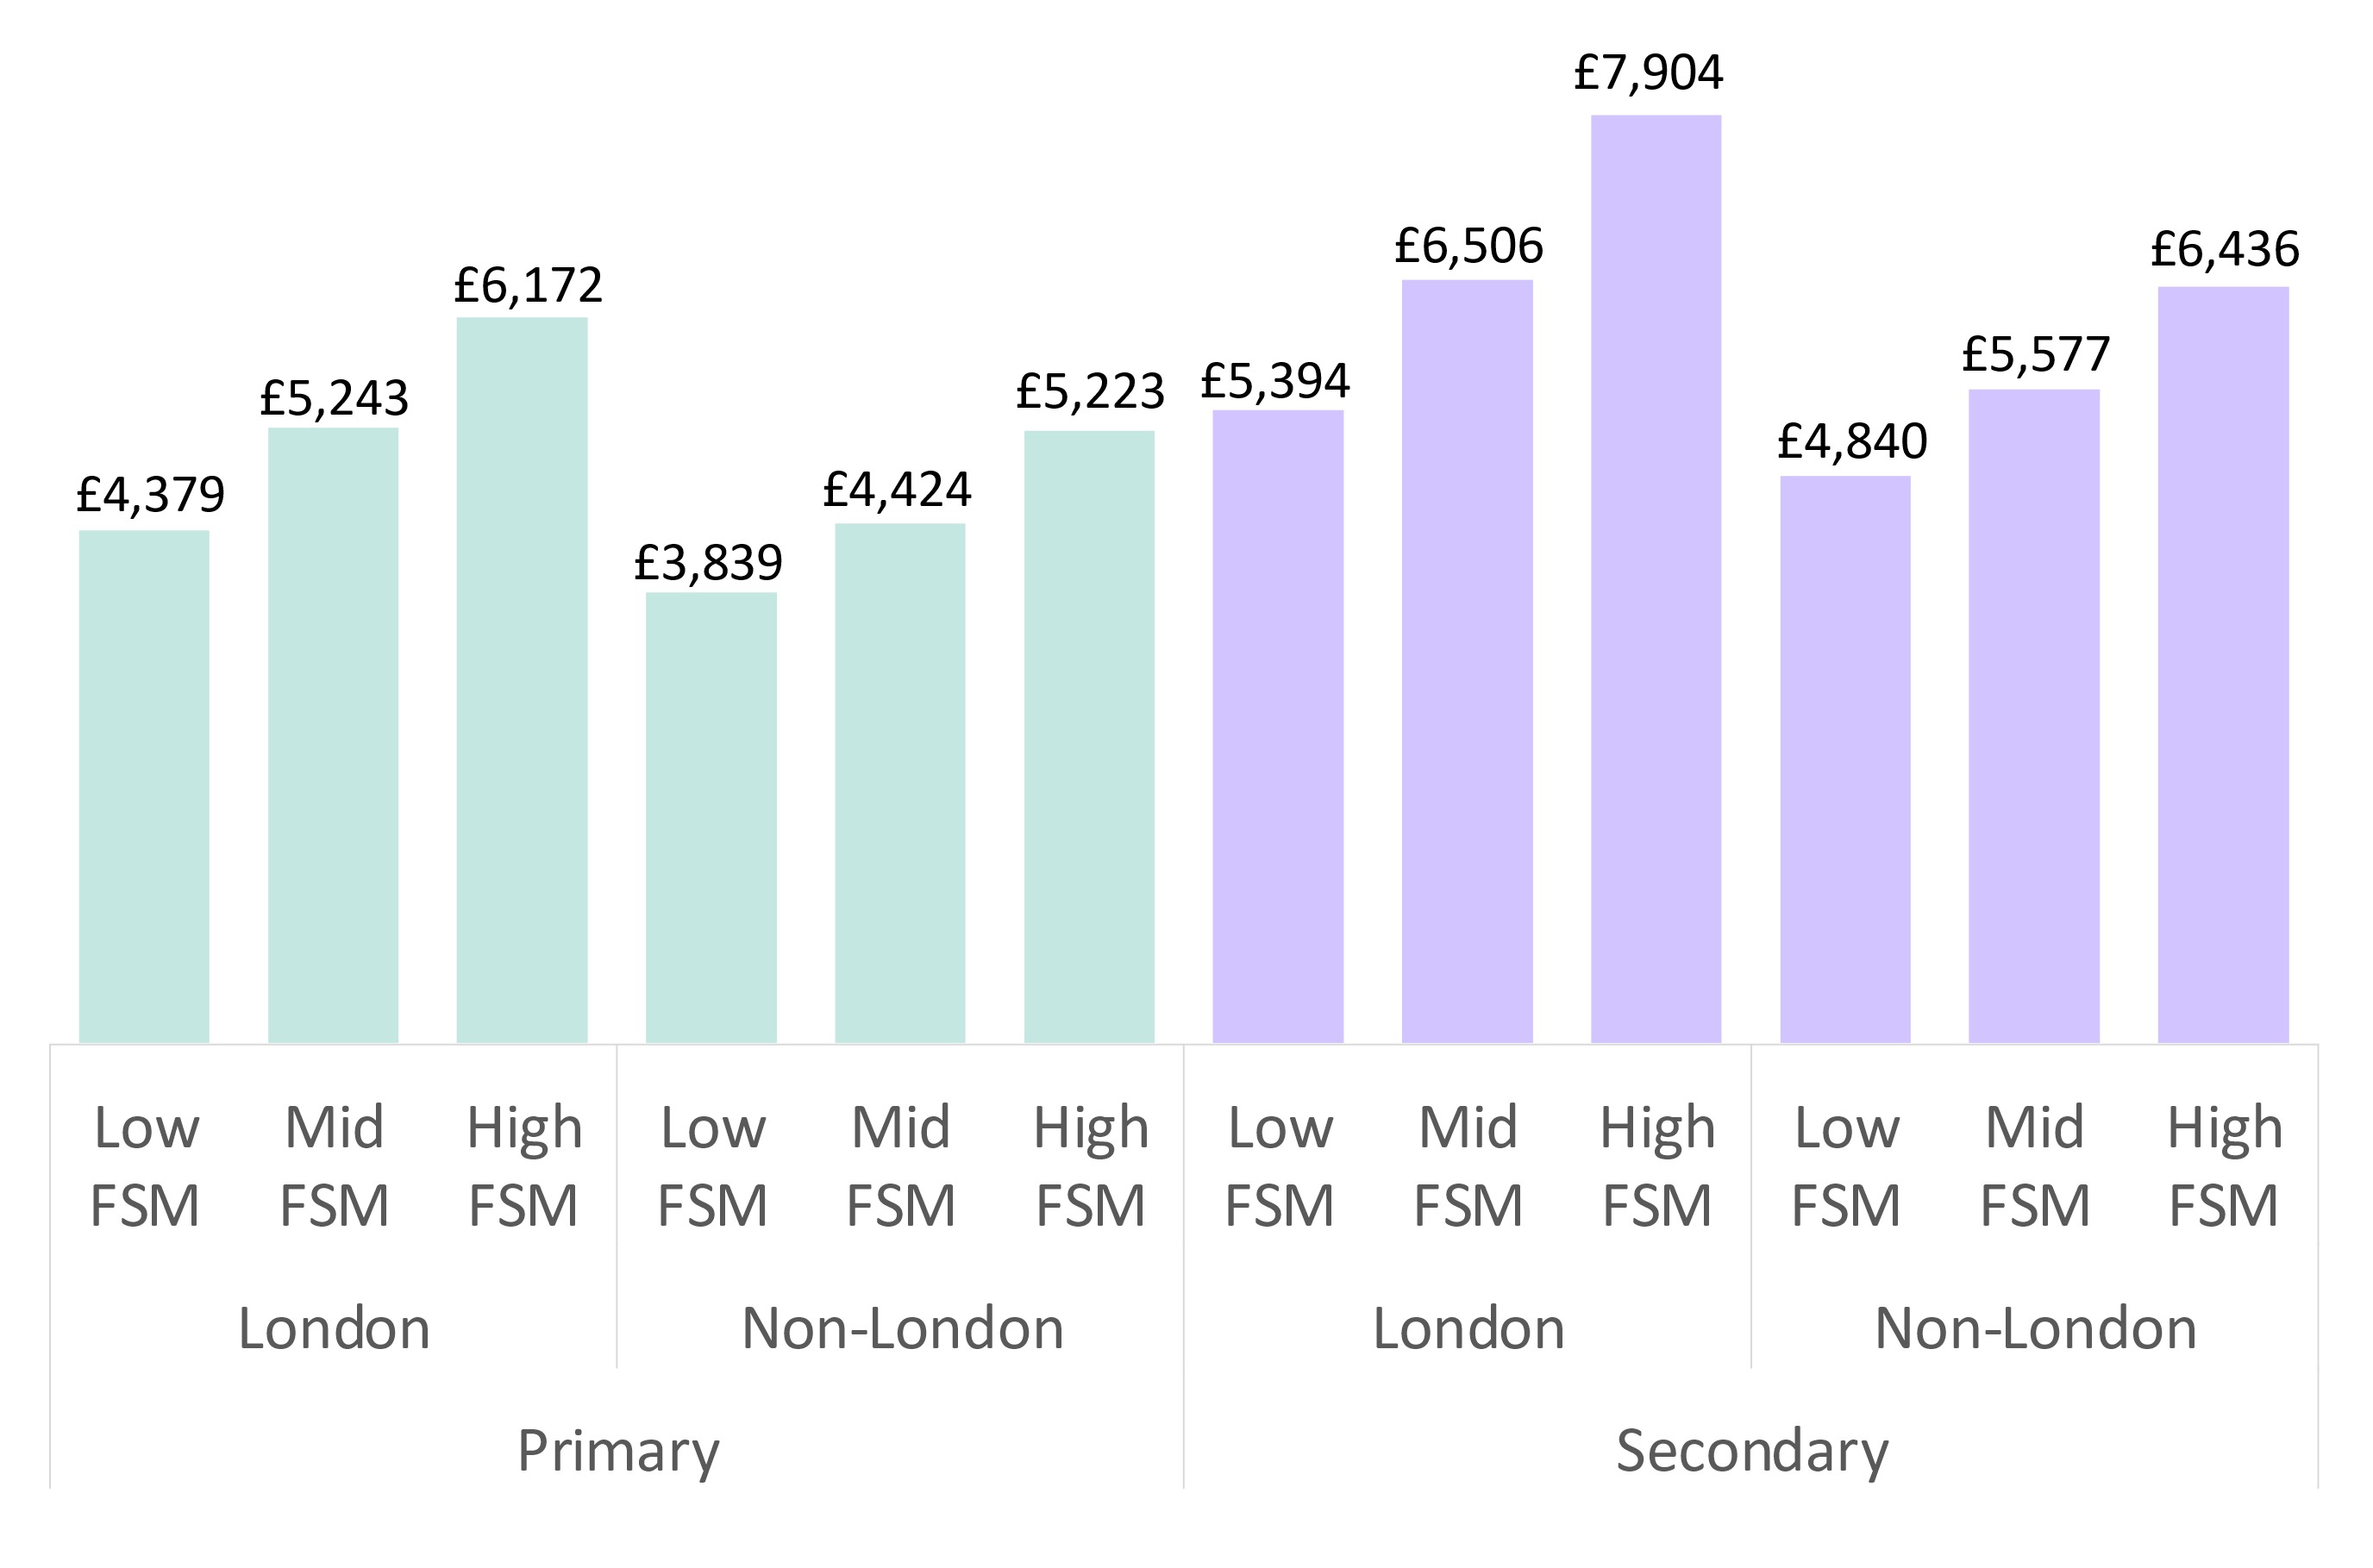
We illustrate the different levels of funding in Figure 1 by linking the published schools block allocation figures for 2016-17, the published Pupil Premium allocations for the same year (directed towards pupils from disadvantaged backgrounds – and now worth over £2.4bn a year), and school characteristics from the school census.[1]
It demonstrates that:
- secondary schools attract more funding than primary schools – 22 per cent more per pupil;
- schools in London attract more funding than schools elsewhere – 27 per cent more per pupil in primary schools and 28 per cent more per pupil in secondary schools; and
- schools with high levels of disadvantage (as measured by eligibility for free school meals) attract more funding than schools with more affluent intakes – 42 per cent higher in primary schools and 41 per cent higher in secondary schools.
In fact, by combining all three of these factors, we see the wide range of funding rates that exist. At the extremes, a London secondary school with a high proportion of disadvantaged pupils are funded at just over twice the rate of primary schools outside of London that have low proportions of disadvantaged pupils [2].
Figure 1: Core schools block funding and pupil premium allocations per pupil in 2016-17 by school characteristics
Note that the funding in this year pre-dates the introduction of the Government’s National Funding Formula (NFF) which is designed to address historic inconsistencies in the way that schools are funded and so this analysis may not fully reflect current patterns. We will write separately on the implications of recent announcements on school funding.
Throughout this series of publications, we are exploring how expenditure has changed over time, specifically between 2002-03 and 2016-17, for different schools. If we are to do the same for funding, then we need to construct an equivalent funding allocation for schools in 2002-03. There is no simple mapping for this since our baseline year, 2002-03, pre-dates the introduction of the Dedicated Schools Grant (DSG) and the later consolidation of different grants into the DSG. However, we have attempted to calculate an equivalent figure for 2002-03 based on the income data reported in the Consistent Financial Reporting return for that year.[3] While the two measures are not directly comparable it provides a useful illustration of where the increases have occurred.
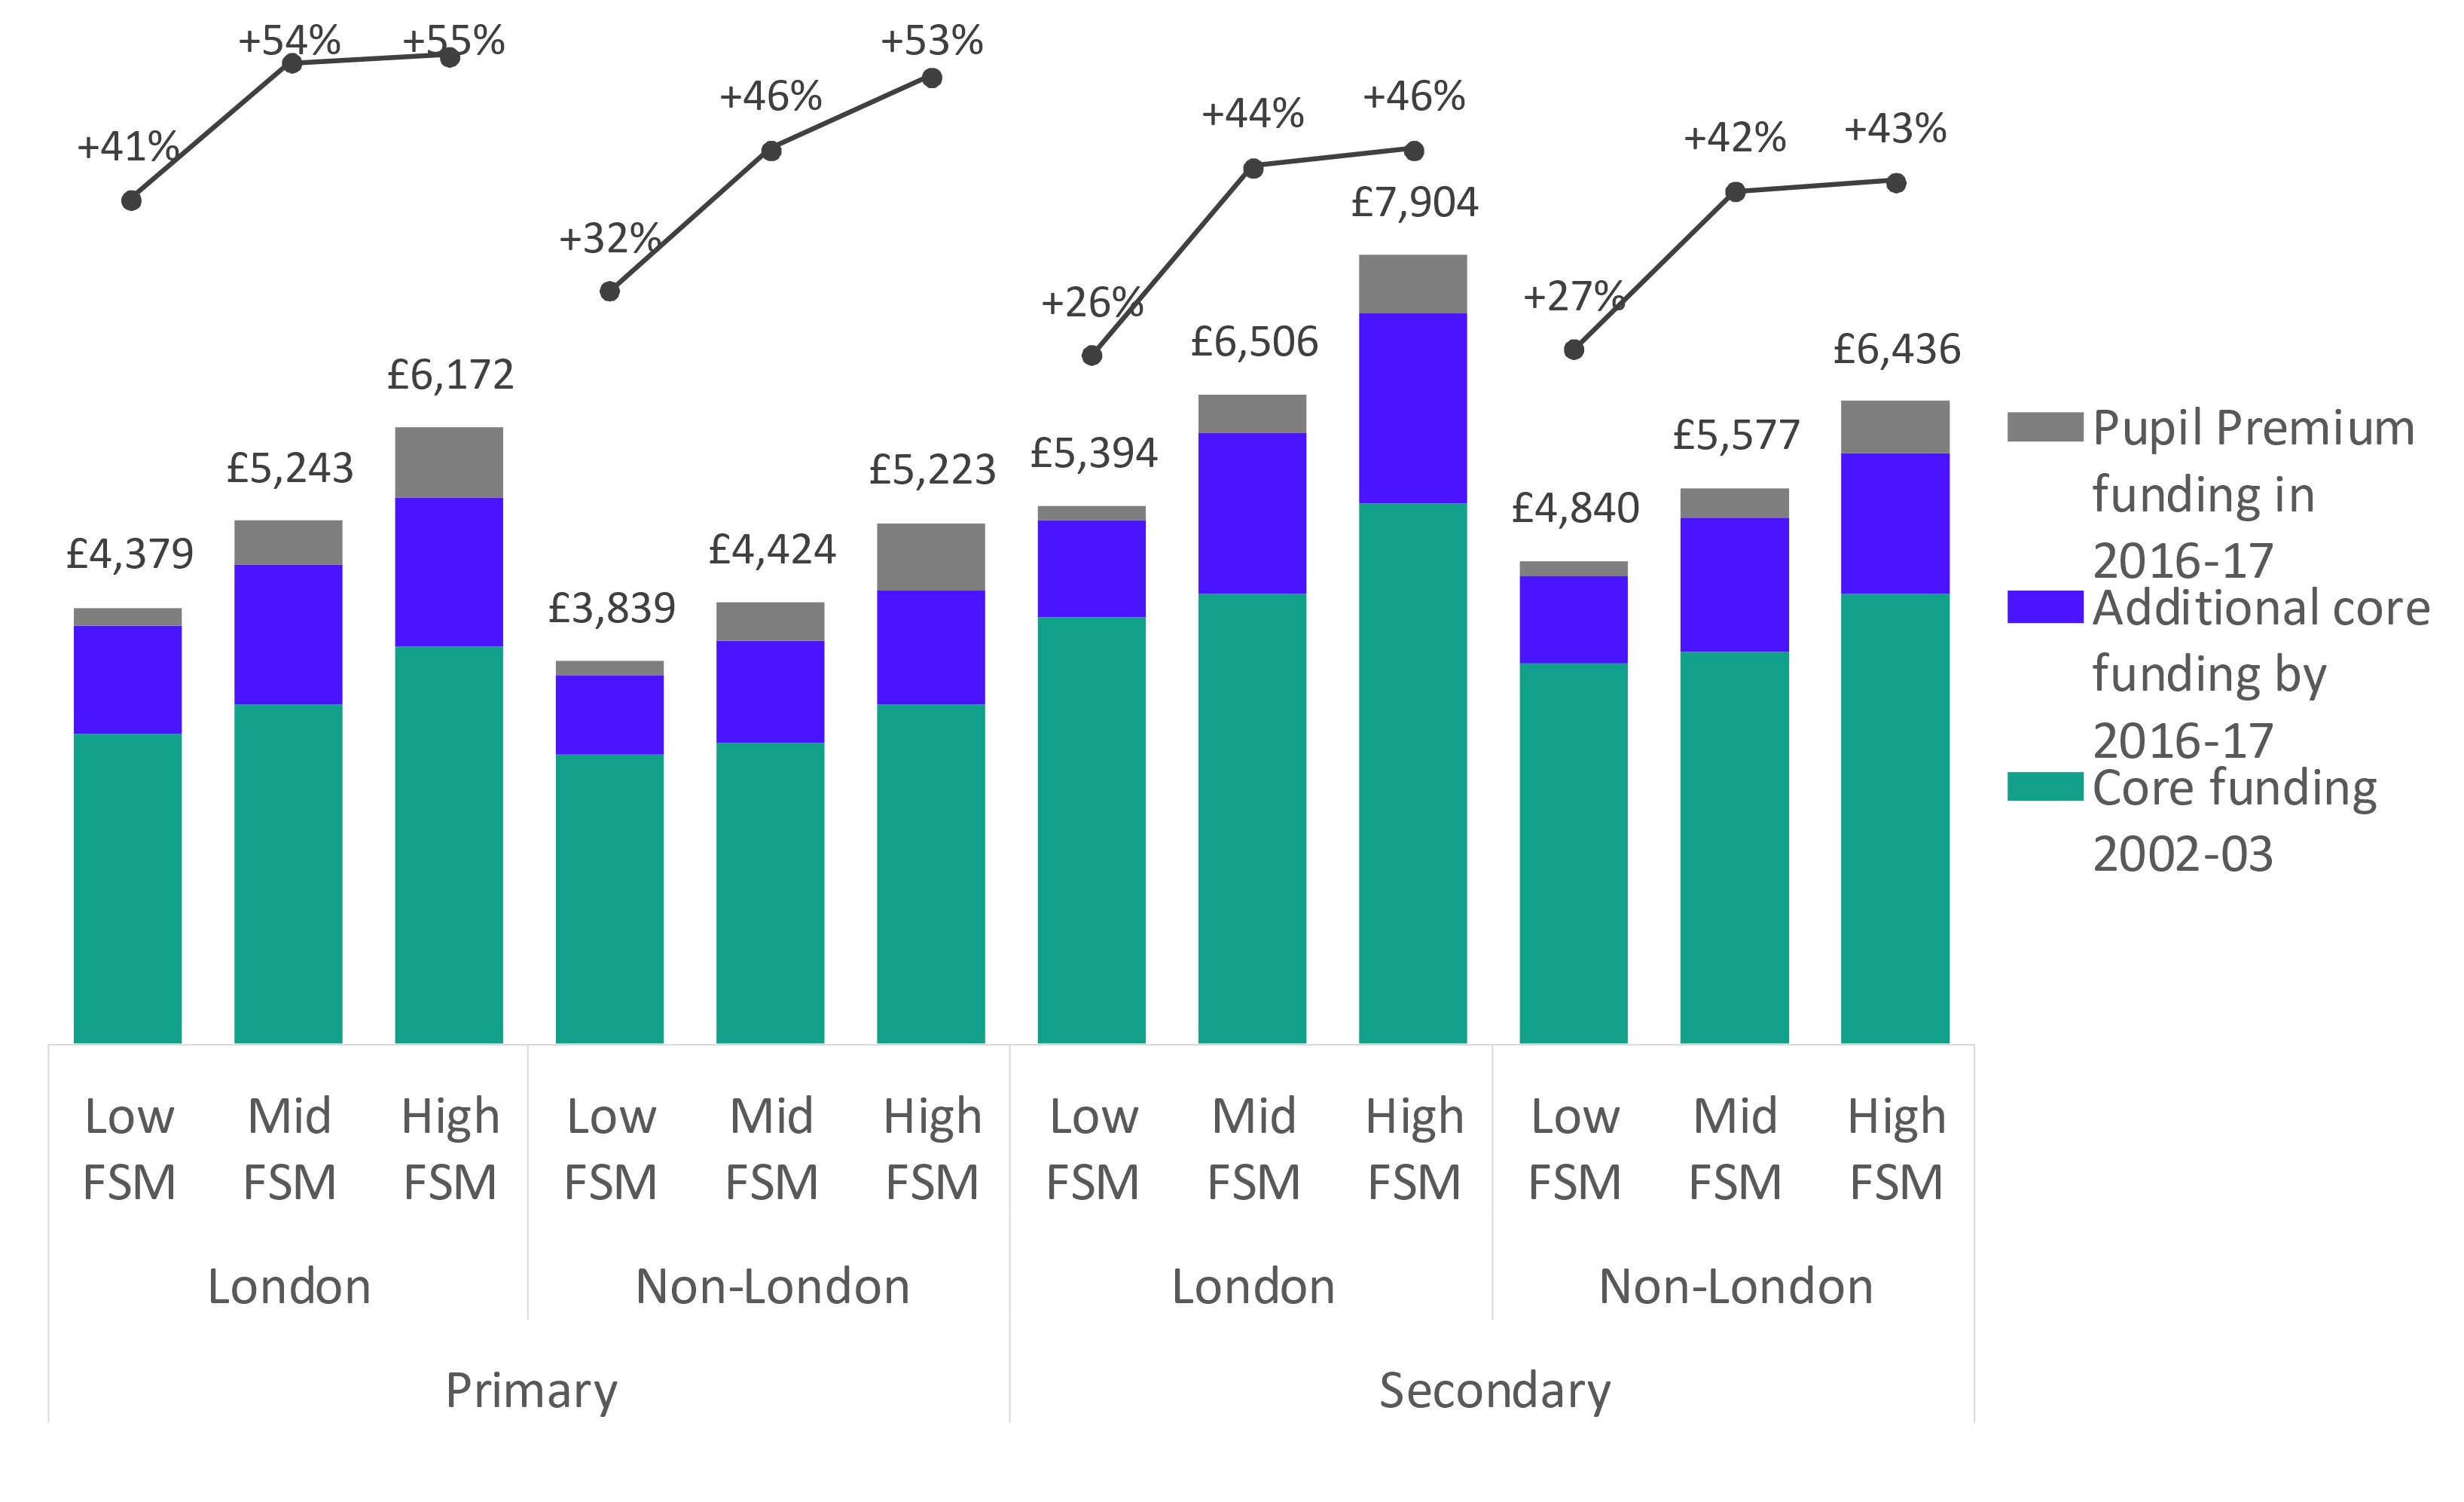
Figure 2 provides the same breakdowns by characteristics as Figure 1 to show the core funding in 2002-03, the additional core funding by 2016-17, and funding from the Pupil Premium. All amounts are in 2016-17 prices.
Broadly speaking, the relative positions of each of these groups are unchanged between the two time points. But we can also see from this that funding to schools with high levels of FSM has increased at a faster rate than in schools with low FSM. Overall, the largest increases were seen in primary schools in London ranging from 41 per cent in schools with low rates of FSM to 55 per cent in schools with high levels of FSM. The smallest increases were seen in secondary schools with low levels of FSM – 26 per cent in London and 27 per cent elsewhere.
The differences between the lowest and highest funded have grown over time. Amongst primary schools in 2002-03, schools in London with high levels of free school meal eligibility were funded 37 per cent higher than low FSM schools outside of London; by 2016-17 this had grown to 49 per cent. The equivalent figures for secondary schools were 42 per cent and 56 per cent.
Figure 2: Core schools block funding and pupil premium allocations per pupil 2002-03 and 2016-17 with change between the two years
School expenditure
We now consider how spending patterns have varied between different schools. In order to do this, we have constructed a school level dataset from the schools Consistent Financial Reporting and Academies Accounts Return, looking at expenditure in 2002-03, 2009-10 and 2016-17. Because of the incompleteness of these datasets It has only been possible to do this for a subset of schools – just over half of all primary and secondary schools and about two-thirds of special schools. As such the results are not directly comparable from the national level results in Part 1 and should be treated with caution, but we believe they reflect the broad underlying patterns.[4]
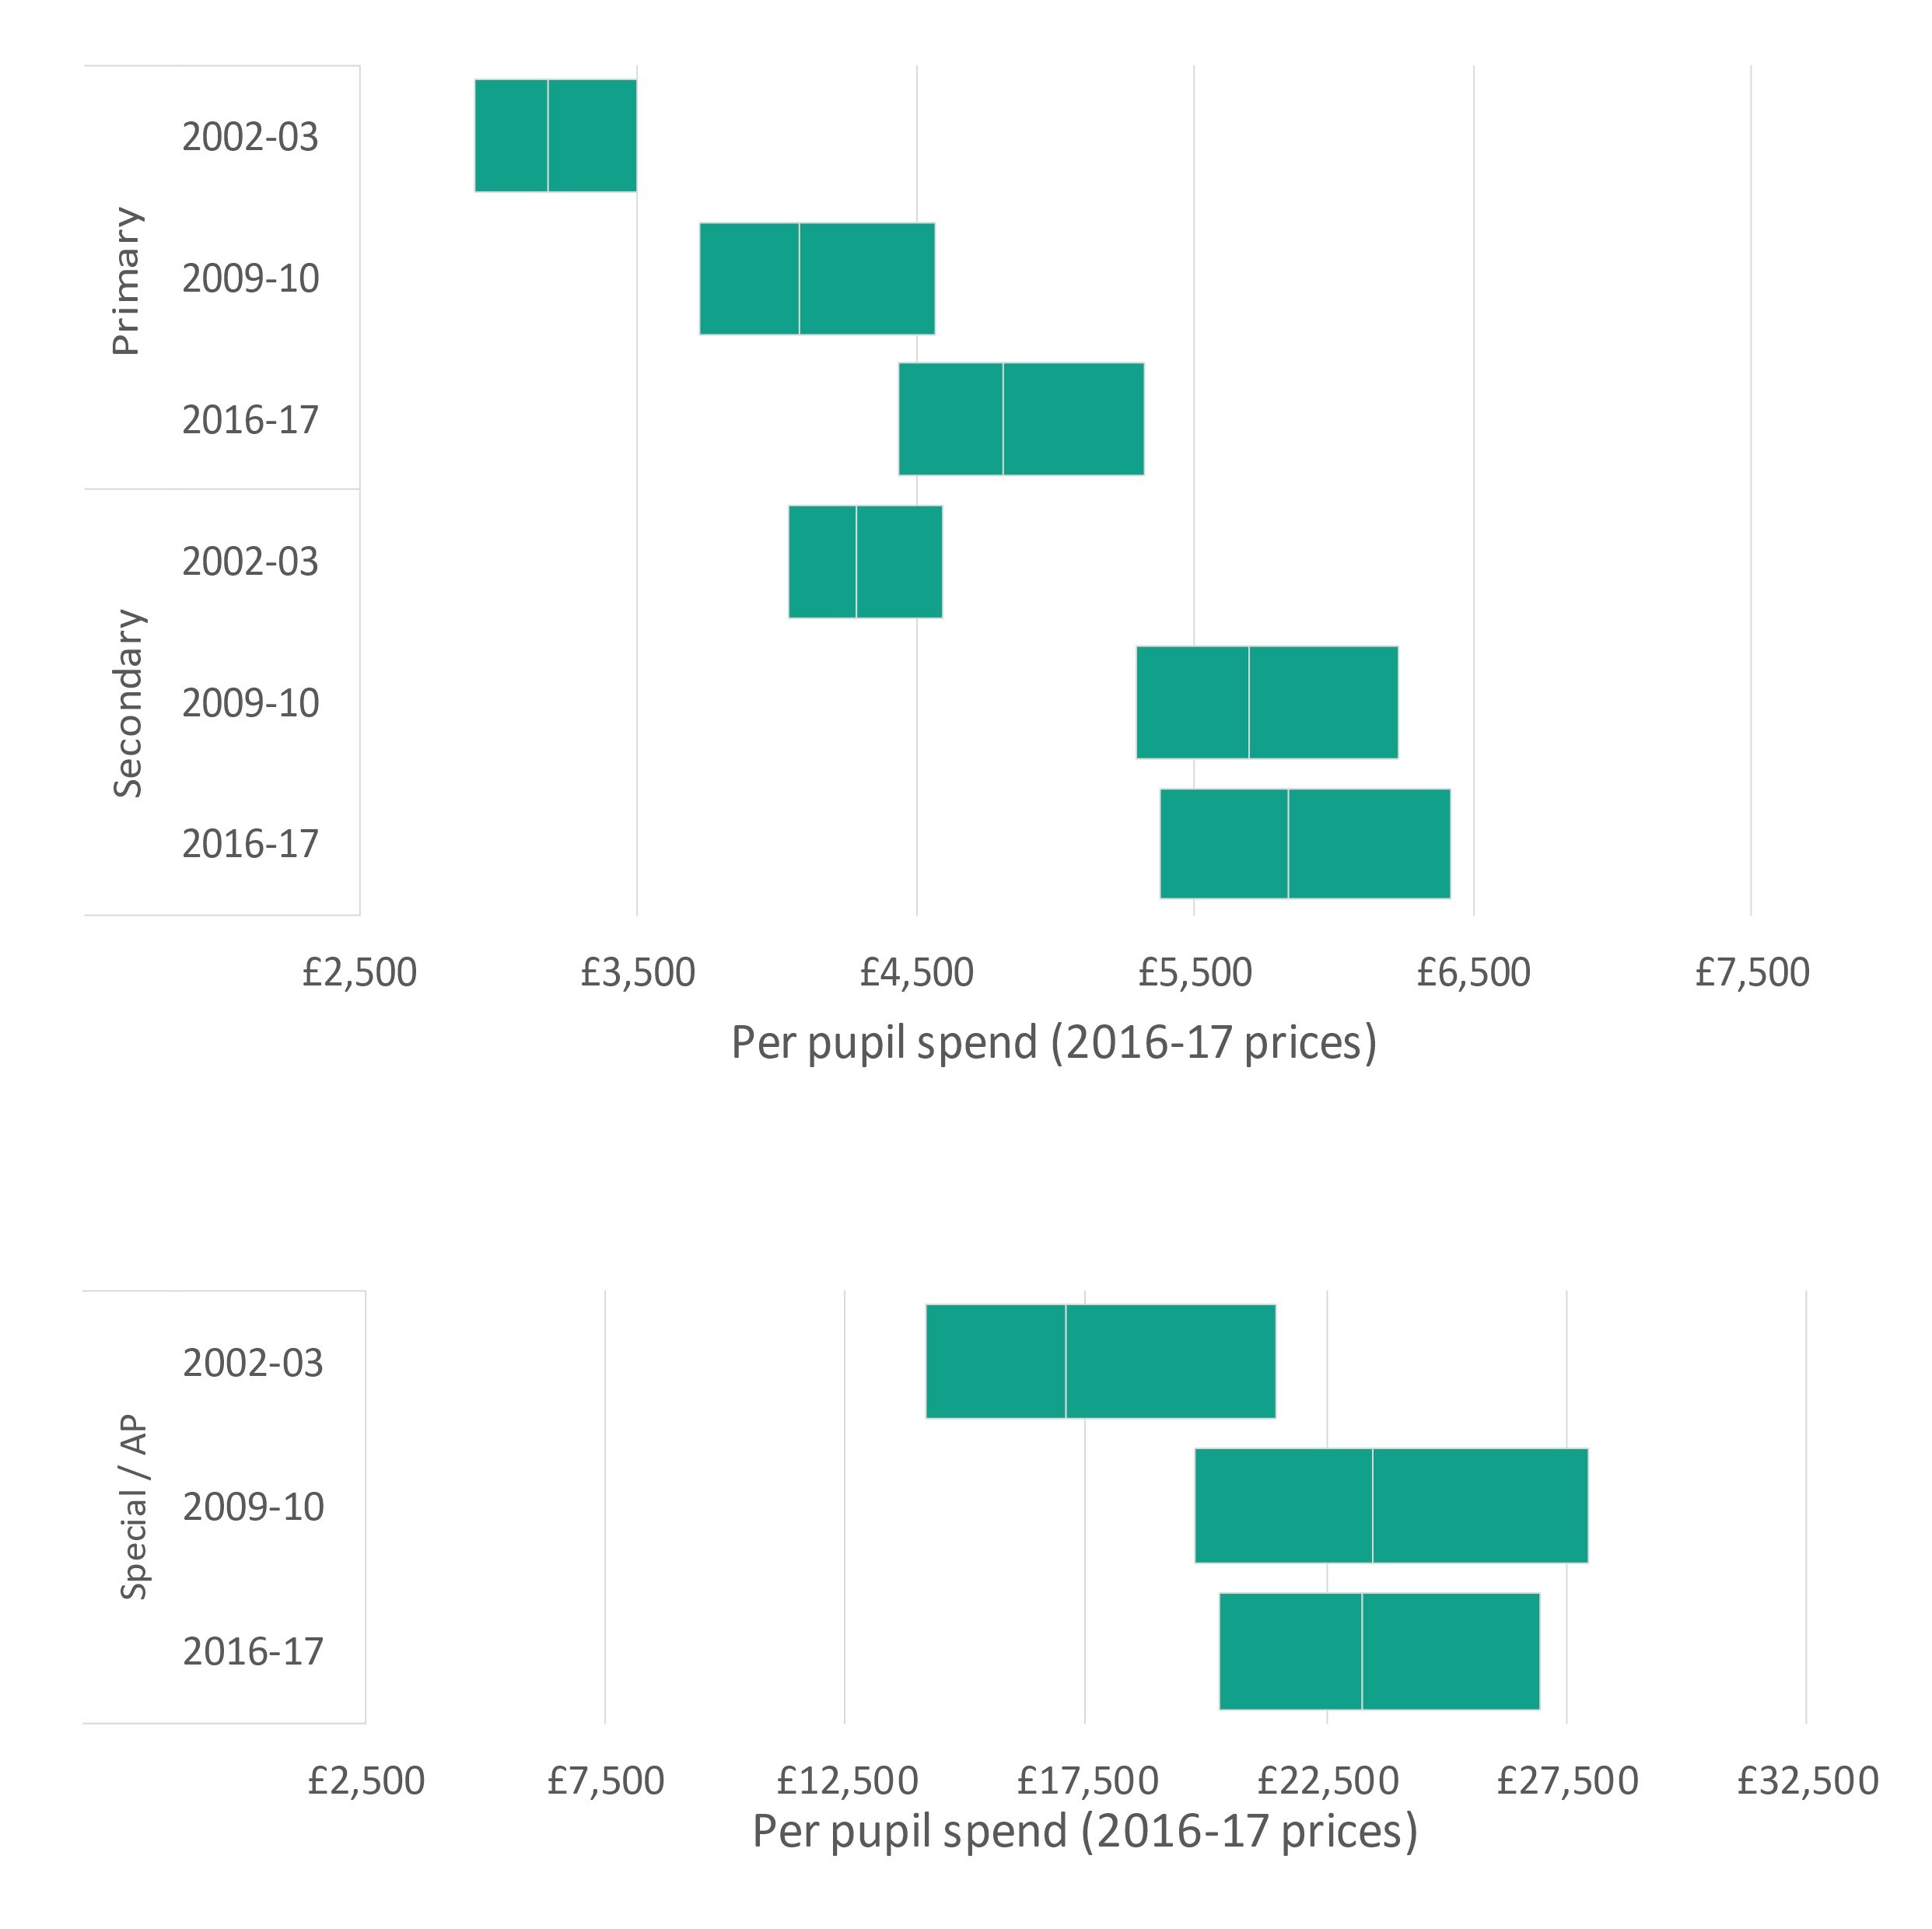
Figure 3 shows the distribution (lower quartile, median, and upper quartile) of per pupil expenditure in primary schools, secondary schools, and special schools, PRUs, and alternative provision in 2002-03, 2009-10, 2016-17. All figures are given in 2016-17 prices.
In our earlier paper, we saw that overall per pupil expenditure was 42 per cent higher in 2016-17 than in 2002-03. In this latest analysis, we find that:
- Median per pupil expenditure has increased in all phases, but most rapidly in primary schools (an increase of 51 per cent).
- In 2002-03, median per pupil expenditure in primary schools was £3,200. By 2009-10 it had increased to £4,100, and by 2016-17 it had risen further to £4,800.
- While expenditure in secondary schools has also risen, it has done so less consistently with large increases between 2003 and 2010 – from £4,290 to £5,690 – before a very modest increase in median expenditure of £140 between 2010 and 2017. Overall, from 2003 to 2017, this amounts to a 36 per cent increase at secondary).
- Median per pupil expenditure in special schools actually fell slightly between 2010 and 2017, having increased before that. In 2002-03 the median expenditure was £17,100, rising to £23,500 in 2009-10, falling slightly to £23,300 in 2016-17.
Per pupil expenditure increased significantly across all schools, meaning that even the lowest spenders in 2016-17 were spending more than the relatively high spending of 2002-03. For example, amongst primary schools, the lower quartile in 2017 was £4,400, 27 per cent higher than the upper quartile of 2003 (£3,500). In secondary schools, the lower quartile in 2017 was 55 per cent higher than the upper quartile from 2003.
Figure 3: Variation (lower quartile, median, and upper quartile) in total per-pupil expenditure 2002-03, 2009-10 and 2016-17 – primary and secondary schools (above) and special schools and alternative provision (below)
We see from the analysis above that there is wide variation in per pupil expenditure between schools, we also saw that there is variation in how schools with different characteristics are funded. We now consider how school expenditure varies by the characteristics of the school – such as level of disadvantage, and proportion of pupils for whom English is an additional language. We also consider structural features of schools – e.g. what kind of academy trust they are part of, and the rate of academisation in an area.[5] Such factors are correlated with some of the characteristics (e.g. academies in large ‘system leader’ trusts are more likely to have high levels of disadvantage) but factors associated with the structure itself may also influence the way schools are managing resources.
Figure 4 (primary) and Figure 5 (secondary) show the median expenditure per pupil in 2016-17 by school characteristics. The relative position of different characteristics is as expected given the way schools are funded – schools with higher levels of disadvantage and schools in London spend well above the average of all schools. In fact, the median spend in these schools is at or above the upper quartile of all schools.
Figure 4: Median per pupil spend in primary schools by structural features and school characteristics (quartiles across all schools shown)
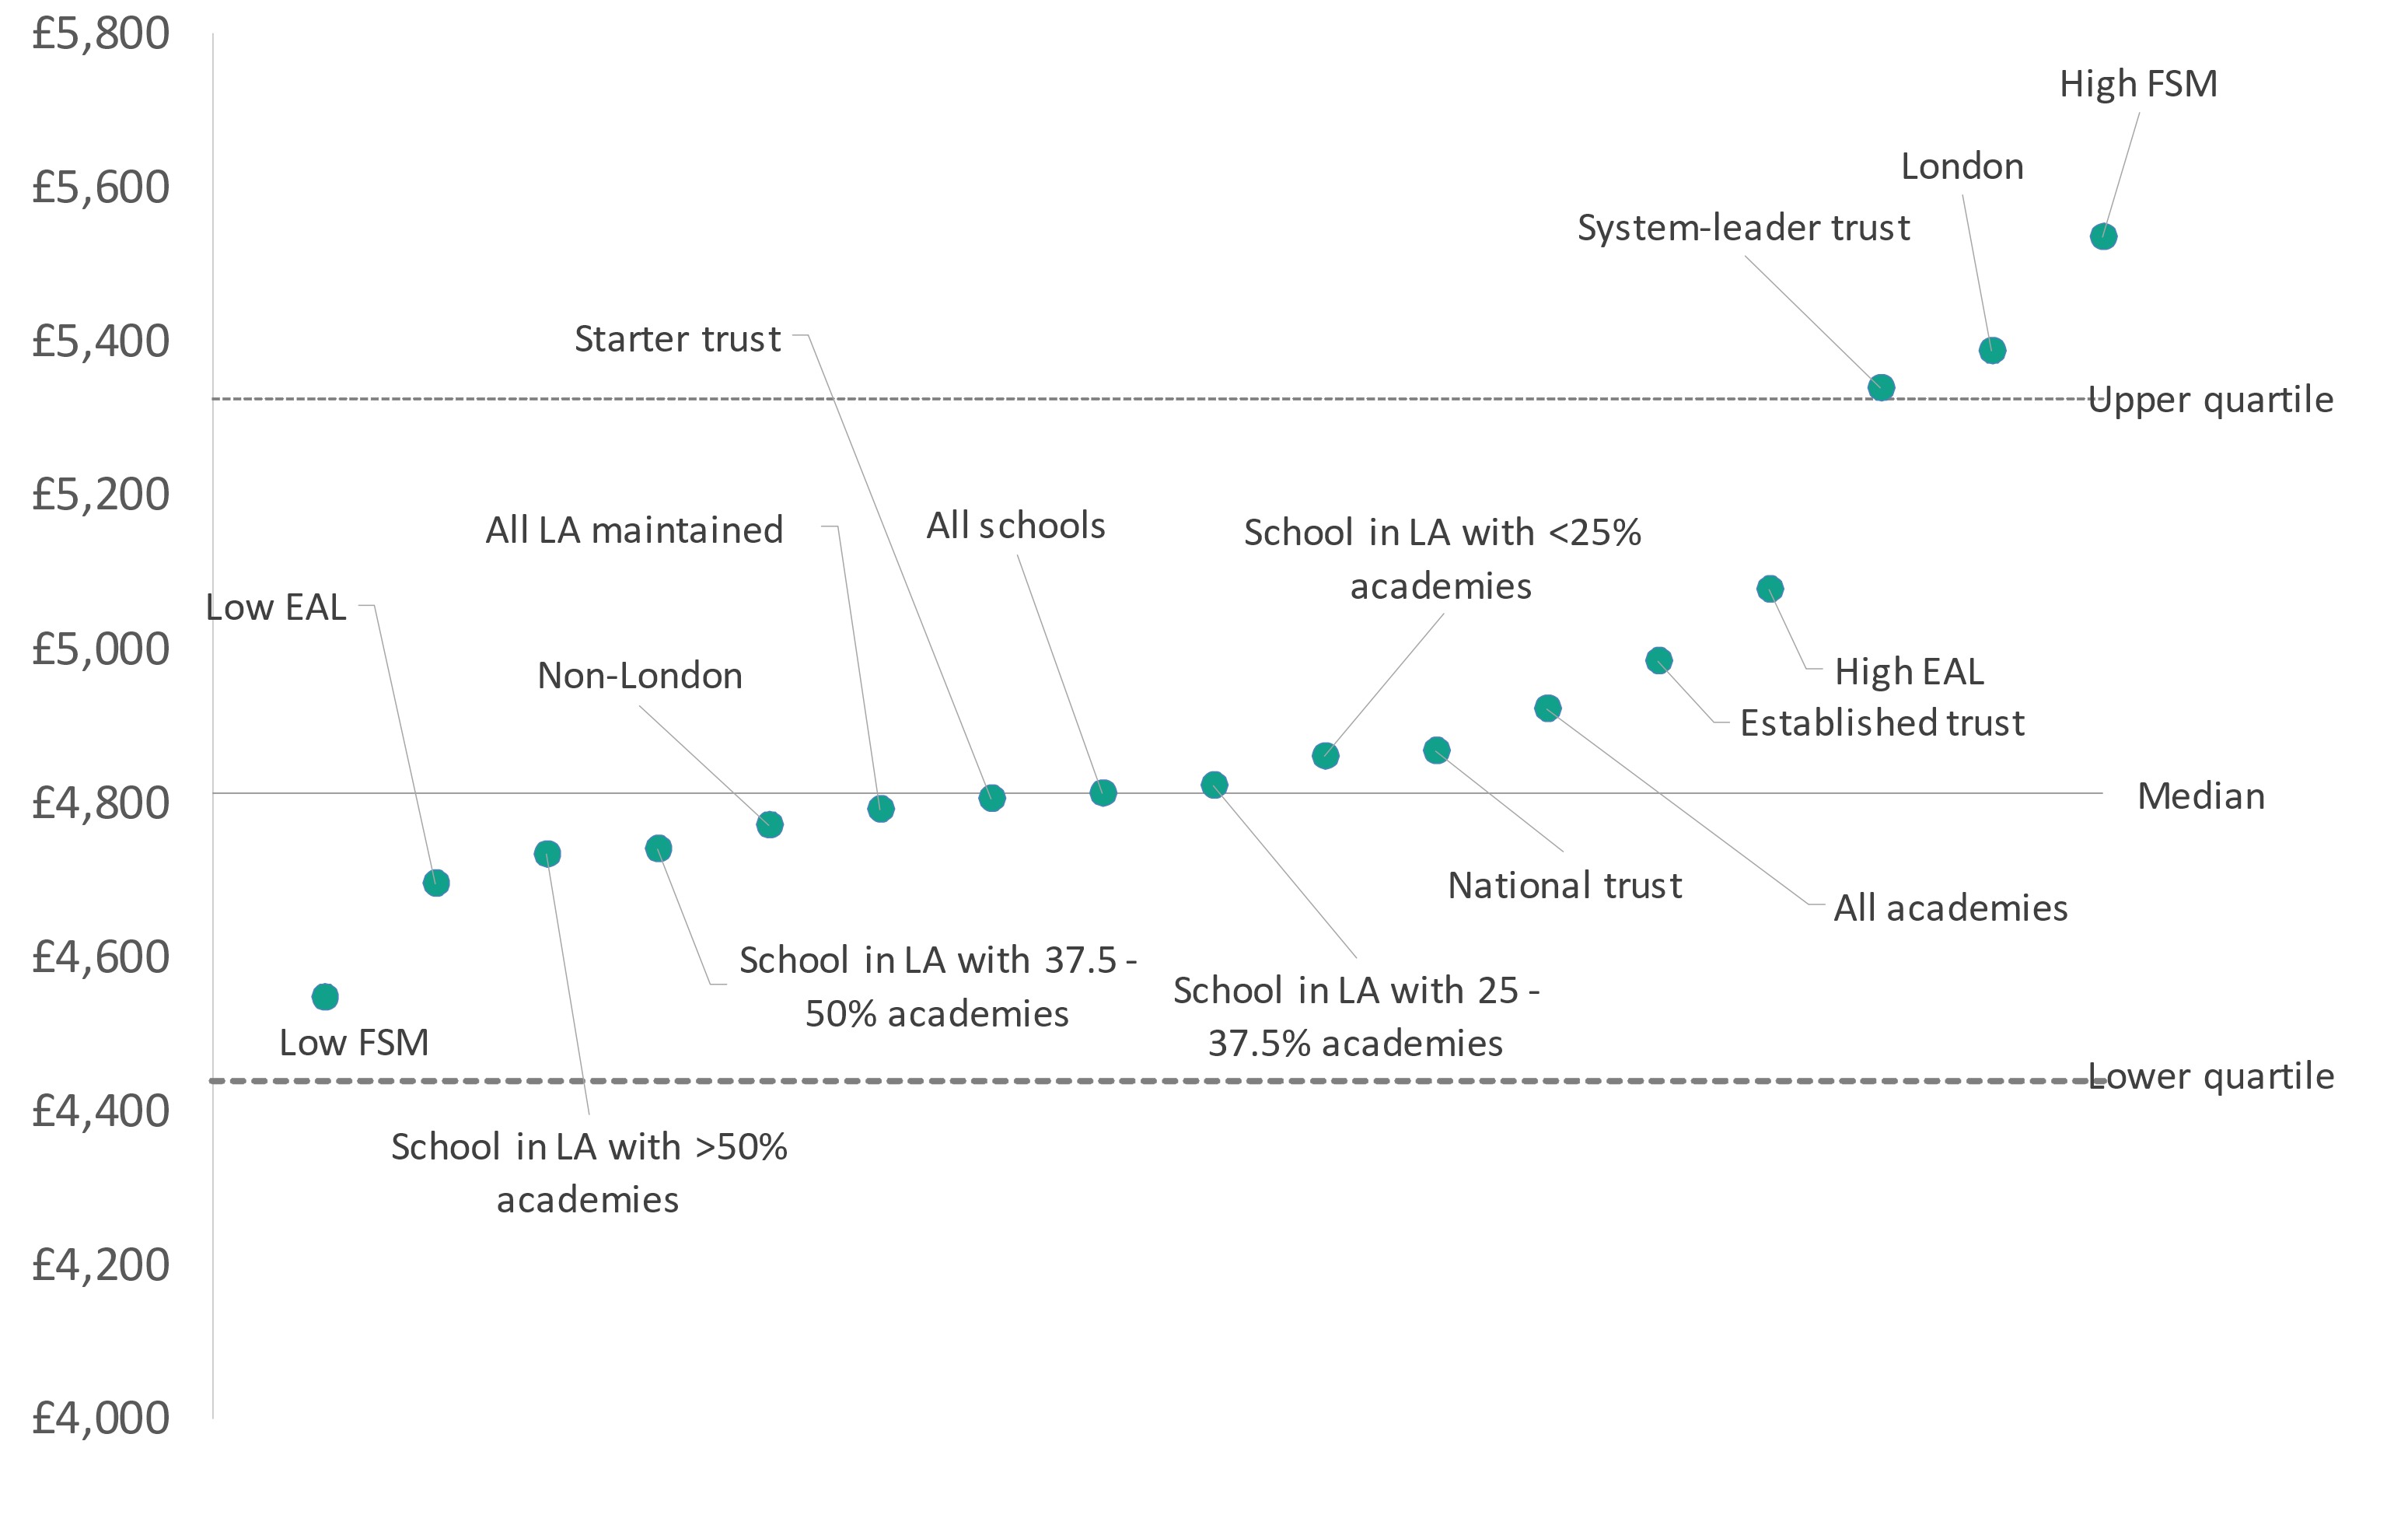
Figure 5: Median per pupil spend in secondary schools by structural features and disadvantage (quartiles across all schools shown)
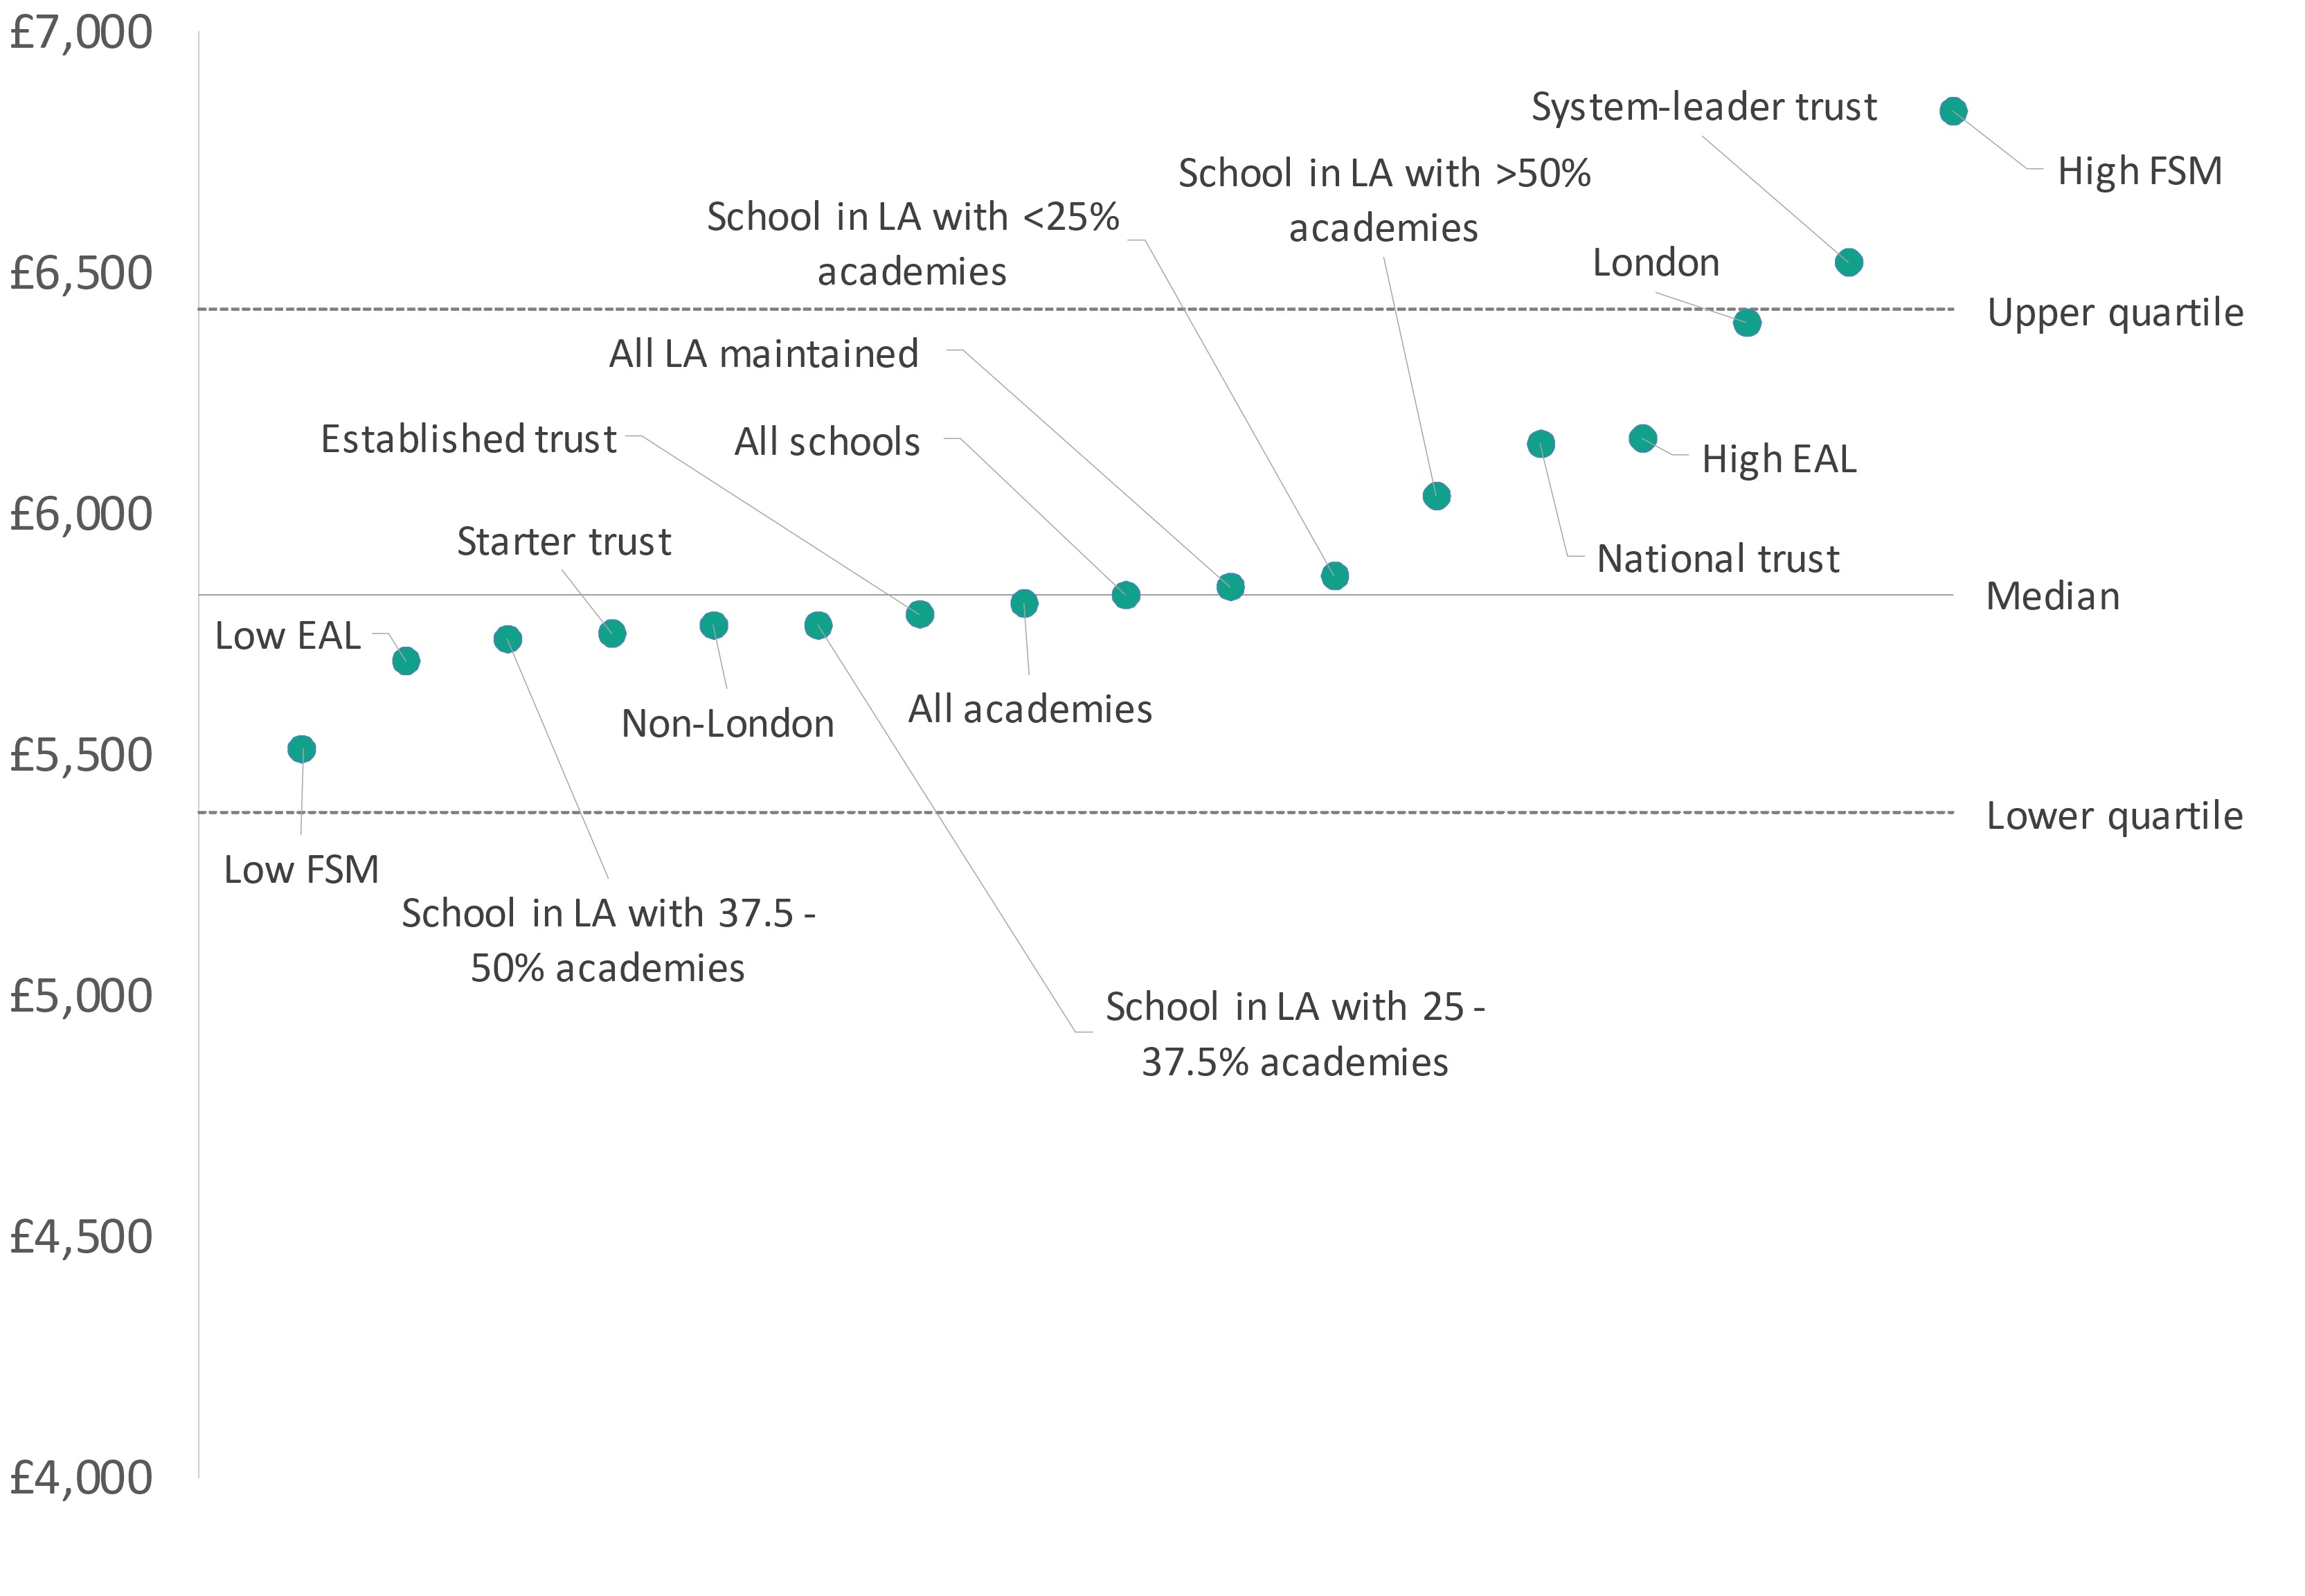
We can also see that schools in system-leader academy trusts are spending more per pupil than the average – in fact they are above the upper quartile for both primary and secondary. But this is likely to be because of factors other than school structures. This is because the funding system is essentially ‘blind’ to school type – in other words, the way that funding is allocated to schools relies on characteristics other than the school type, or the type of trust a school is in.
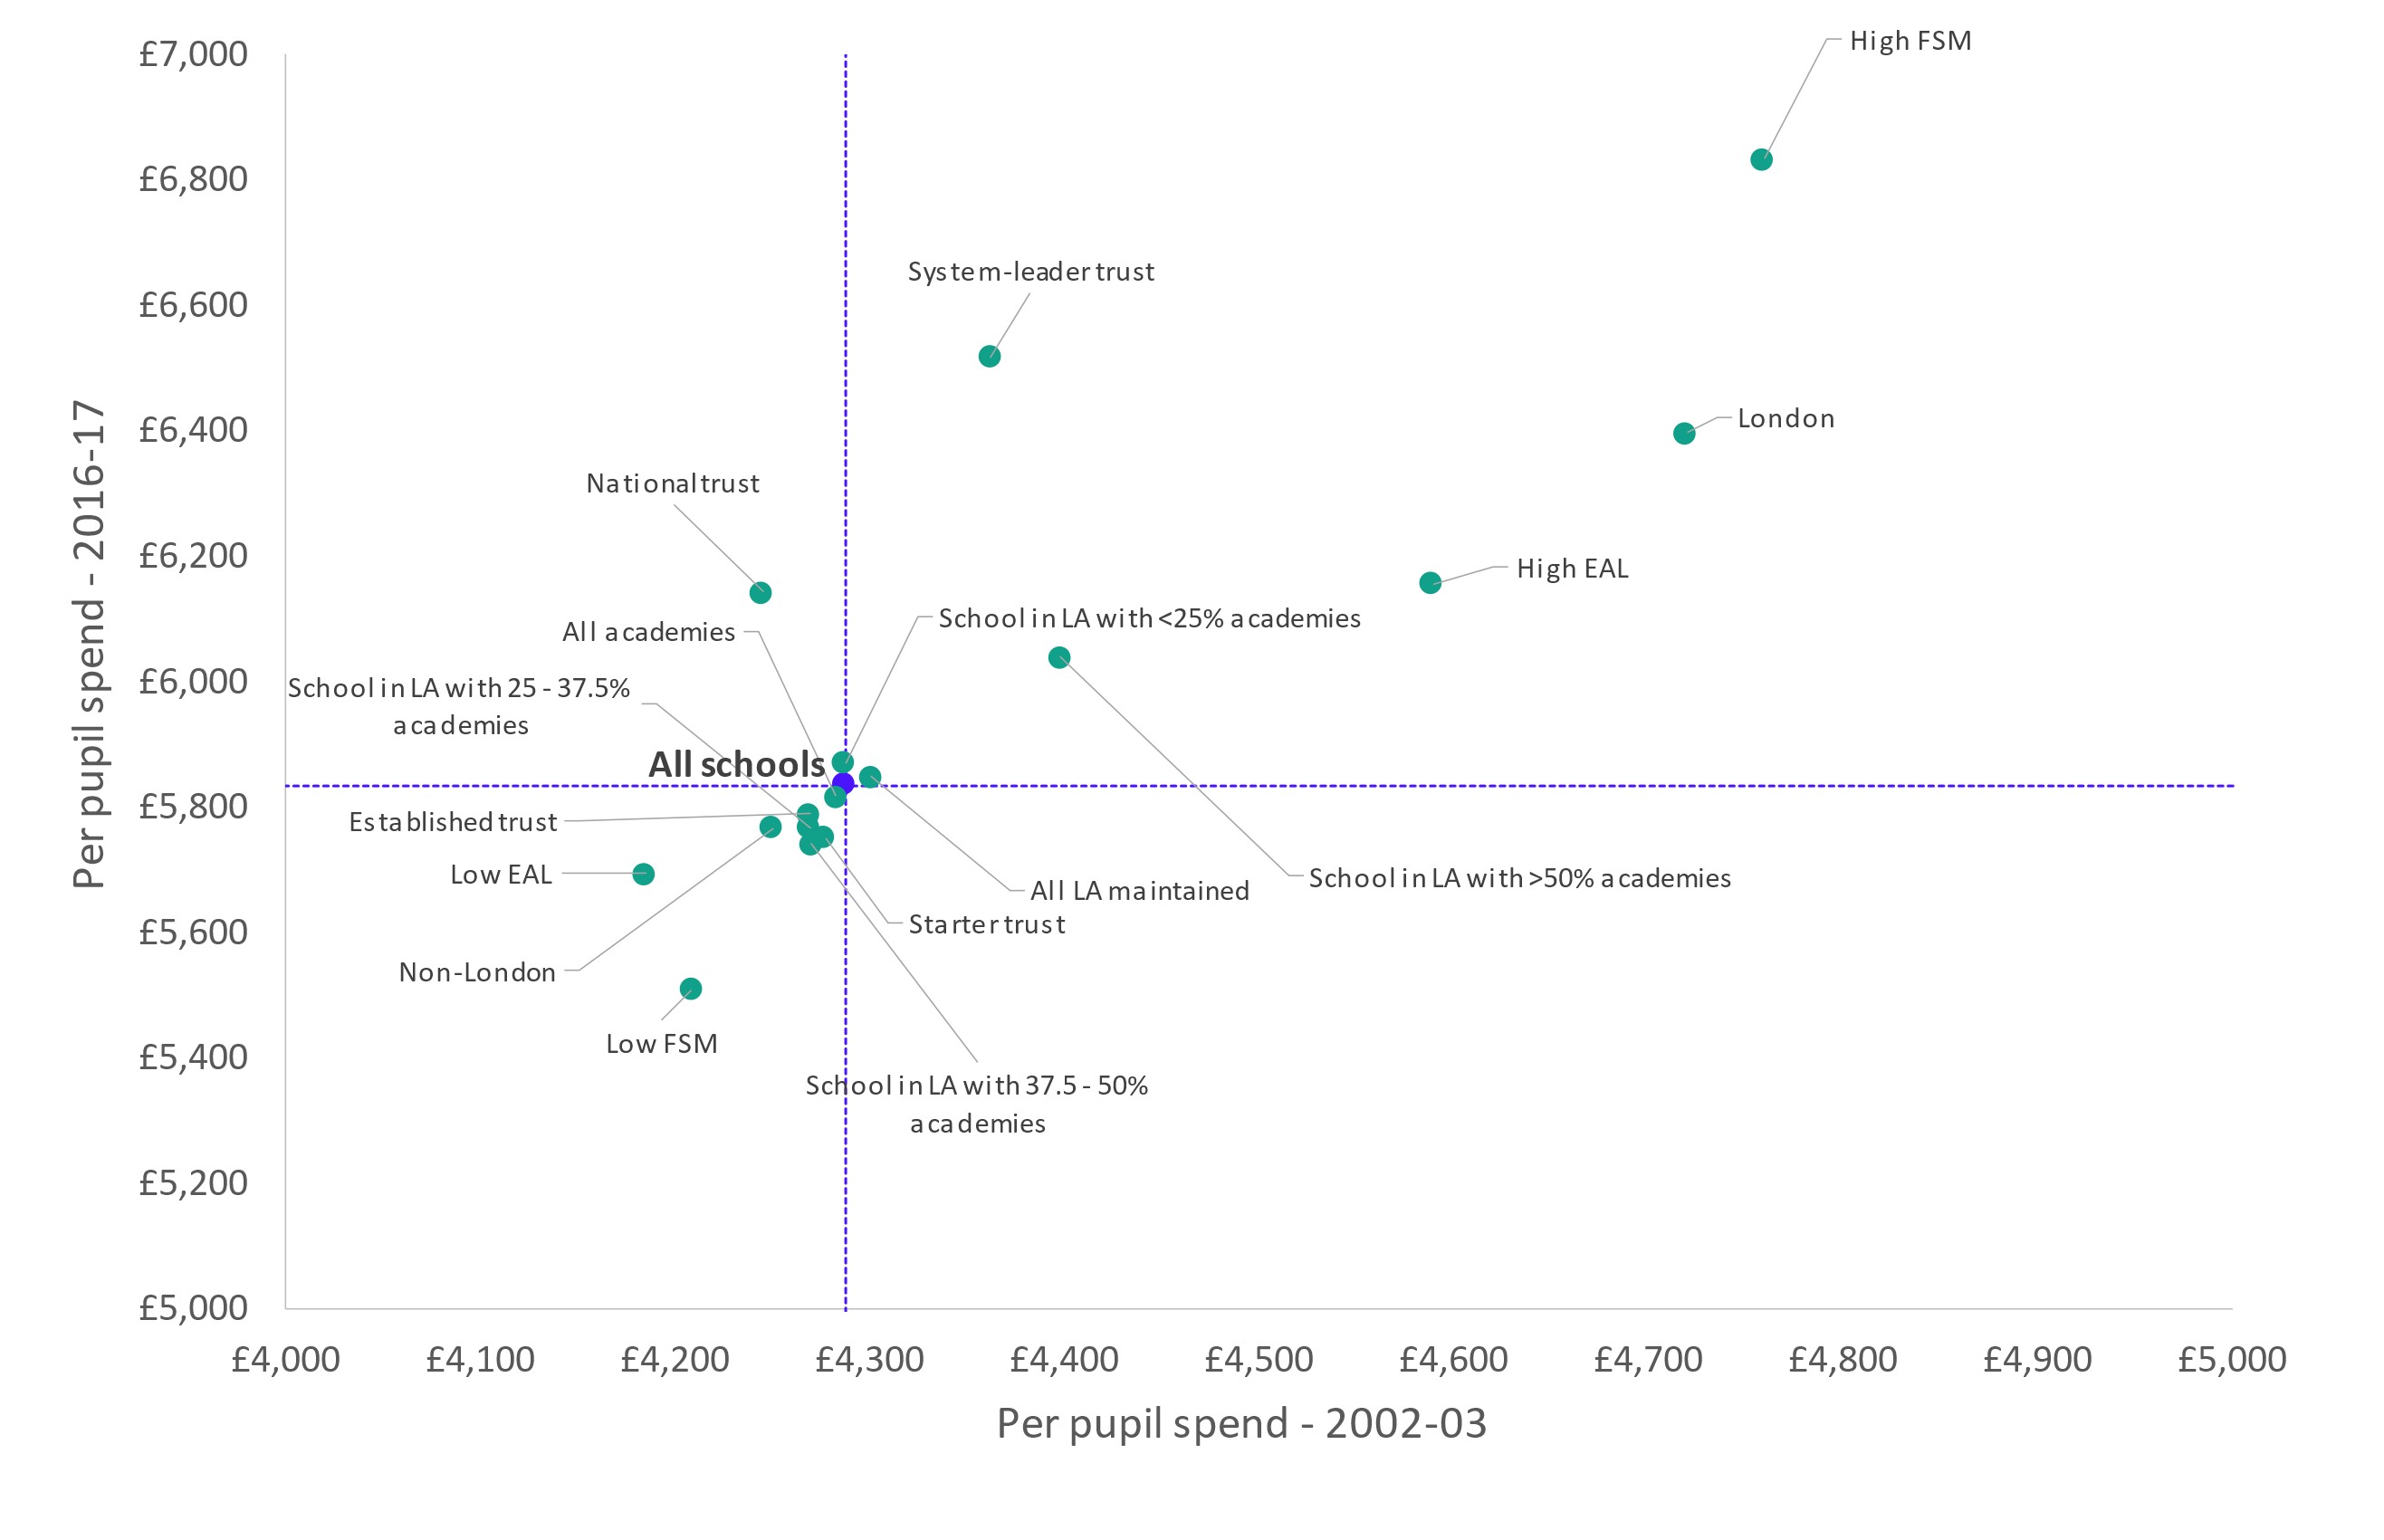
Another way of testing that is to compare expenditure in 2002-03 and 2016-17. This is because the 2002-03 spending pre-dates academisation for all schools in our sample (expenditure data was not collected for academies in 2002-03 and 2009-10 so any schools that were academies at that point are excluded from our data). In Figures 6 and 7 we plot the median expenditure by school characteristics in 2002-03 and 2016-17. We can see that schools that went on to join system leader trusts already had above average expenditure in 2002-03 – though the effect is notably much larger for primary than it is for secondary.
There is also a growing gap between schools with high and low levels of disadvantage (as we would expect from the changes to funding). In 2002-03 primary schools with high levels of eligibility for free school meals spent 11 per cent more than schools with low levels of FSM. By 2016-17 this had increased to 22 per cent. The equivalent figures for secondary schools were 13 per cent and 24 per cent.
Figure 6: Median per pupil spend in primary schools by structural features and disadvantage – comparison 2002-03 and 2016-17
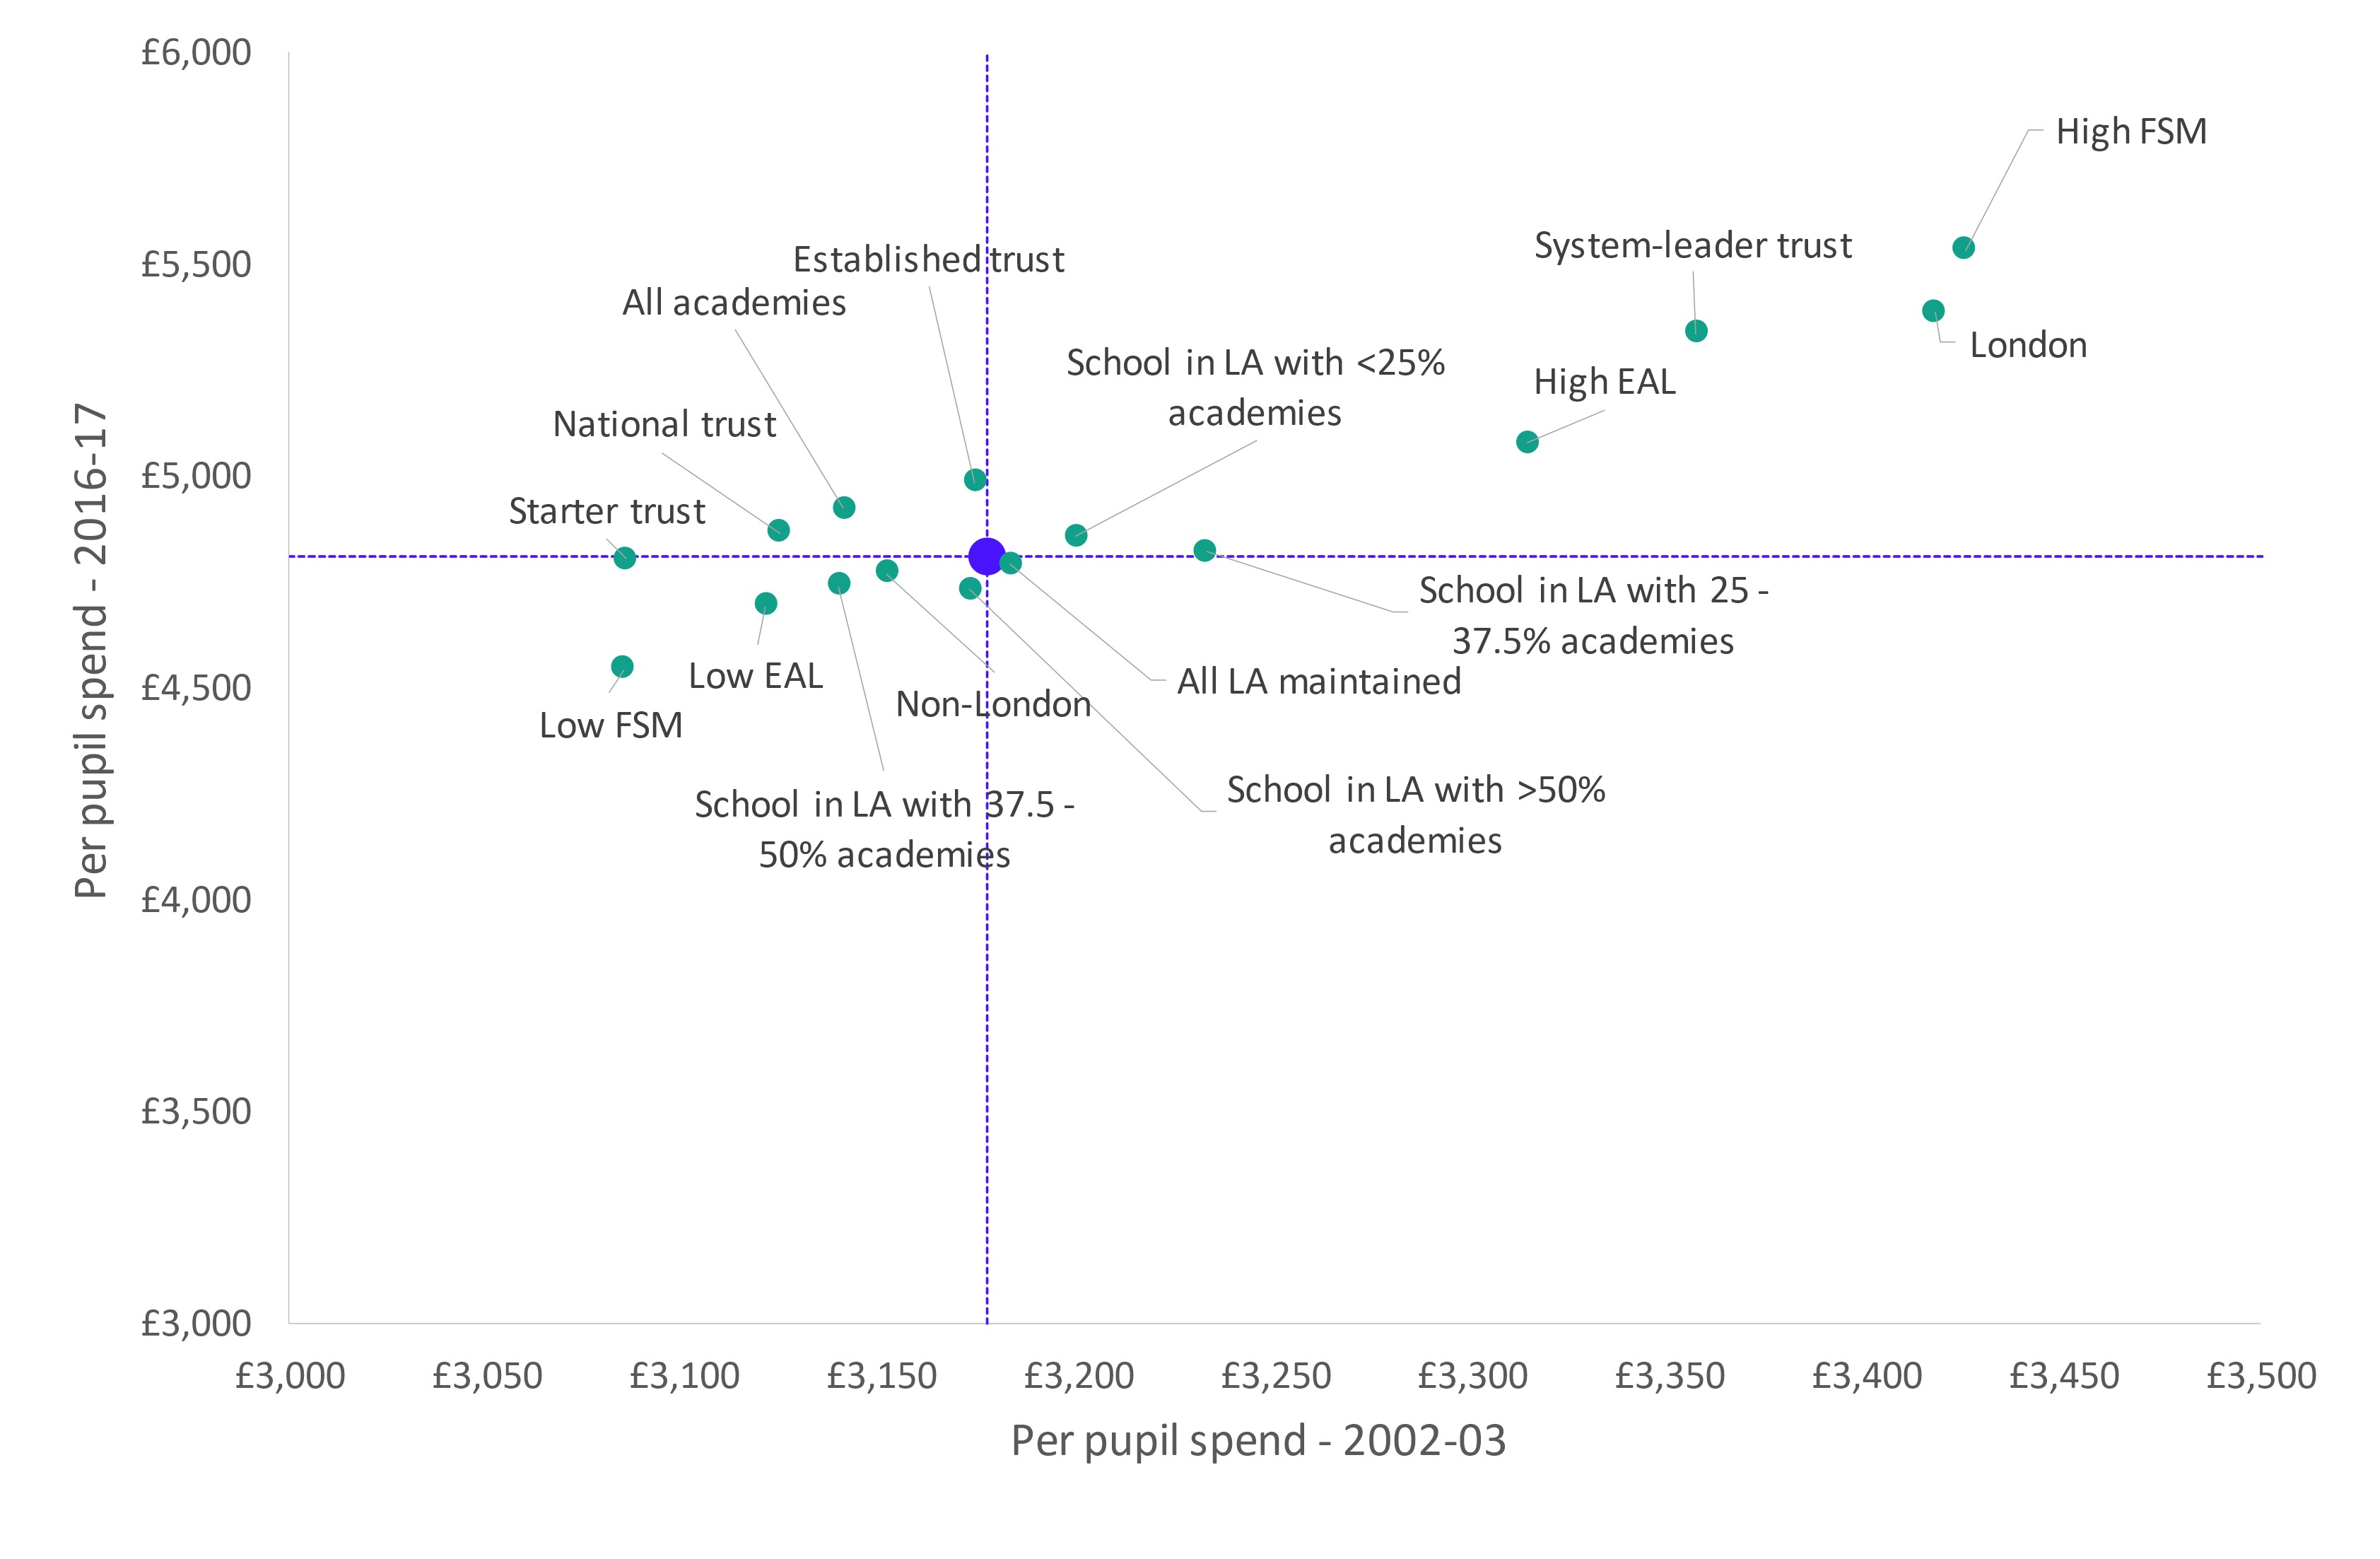
Figure 7: Median per pupil spend in secondary schools by structural features and disadvantage – comparison 2002-03 and 2016-17
Note that these gaps in expenditure between schools with high and low proportions of pupils eligible for free school meals are smaller than the gaps we found in school funding. This may in part be because of the differing patterns of income from sources beyond the DSG and the pupil premium.
For example, if for academies we look at income from donations, voluntary funds, and self-generated income we find that:
- Primary academies with low proportions of pupils eligible for free school meals generate an extra £200 per pupil whereas primary academies with high proportions of pupils eligible for free school meals generate around an extra £100 per pupil.
- Secondary academies with low proportions of pupils eligible for free school meals generate an extra £225 per pupil, secondary academies with high proportions of pupils eligible for free school meals generate around an extra £115.
The data for local authority maintained schools is not directly comparable. However it includes categories for contributions for visits, and donations and private funds. Across these categories we find that:
- Maintained primary schools with low proportions of pupils eligible for free school meals generate an extra £100 per pupil whereas maintained primaries with high proportions of pupils eligible for free school meals generate around an extra £40 per pupil.
- Maintained secondary schools with low proportions of pupils eligible for free school meals generate an extra £120 per pupil, maintained secondaries with high proportions of pupils eligible for free school meals generate around an extra £30.
These differing patterns of income may merit further investigation.
Many of the characteristics that we are considering overlap – for example, schools in system leader trusts are likely to have higher levels of disadvantage, schools in London are more likely to have pupils for whom English is an additional language.
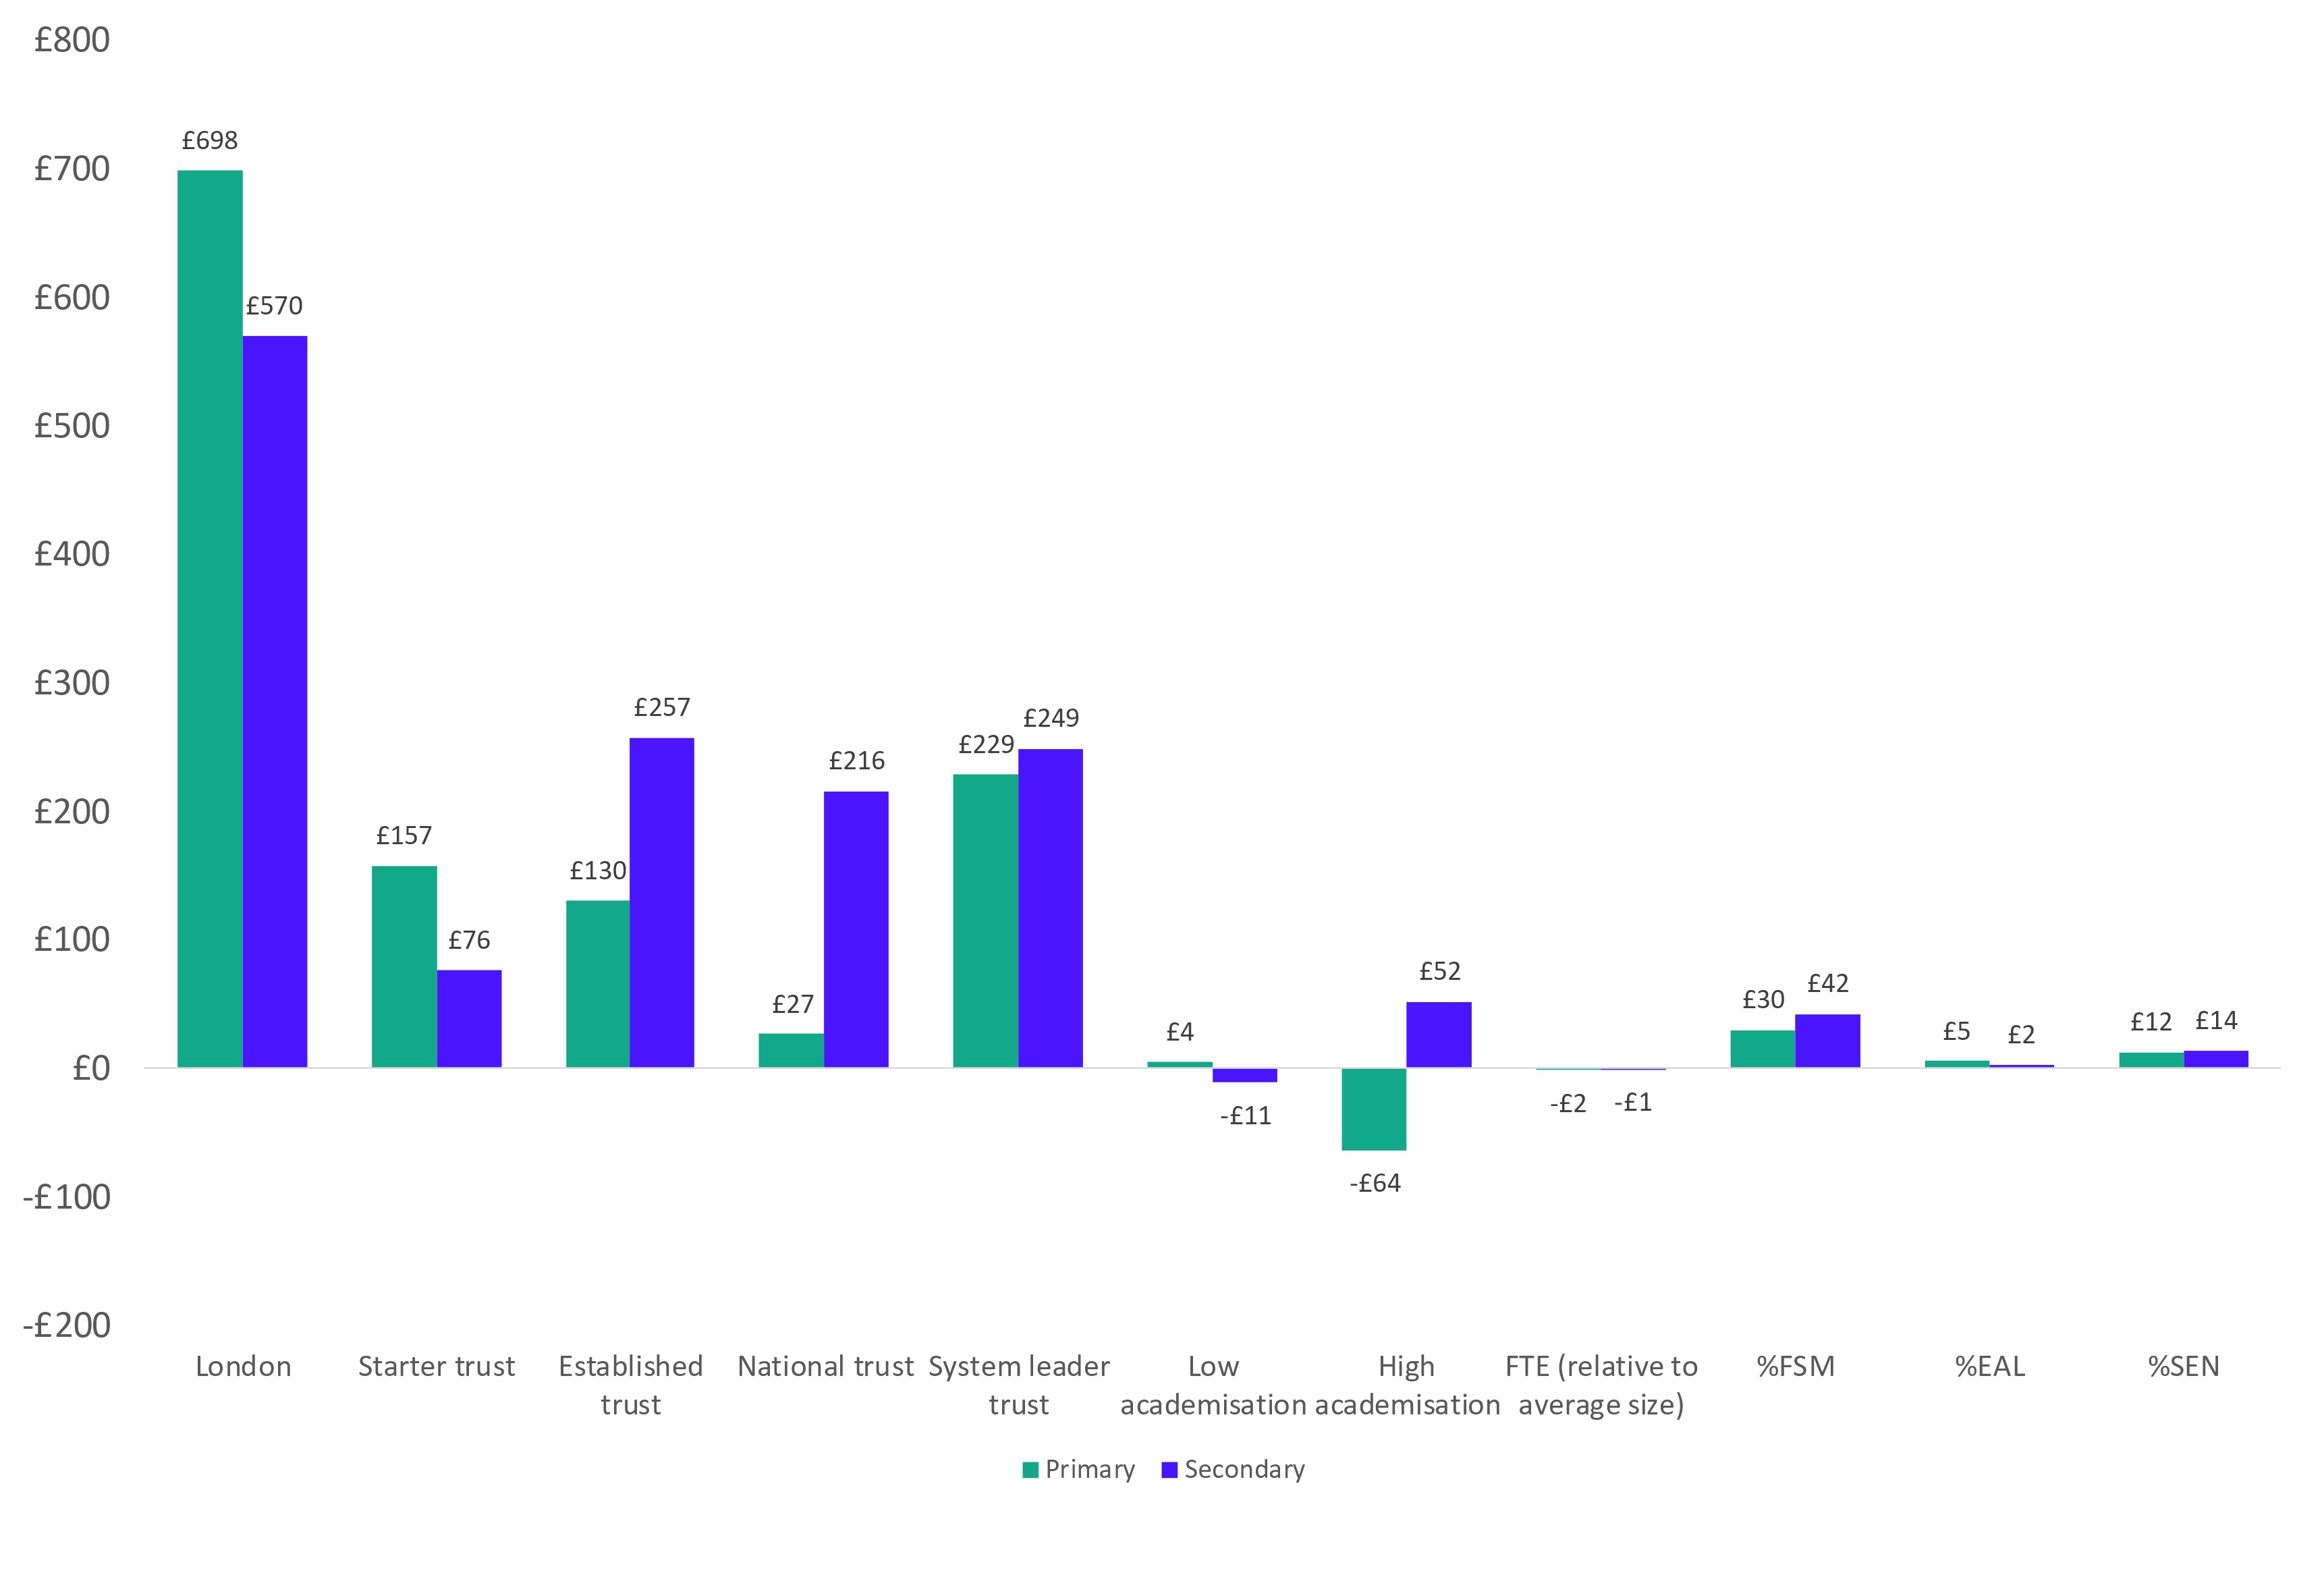
In Figure 8 we present the results of a regression model of per pupil expenditure against region (London or elsewhere), type of academy trust, academisation in the local authority, school size, FSM, EAL, and SEN. This is an attempt to isolate the effect of individual characteristics – i.e. all other things being equal, this is the effect of the individual factor – but it is likely that there are still many other things not included in the model that influence overall expenditure. With that caveat, we estimate that:
- Being a school in London means spending an extra £698 per pupil at primary, and £570 per pupil at secondary.
- Each percentage point increase in FSM eligibility equates to an additional £30 per pupil in primary and £42 per pupil in secondary. The effects for EAL and SEN are smaller.
- The effects of academy trust size are inconsistent, although they all spend more than schools that are not in academy trusts. Similarly, the level of academisation in an area has different effects for primary and secondary schools. Secondary schools in highly academised areas tend to spend more per pupil than other schools, but primary schools actually spend less (note that these effects are for local authority maintained schools only).
Figure 8: Effect of each characteristic on overall per pupil spend in 2016-17 (regression coefficients of linear regression model with all listed characteristics)
Conclusion
This analysis has provided an overview of how the characteristics of schools affects their level of per pupil funding and hence their overall expenditure. Secondary schools attract more funding than primary schools, schools in London attract more funding than schools elsewhere and schools with high levels of disadvantage (as measured by eligibility for free school meals) attract more funding than schools with more affluent intakes. In subsequent posts we will consider what schools are spending that funding on and how these patterns have changed over time.
[1] The schools block is the core funding that a school receives via the Dedicated Schools Grant (DSG) and excludes any funding received for pupils with additional needs (delivered instead via the high needs block). The schools block covers state-funded mainstream schools only; special schools, alternative provision, and hospital schools are funded separately.
[2] Throughout this analysis, schools with low proportions of disadvantaged pupils are defined as those with than less than 10 per cent of the pupil population on free school meals (FSM). Schools with high proportions are those with more than 25 per cent of the population on FSM.
[3] We have based this on income across four income categories: I01 – funds delegated by the local authority; I04 – funding for minority ethnic pupils; I05 – Standards Fund; I06 – Other government grants
[4] The subset of primary schools have a lower median expenditure than that in the complete dataset in 2002-03, secondaries are broadly in line. The overall percentage increases (combining primary, secondary, and special schools) are broadly in line with those discussed in part 1, i.e. around 42 per cent between 2002-03 and 2016-17.
[5] Which may affect how the local authority operates with its remaining schools.

