Today sees the publication of the primary school performance tables providing school by school results of the Key Stage 2 assessments in 2018 and statistics on attainment by different pupil characteristics. In this note we take a look at some of the key findings.
Overall results
This is the third year of results based on the new national curriculum and assessments with scaled scores rather than levels.[1] Whilst we would now expect that there has been sufficient time for the bedding down of the new curriculum, the Department for Education (DfE) continues to caution against making direct comparisons with previous years using the expected standard in reading, writing, and mathematics measure due to further revisions to writing assessments this year.[2]
Nevertheless, 64 per cent of pupils achieved the expected standard in each of the reading, writing and mathematics assessments in 2018, representing an increase of 3 percentage points on last year and 11 percentage points since their introduction in 2016. This trend is likely to largely reflect schools and teachers adapting to the new curriculum and assessments rather than a step change in standards.
Intervention in underperforming schools
Traditionally the schools most affected by the performance tables are those determined by the DfE to be “underperforming” – with the Secretary of State having the power to issue an academy order and force those schools to convert to academy status.
In recent years schools have been subject to two standards. First, the long established ‘floor standard’. This is a minimum standard that all schools are expected to meet. The more recent initiative is the ‘coasting schools’ standard, designed to capture a set of schools where, over a three-year period, results have not necessarily been low but pupils have not progressed at the rate that they should.
The principle of having these two separate measures is reasonable, they are after all intended to challenge different types of underperformance with coasting schools focussed on “leafy areas with more advantages”.[3] However, our previous analysis has shown that this was not necessarily the case, with schools in disadvantaged areas still more likely to be captured than other schools.[4]
The Department for Education also accepts that the coasting measure has caused confusion and in May the Secretary of State announced that there would be a consultation to consider a new single measure.[5] Having been expected this autumn, that consultation has now been pushed back to the new year.
In the meantime, schools will only face forced academisation if they have been judged as inadequate by Ofsted and, instead, schools that are below the floor or coasting will be offered a package of support.[6]
Today’s statistical release shows that there are 364 primary schools that are below the floor standard, representing 3 per cent of eligible state-funded mainstream schools. This is a slight fall from last year.
A total of 640 schools met the coasting definition (an increase from 524 last year), of which 132 also met the floor standard definition. There is significant variation across the country in terms of the proportion of schools below the floor, with schools in London continuing to be far less likely than those elsewhere – just 8 of the capital’s 1,620 schools failed to meet the standard, less than 1 per cent.
Attainment by pupil characteristics
Our annual report, published in July this year, showed that by age 11, pupils from disadvantaged backgrounds are over 9 months behind their peers.[7] Whilst, according to the Department for Education’s measure, the gap between disadvantaged pupils and other pupils has narrowed slightly in 2018, on current trends it will still take decades to close.
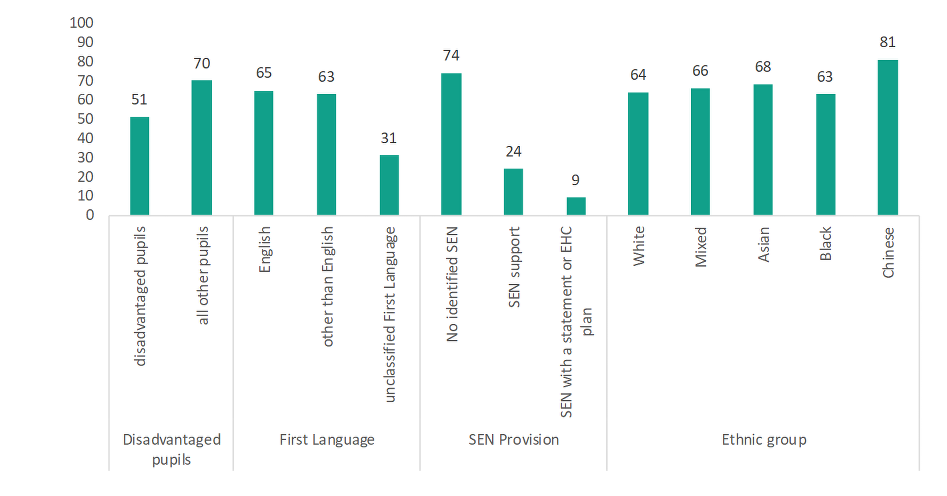
According to today’s data released by the DfE, in 2018, 51 per cent of pupils from disadvantaged backgrounds achieved the expected standard in reading, writing and mathematics compared with 70 per cent of other pupils. The gap is even more acute in particular parts of the country, with 46 per cent of disadvantaged pupils in the East of England and in the South West achieving the expected standard.
Pupils whose first language is other than English are only slightly behind those with English as their first language (63 per cent vs 65 per cent). However, our previous research has shown just how mixed the former group is and simple averages mask a huge variation in outcomes that is dependent on a complex mix of native language and length of time in the English school system.[8]
Chinese pupils continue to outperform all other groups (81 per cent achieving the expected standard) with pupils from Black backgrounds the lowest attaining of the major ethnic groups.
Less than a quarter of those identified in need of SEN support reach the standard and fewer than 1 in 10 of those with a statement or EHC plan do so. Whilst at any point a quarter of pupils are identified as having a special educational need, our analysis shows that 4 in 10 pupils will be identified as such at some point during their schooling.
Figure 1: Percentage of pupils achieving the expected standard in reading, writing and mathematics by pupil characteristics [9]
[1] This involves converting pupils’ raw marks to a score between 80 and 120, with 100 being the expected standard. The conversion differs for each subject, and can change each year to account for the difficulty of tests. It allows results to be accurately compared over time.
[2] Standards and Testing Agency (2017), ‘Teacher assessment frameworks at the end of key stage 2’,
[3] https://www.gov.uk/government/news/hundreds-of-coasting-schools-to-be-transformed
[4] https://epi.org.uk/publications-and-research/provisional-performance-tables-implications-intervention/
[5] https://www.gov.uk/government/news/education-secretary-to-set-out-vision-for-clearer-school-system
[6] https://www.tes.com/news/ps16k-schools-rated-requires-improvement-twice
[7] https://epi.org.uk/publications-and-research/annual-report-2018/
[8] https://epi.org.uk/publications-and-research/educational-outcomes-children-english-additional-language/
[9] DfE (2018), Key Stage 2 and multi-academy trust performance 2018 (revised), Table N7A