EPI’s James Zuccollo examines how the Teachers’ Pay Grant is allocated to schools, and whether it is done so equitably.
In July 2018, the government announced that teachers would get a pay rise after eight years of freezes and caps. The Department for Education simultaneously announced that it would increase schools’ funding by £508 million over the next year and a half to cover much of the cost. This month it released details of how that additional funding would be distributed to schools.
Those operational details are rarely the stuff of headlines but they matter greatly for headteachers and governing bodies as they attempt to balance the books. Our analysis finds that the department’s choices will cause schools with high levels of disadvantage or small class sizes to be less likely to receive enough additional funding to cover the cost of their teachers’ pay rise. The reason why disadvantaged schools and schools with smaller class sizes will receive less is complicated but illustrates the importance of policy implementation.
The critical allocation decisions
The government’s headline pay award lifted the main pay scale by 3.5 per cent, the upper pay scale by 2 per cent and the leadership pay range by 1.5 per cent. It does not automatically increase teachers’ salaries as they are not paid directly by the government but the intention is that all teachers will get a pay rise. There are more teachers on the lower pay scales so mainstream schools’ salary costs are likely to rise by about 2.9 per cent, on average. The department believes schools should have already budgeted for a 1 per cent increase so it has provided grant funding to cover the additional 1.9 per cent.
There are plenty of complications in the way funding is distributed so it is easiest to understand the method by focusing on mainstream primary and secondary schools. For those schools, the new grant funding is distributed at a fixed rate of about £30 per pupil each year with some differences to accommodate the pay regions – inner London, outer London, the London fringe and the rest of England – and phases of education.
In the dry detail of that method is a critical decision: choosing to allocate funding according to the number of pupils at a school. It is not necessarily the wrong choice; however, the consequence is that not every school will receive funding for the full increase in its wage bill (over the unfunded 1 per cent) and some schools are likely to receive more than they need to meet the cost of the pay rise.
The second important decision is that they have chosen to fund each school for a minimum of 100 pupils. That means a school of only 65 pupils will receive additional funding equal to that of a school of 100 pupils. The department have not explicitly justified this choice but it seems likely that the goal is to protect small schools that are constrained to have very few pupils in each class.
Estimating the effect of funding by number of pupils
Estimating which schools will be affected is not straightforward as school finances and workforce data for the 2018-19 year will not be available until the end of the year. Instead, we have constructed a mock allocation using 2016-17 financial returns, pupil numbers and workforce data. The numbers will not match up to 2018-19 precisely but, unless spending or workforce patterns have changed dramatically in the interim, the distribution of the funding across schools should end up looking similar. Results for individual schools are unlikely to be meaningful as we are estimating both the allocation and the increase in staff costs, so our analysis focusses on the distribution of allocations and pay increases, rather than on any specific school, MAT or local authority.
To avoid confusion over the numerical differences between 2016-17 and 2018-19 spending figures, the results are presented as a difference between the additional grant and the additional cost beyond the expected 1 per cent. For example, a difference of 0 per cent means that the school’s estimated additional funding matches the estimated additional salary costs beyond the 1 per cent. Similarly, a difference of 50 per cent means that the funding is 50 per cent higher than the increase in salary costs.
Finally, we restrict our analysis to the mainstream primary and secondary schools that returned sufficient unsuppressed data in 2016-17 to calculate allocations and the cost of a salary increase. Smaller schools often have leadership teams with too few members for the department to report on without compromising individuals’ anonymity. For that reason our dataset contains only about 1,800 primary and 2,100 secondary schools, most of which tend to be larger than the average school. We have repeated our analysis using a large sample of 19,000 schools, but with less accurate methods, and found similar results.
The variation in schools’ funding
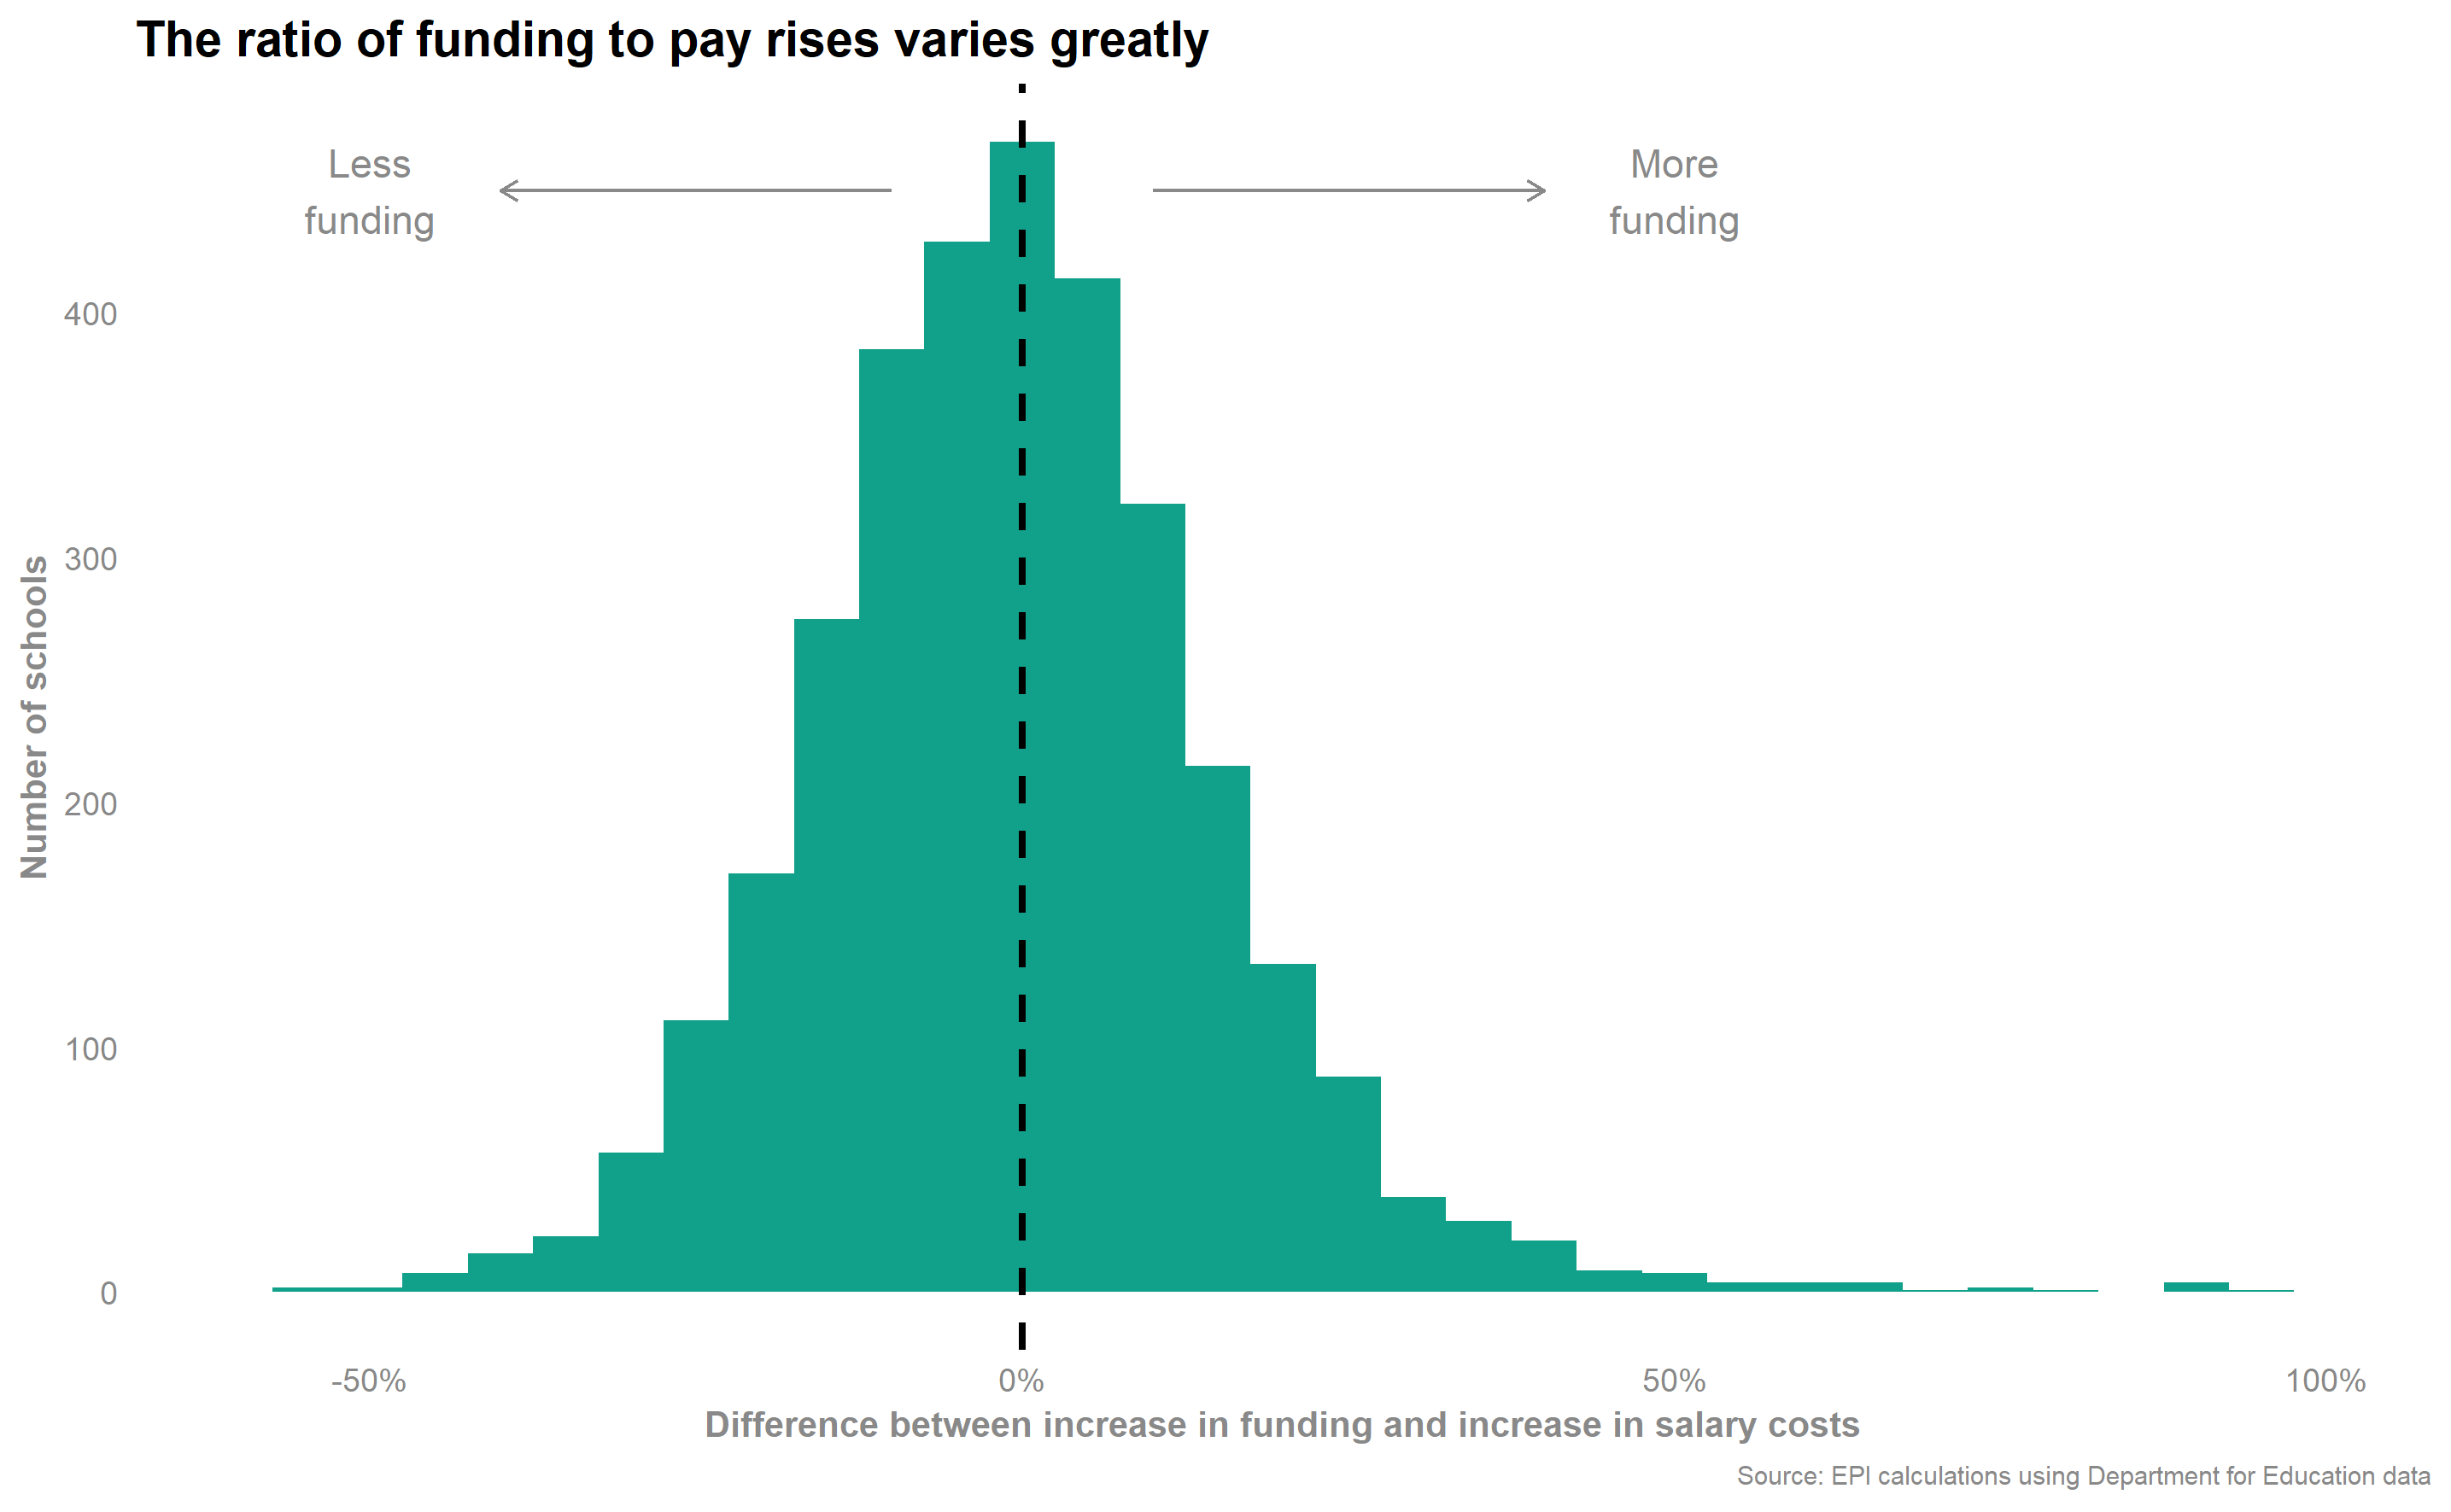
The figure below shows our estimate of the funding allocated to schools, relative to their costs. We find that:
- 33 per cent of schools receive between 5 and 25 per cent less than the cost of the salary increase;
- 29 per cent of schools receive between 5 and 25 per cent more than the cost of the salary increase;
- 6 per cent of schools receive over 25 per cent less;
- 6 per cent of schools receive over 25 per cent more; and
- 27 per cent of schools receive within 5 per cent of their costs.
Figure 1: The distribution of funding
The main reason for the variation is the distribution of teaching staff across the main, upper and leadership pay scales. Main pay scale staff receive a far greater pay rise than upper pay scale and leadership pay scale staff. Consequently, schools with a greater percentage of staff on the main pay scale tend to suffer. Those tend to be schools with fewer experienced staff members, and middle and senior leaders.
A second reason for the variation is differences in pupil:teacher ratios. Pupils are funded at the same rate in all schools so the more pupils to each teacher, the greater the size of the school’s pay grant relative to the increase in salary costs.
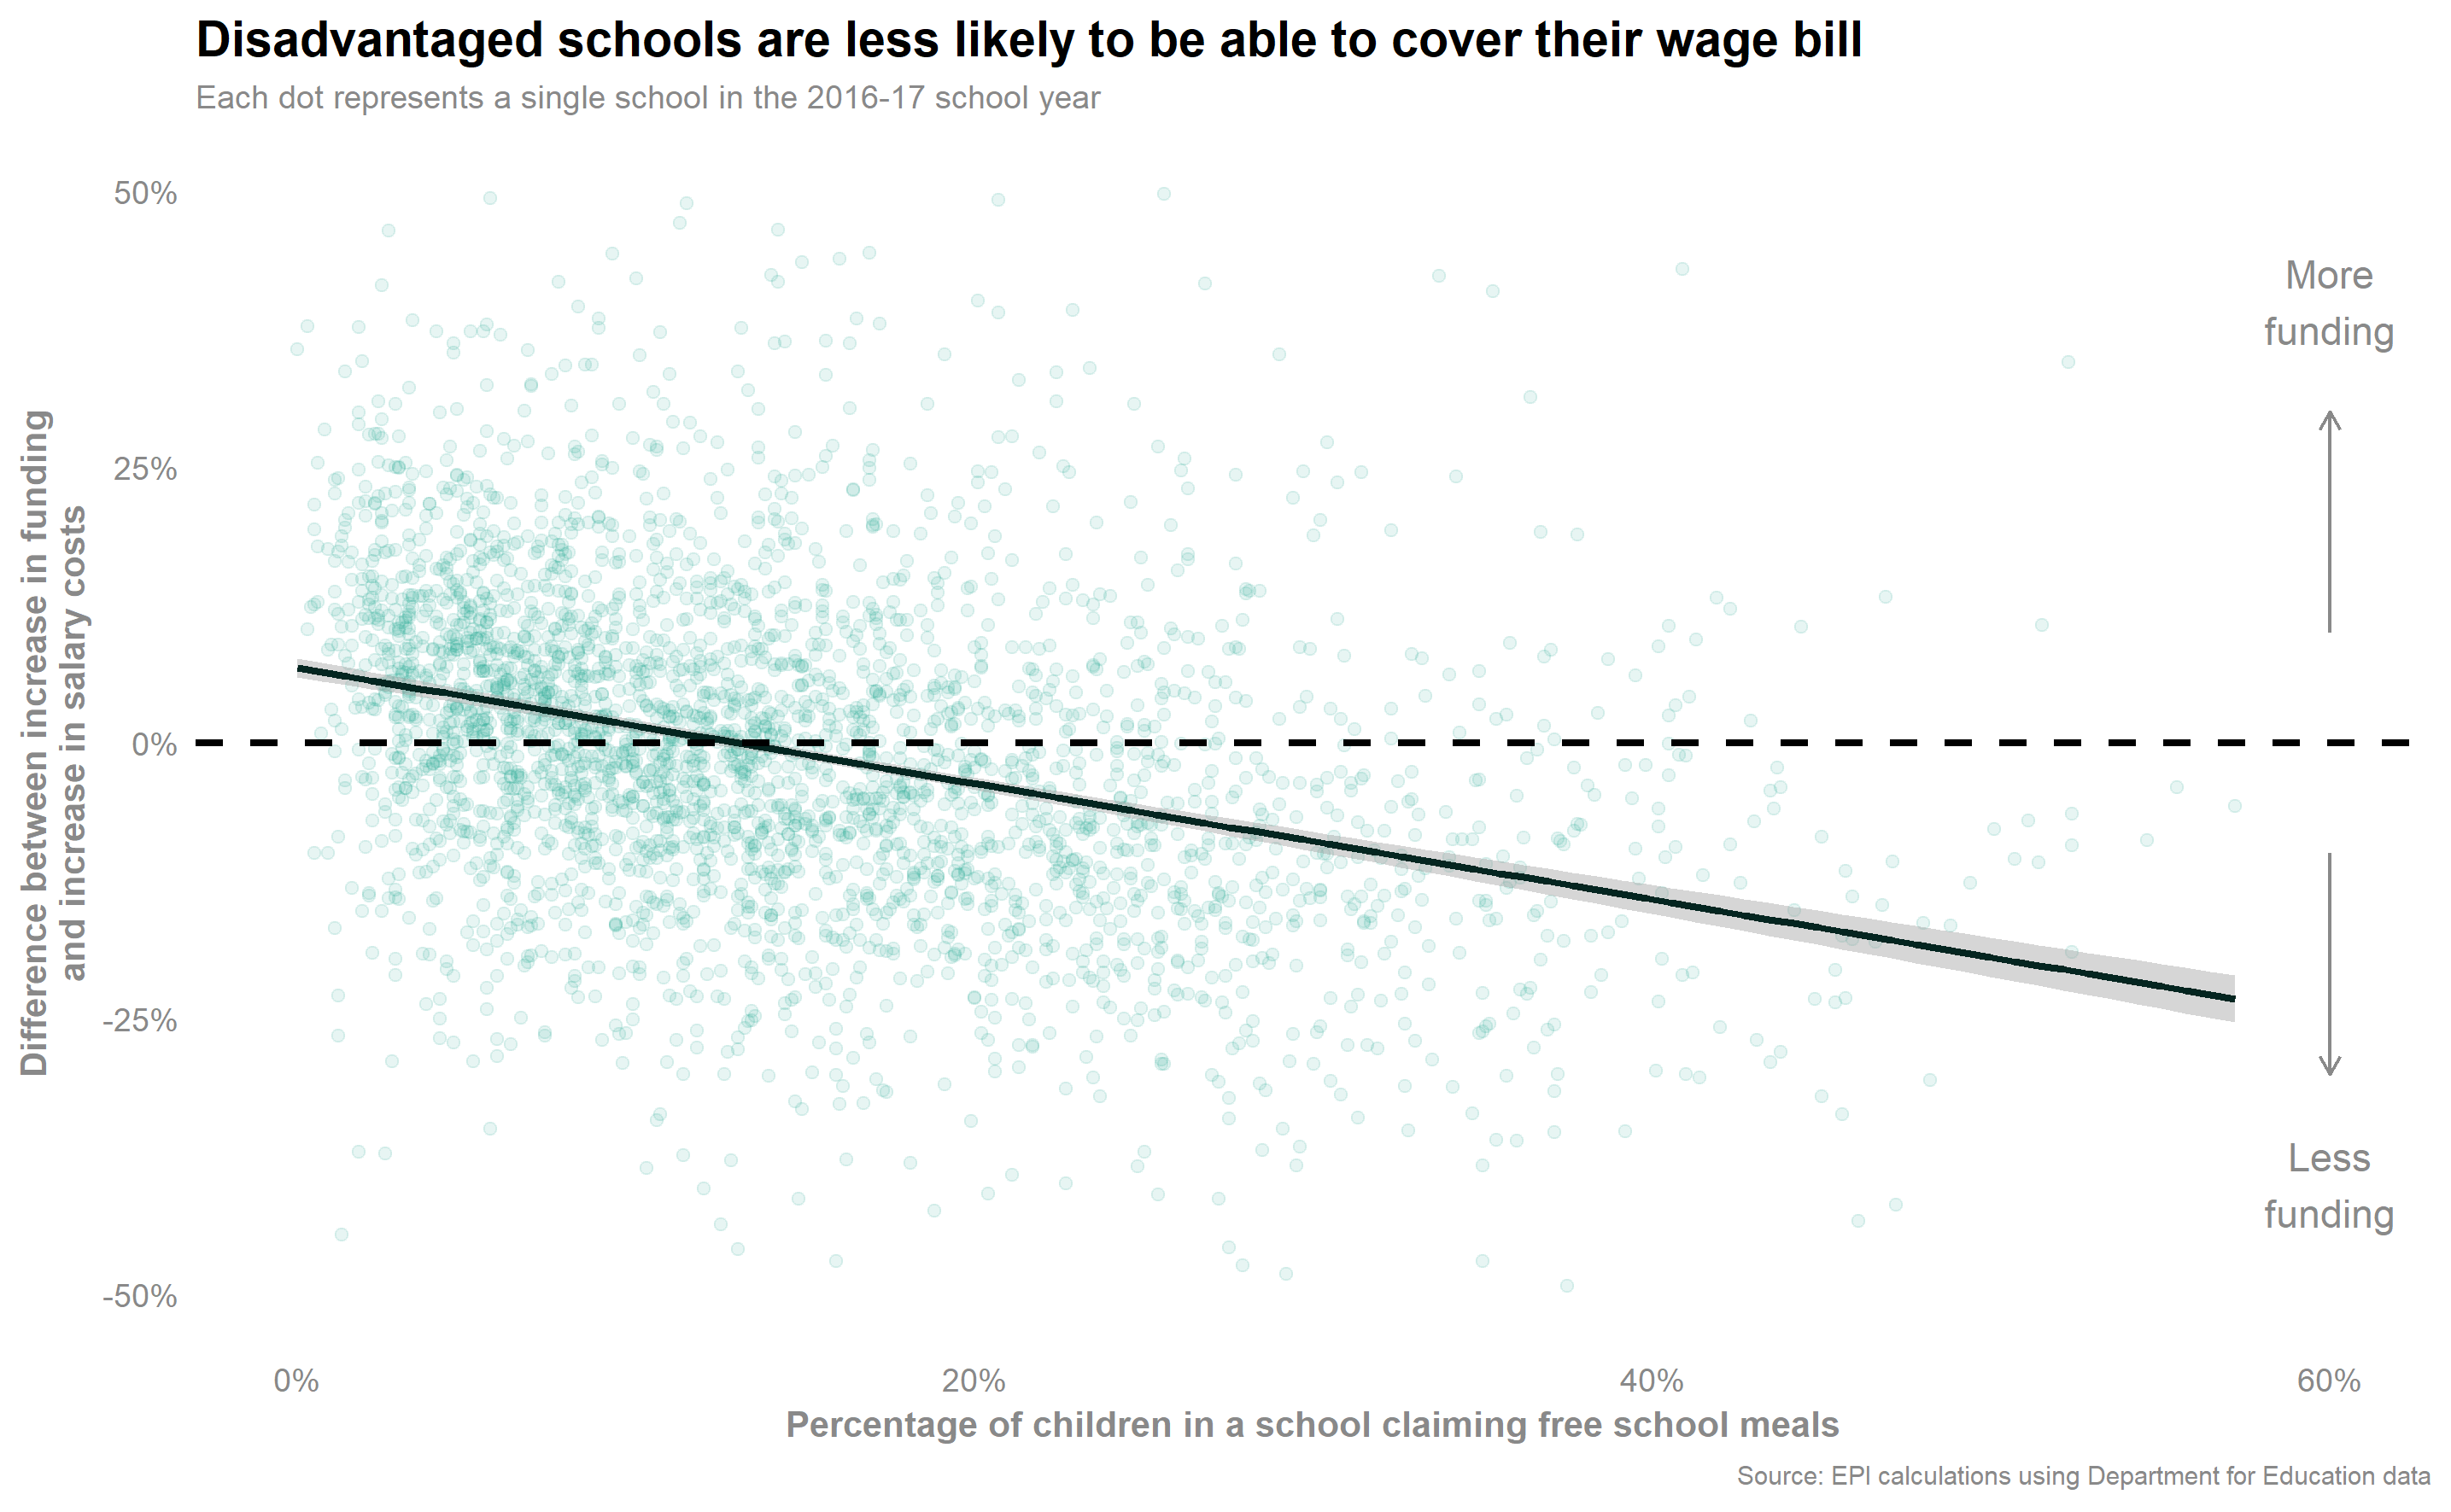
Schools with a disadvantaged intake are disproportionately affected
Schools with a high proportion of disadvantaged pupils are more likely to both employ teachers on the main pay scale and maintain smaller class sizes. That is because those schools tend to struggle to retain experienced teachers and also hire much younger teachers than the average school. Consequently, schools with a more disadvantaged student intake are less likely to receive enough additional pay grant to cover the costs of their salary increases.
Figure 2: Funding and disadvantage
A funding floor benefits small schools
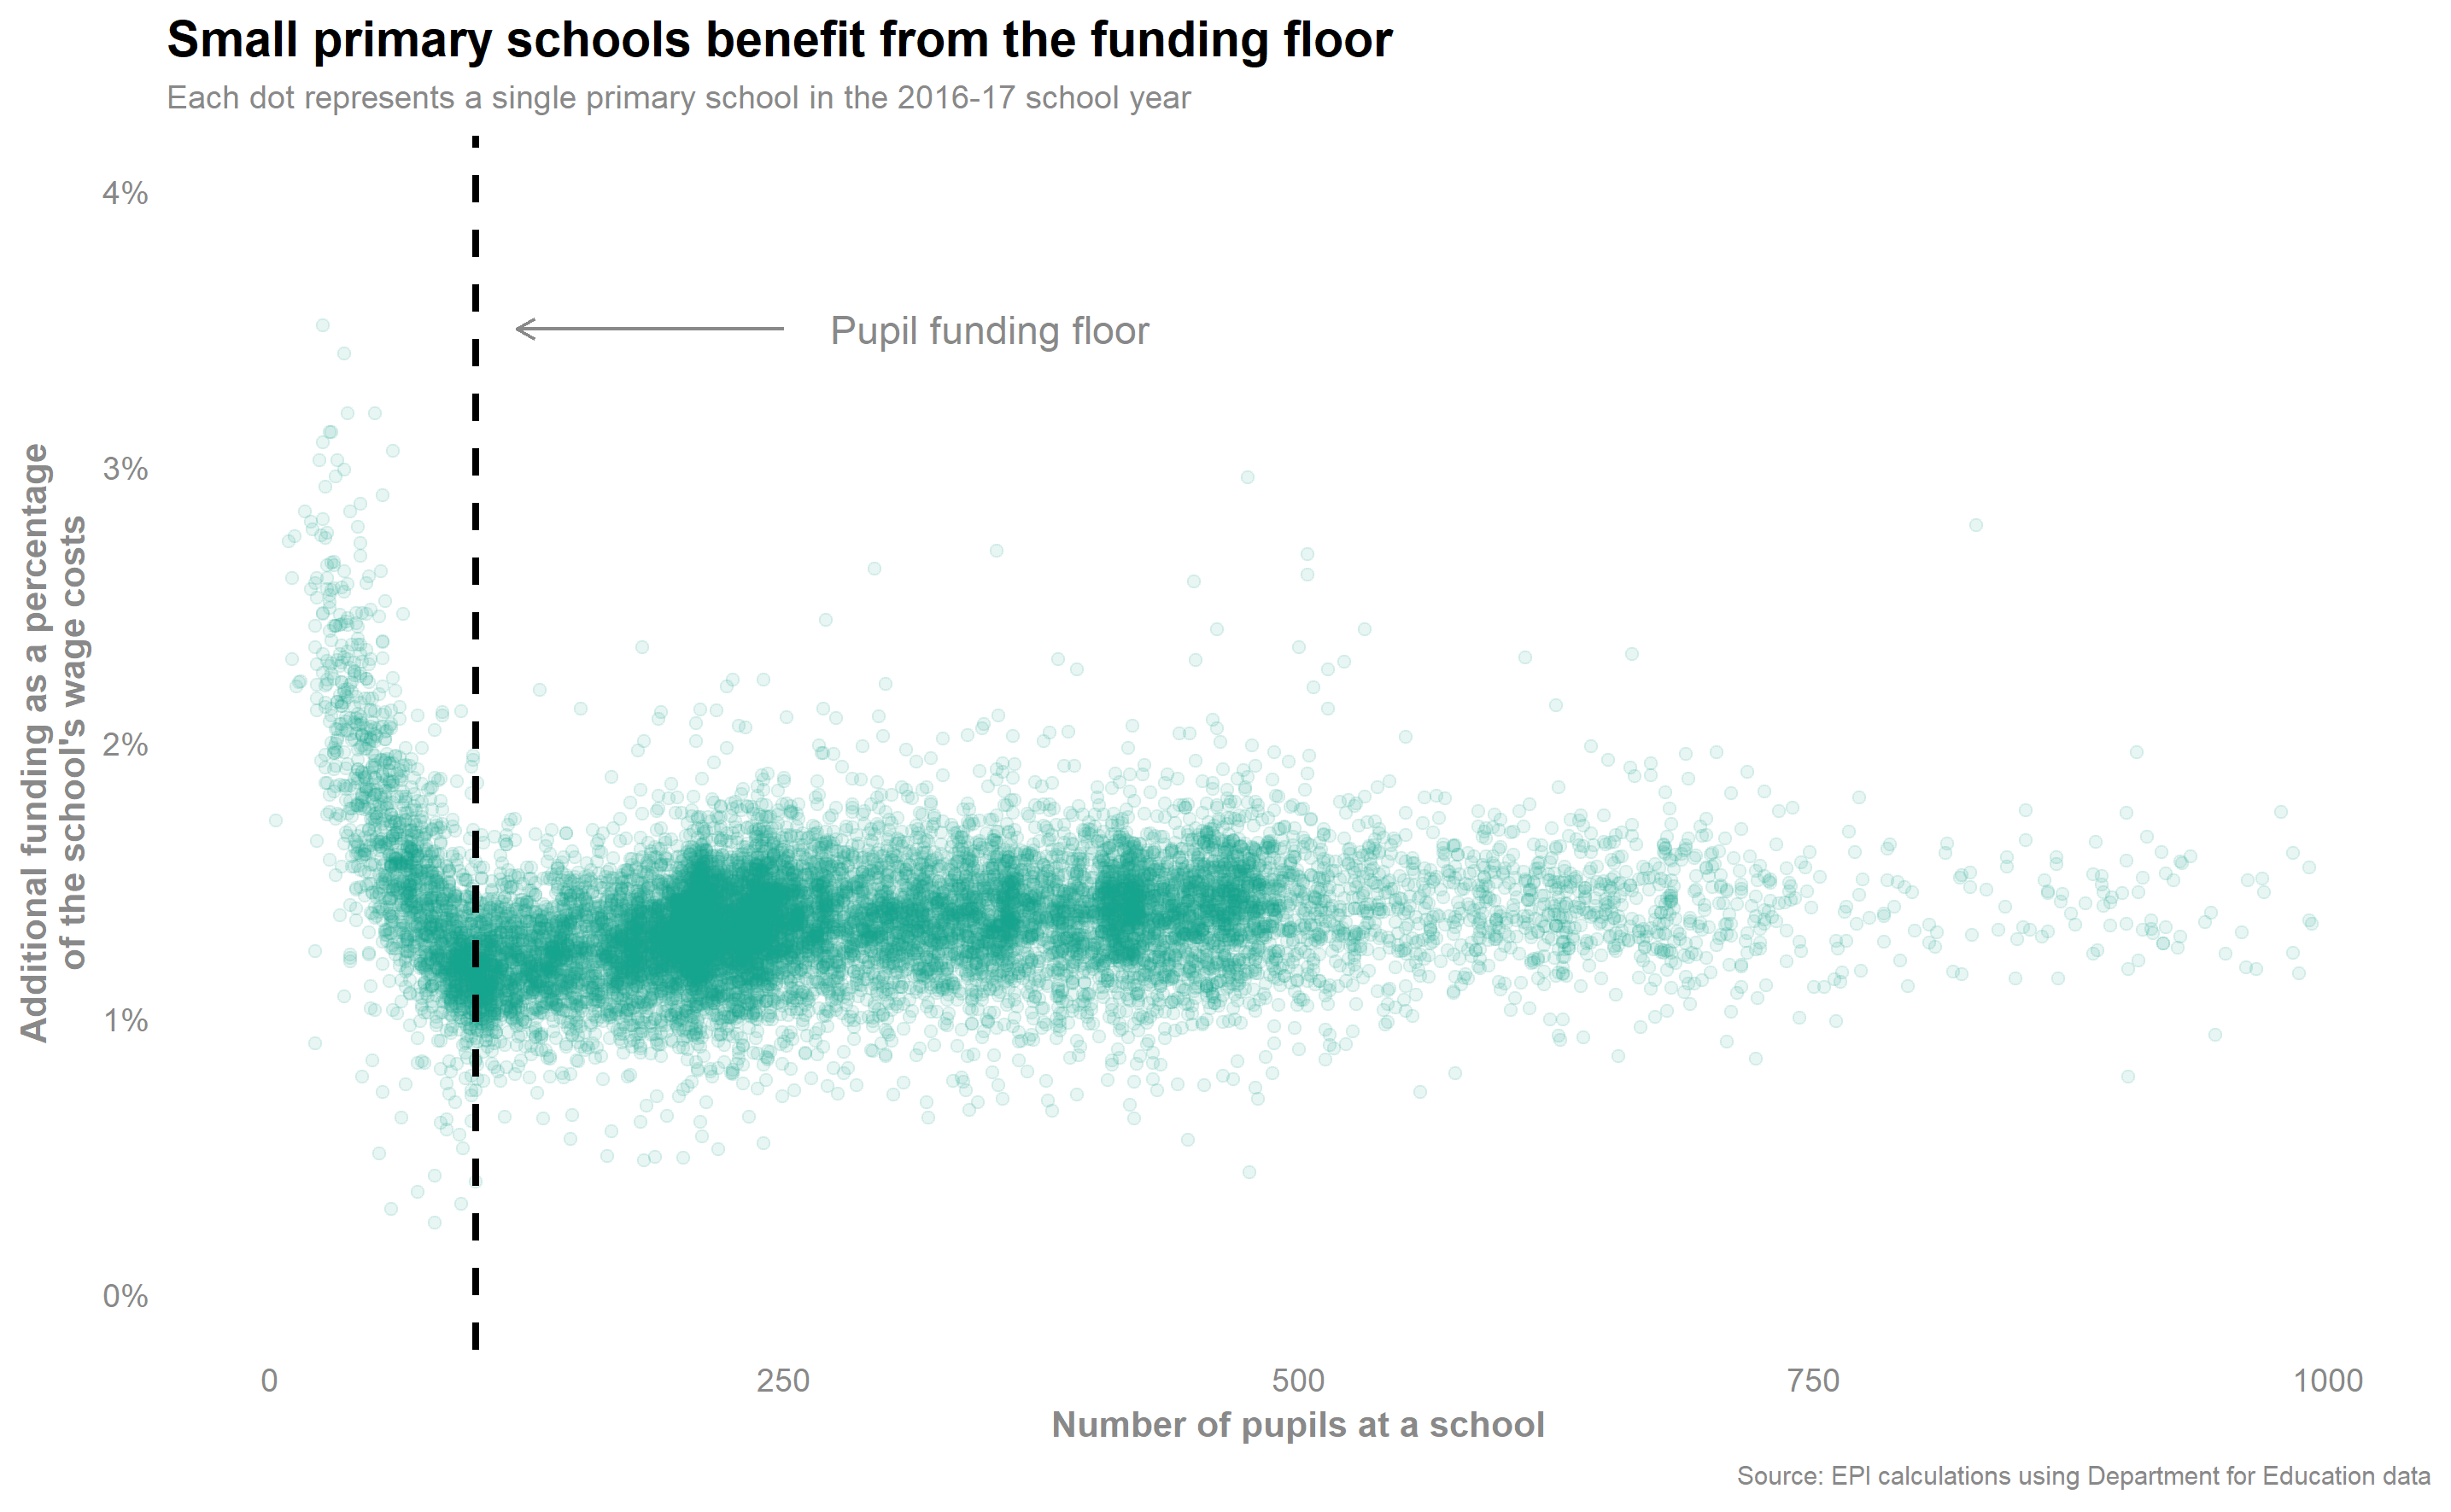
The second important element of the funding allocation is the use of a funding floor: no school will be funded for fewer than 100 pupils. Very few secondary schools are affected as they tend to be larger; however, about 11 per cent of the primary schools in our larger sample of 19,000 schools had fewer than 100 pupils in 2016-17.
It is likely that the funding rule is designed to protect very small schools. For example, a primary school may have a roll of 20 pupils across six year groups and employ four teachers. With only five pupils to each teacher, distributing the funding according to the number of pupils could leave the school unable to offer its teachers the full pay rise. A funding floor prevents these situations from occurring at the cost of providing excessive funding to some smaller schools with a more typical ratio of teachers to pupils.
Using a sample of 14,800 schools, we can determine which effect dominates by estimating the size of the additional funding as a proportion of the school’s total spending on teaching staff. It shows that the funding floor causes small schools to receive, proportionally, up to twice as much additional funding as larger schools. While additional funding for salary increases is essential for some of these smaller schools, others may receive surplus funding. Despite that, the effect on large schools’ additional funding is small because there are nine times as many of them and they soak up more than nine times as much of the additional funding; the cost is more to the taxpayer than to the larger schools.
Figure 3: The funding floor
Does it really matter?
To all of this the department has many reasonable defences. The sums involved are relatively small: very few schools are likely to have an unforeseen overspend exceeding 0.5 per cent of their overall budget. The data to exactly allocate by staff costs is not yet available for 2018-19 and the available 2016-17 numbers are two years old. Making grants on the basis of existing expenditure may also embed or encourage inefficient spending patterns.
The specifics of this case are less important than the general point: operational details matter for individual schools and individual pupils. Looking away after the big policy decisions have been made risks missing these distributional effects that accumulate in the school system. In this case, the department’s allocation method flies in the face of the past twenty years of government policy that attempts to provide greater funding to schools with a disadvantaged intake.
You can download this analysis as a PDF document here.