Background:
This exploratory project is nestled within a much larger research project being conducted by Dr Tammy Campbell and Dr Kerris Cooper: ‘What has ‘Free School Meals’ measured and what are the implications?’. Their large-scale research project, funded by the Nuffield Foundation, is focused on understanding the Free School Meals measure – what it actually captures, what it fails to include, suitability for use as a general deprivation measure, and potential alternatives.
Within larger questions surrounding the suitability of free school meals as an appropriate measure for its many uses, including attracting a pupil premium for schools, the question investigated here is what characteristics are related to the apparent higher likelihood of under-registration for FSM? Previous research has looked at the question using educational, survey, and qualitative data. New exploratory analyses here begin to investigate whether combining administrative and census data can contribute new understandings to this issue.
To classify an area as “under-registered” for FSM, several measures of poverty and deprivation were considered. The mean Income Deprivation Affecting Children Index (IDACI) was selected as the best measure to compare FSM registration rates against to define “under-registration”.
The IDACI is the proportion of children aged 0-15 in a small geographical area who are living in income deprived families. Details on the calculation can be found on this government website. In theory, the IDACI rate should capture the same individuals in a local authority which are eligible for FSM based on the FSM criteria.
There will not be a perfect overlap between the IDACI rate and the number of individuals eligible for FSM because the IDACI rate is for children aged 0-15 and the FSM data used in this blog is for students registered between age 5-15. Despite this difference, the IDACI rate still provides a good proxy for the total number of children eligible for the free school meals program. Nationally, the IDACI rate and the FSM registration rate for a local authority have a correlation of 0.93 – this strong correlation further supports the case for using the measure as a benchmark for under-registration.
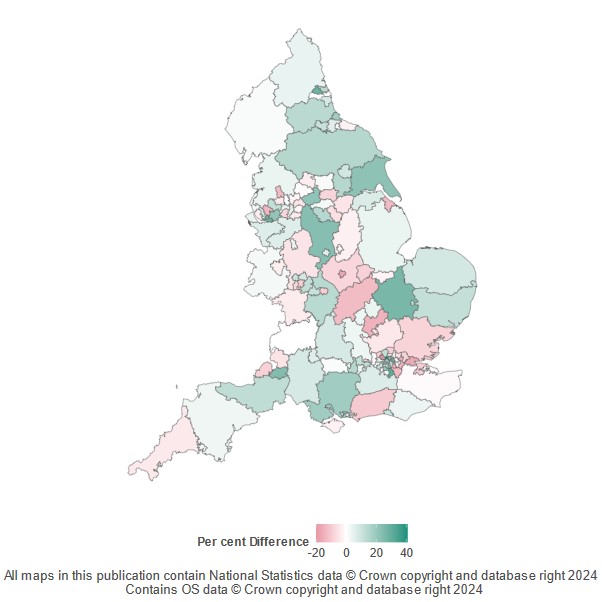
The map in figure 1 shows the under-, or over-registration by each local authority when comparing the FSM registration rate to the IDACI rate for the year 2019. This is calculated as a per cent change rather than the difference in the two rates. Areas in red indicate under-registration and the gradient represents larger differences in the IDACI rate when compared with the FSM registration rate for the local authority.
Some areas are classified as “over-registered” using the IDACI rate method, coloured in green in figure 1. This is likely due to the Universal Credit protections of FSM for students previously eligible for FSM but no longer eligible under the new criteria. The inclusion of legacy FSM students in the FSM rates likely covers the true under-registration rates which are being reduced as a result. These results therefore provide a conservative lower-bound estimate of under-registration rates which in reality is likely to be higher than the figures suggest.
Figure 1: FSM registration compared to IDACI rates in 2019 (green represents FSM higher than IDACI, and red represents FSM below IDACI)

Data Collection and Processing:
The FSM data and an assortment of other characteristics were pulled from the national pupil database. This data was aggregated at the local authority level since the LAs have an administrative responsibility for the education of children within their area. Many additional variables, related to economic and employment activity, were pulled from the NOMIS website. A few additional variables were pulled from the ONS website. The ONS and NOMIS data is for the year 2019-2020 since that is when the IDACI rate was baselined.
To include additional characteristics, that were not readily available for 2019 at the local authority level, data was pulled from the 2021 census. Only variables which were less likely to change drastically due to the impact of COVID-19 internal migration were included. Example variables taken from the census were religion, country of birth, and highest qualification. Although this data is from 2021, the characteristic make-up of the local authorities is unlikely to change drastically enough in 2 years to render the 2021 data invalid for this application.
Additionally, the number of times a local authority used the FSM eligibility checking system, a government provided tool, was included. The data was obtained through a freedom of information request to the DfE and only includes data for 2018. In lieu of the number of checks conducted in 2019, the data for 2018 serves as a close proxy for the engagement from each LA with the system.
After all the variables were included from the various sources, the final data frame has almost 100 variables covering economic activity, employment rates and types, religion, ethnicity, qualification levels, and other similar characteristics. The number of variables included was purposefully high to avoid limiting possible findings as this is an exploratory analysis.
Models and Outputs:
The below models are not suited for understanding causation – instead the goal is to begin to understand if we were going to predict whether an LA is under-registered, what variables would be most important in creating that prediction? “Prediction” without understanding causation can be a useful tool to understand the associated characteristics related to being under-registered. There is a policy case for understanding the variables associated with being under-registered as potential low-cost or low-effort policies could be implemented to target the areas with the identified characteristics as strong predictors of under-registration.
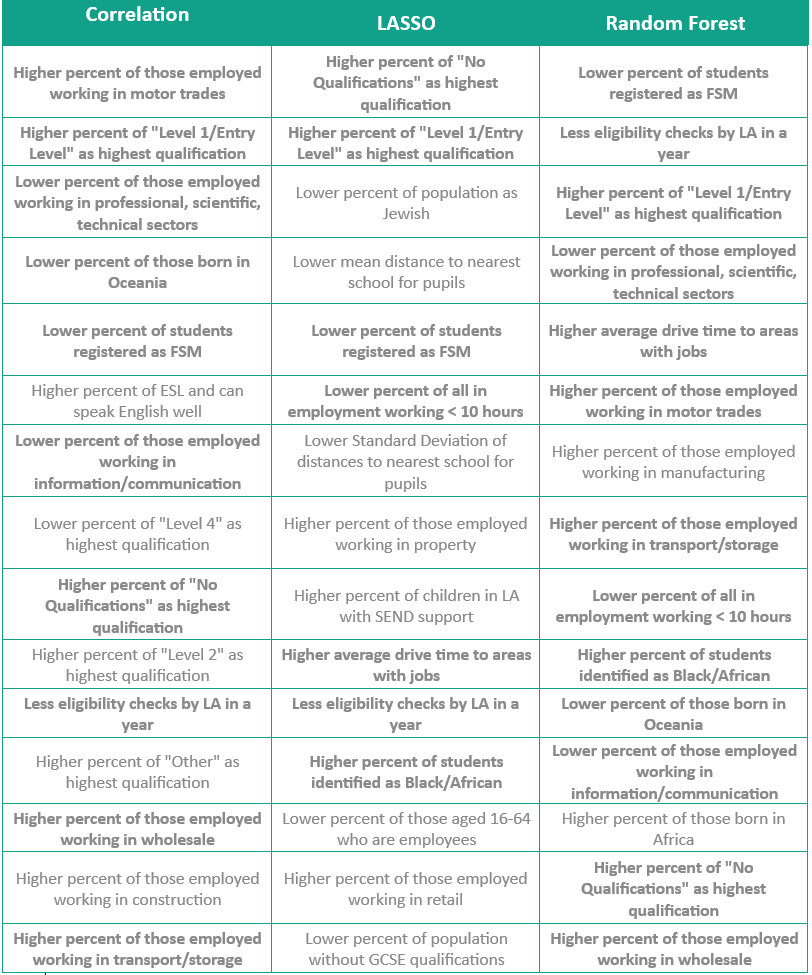
To identify important characteristics related to under-registration for free school meals, a correlation was run to see the relationship between the variables and the continuous outcome of under-registration. The 15 variables with the highest absolute correlations with under-registration are listed in figure 2.
A LASSO model was run to identify important features for predicting the outcome of the under-registered variable. A LASSO model is a linear regression model with an added penalty term which pushes coefficients to zero if they are not important enough for the model to keep to improve predictions. In this case, the LASSO model returned only 22 non-zero variables out of the original 96 variables available to the model. The LASSO model is concerned primarily with including variables that will provide a more accurate prediction, but the model is not suitable for identifying causal relationships. The 15 most important variables according to this model are included in the table below.
A random forest model was run to understand the important features for predicting under-registration. A random forest is a collection of decision trees which splits the data on one variable at each node into groups that are progressively more homogenous. A random forest only allows a random subset of variables for the model to split on at each node, which reduces the chance of one dominant feature drowning out the other important features. The random forest is a collection of many decision trees and can be used to return the important features used the most when making the splits. Like the LASSO model, the random forest model is mainly used in prediction and the variables deemed important are those which are best at separating the data in order to make more accurate predictions.
The 15 most important features from each model are listed below, in order of importance, by the impact they have on under-registration. Features ranked in the top 15 by multiple models are indicated in bold.
Figure 2: Most influential variables predicting FSM under-registration

Results and Policy Considerations:
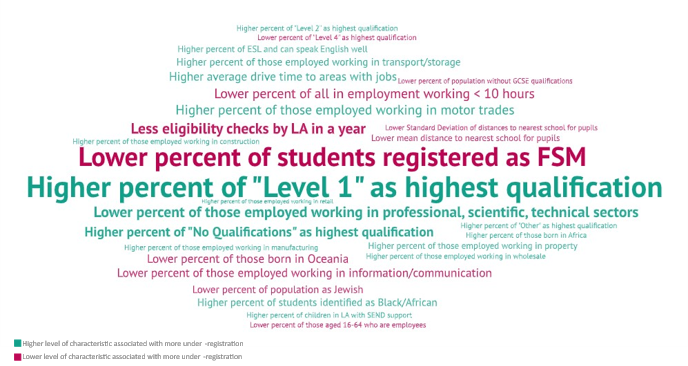
The important features from each model were combined and scored based on their order of importance within the individual models as well as the frequency with which they were deemed important by other models. This combined approach was used to generate a word cloud to easily visualize important features across the models. The larger the phrase, the more important it was across the models. The colour denotes if a higher (green) or lower (red) level of that characteristic is associated with an increase in under-registration
Figure 3: Important features for predicting increased FSM under-registration based on the results of three models

While the models do not show causality – there is a benefit from understanding the characteristics associated with greater under-registration and potential to increase registration if low-cost policies are geared towards areas with the features deemed important by the models.
Across the three models, a higher percentage of the population having Level 1/Entry Level as their highest qualification award was deemed the most important variable related to an increase in under-registration. Level 1 qualifications include GCSE grades 3, 2, 1 or several other relatively low-level qualifications as listed on the government website. The models also identified a higher percentage of the population with no qualifications as an important variable for predicting under-registration. Previous research indicates complicated application processes might also be a barrier for eligible applicants, particularly those with less computer literacy as most applications are online. Policies, and administrative changes, aimed at simplifying the application process could help address this reason for under-registration.
A lower percentage of students registered in the local authority for FSM was identified as a strong predictor for greater under-registration by all three models. While it might initially seem apparent that fewer students registered for FSM would naturally result in more under-registration, it is possible that low FSM registration in some areas is truly due to a lack of eligible children. Having less under-registration in areas with a greater percentage of the population registered for FSM could be a result of social norms and stigmas. This finding is congruent with previous research into the relationship between the proportion of FSM-eligible students and area-level disadvantage. If all the neighbours are registering for FSM and it becomes more normalized, it is likely that under-registration would decrease. The opposite might be true in this case too: less registration for FSM in an area might make it seem like more of a taboo and result in eligible families actively not registering for fear of breaking social norms. Potential policies could focus on educational efforts to break negative stigmas associated with FSM registration in areas with low FSM registration where there is reason to believe there are more eligible students than currently registered. Other policies could focus on increased levels of confidentiality and discretion around FSM designation to reduce chances of being openly identified as FSM against families’ wishes.
Specific industries for those employed were also identified as strong predictors for under-registration. A lower percentage of those employed in “professional, scientific, or technical” jobs and “information/communication” jobs are predictors for more under-registration. A higher percentage of those employed in “motor trades” and “transport/storage” are predictors for more under-registration. Knowing the types of industries associated with greater under-registration can be a starting point for additional analysis exploring underlying factors. Potentially individuals in the industries associated with increased under-registration are on certain contract types that impact their benefit eligibility and make them less likely to sign up for FSM. This finding is also related to the impact of qualification levels on the predicted under-registration, mentioned above, as certain qualification levels would be related to certain industries. Another reason for prevalent under-registration in certain areas could be related to persistent stigmas in certain industries surrounding benefits.
Another variable flagged as influential in predicting under-registration by all the models is the number of FSM eligibility checks performed by the LA in a year. Fewer FSM eligibility checks in a year are associated with more under-registration. This could be a result of LAs conducting checks more frequently and therefore able to quickly sign up those who are newly eligible. This could also be an indirect effect of LAs running checks more frequently also having better administration processes and therefore decreasing the amount of under-registration through easier application processes or greater information around the program.
All of the possible explanations and hypotheses listed above would need to be investigated and researched in greater detail before beginning to reach definitive conclusions on the causal impacts on FSM under-registration.
One way to strengthen the analysis would be to add in additional years of data to check if the same characteristics are prevalent predictors of FSM under-registration over time. Multiple years were not used in this analysis because the IDACI rate is baselined to 2019 so comparisons to the 2019 IDACI become less accurate as time passes. When the next calculation of IDACI rates is published, this analysis should be re-run with current FSM rates to get a better understanding of new, or consistent, variables associated with under-registration. Another way to deepen this analysis would be the inclusion of more characteristics which might have an impact on FSM registration. Important variables might have been omitted due to lack of data at the local authority level or for the year being analysed.
As re-iterated through the blog, these results do not indicate causality and merely aim to begin to capture relationships in the data, as well as to explore the possibility for machine learning analyses bringing together multiple administrative and public datasets to shed light on this key policy issue. Further analysis should be conducted to better understand the causal mechanisms of under-registration to better inform targeted policy for reducing under-registration for free school meals.
Appendix:
- Another potential measurement to use as a benchmark for under-registration is the per cent of children in poverty (after housing costs) living in a local authority. The same models were run using the children in poverty data as the benchmark to define “under-registration”. The children in poverty data is very different from the FSM rates – likely due to the inclusion of housing costs in the poverty calculation. The children in poverty data is based on survey estimates with small sample sizes in some LAs, therefore the data is less reliable. The IDACI rate was determined to be the better benchmark for this analysis. Subsequent analysis could further explore how different measures of poverty and deprivation classify groups as “under-registered”.
- The 2021 census data for West Northamptonshire was used for Northamptonshire since Northamptonshire was split into West Northamptonshire and North Northamptonshire in 2021. The census data for West Northamptonshire and North Northamptonshire were similar and West Northamptonshire was chosen as the population is larger, so it encompasses more of the previous Northamptonshire local authority. This change is unlikely to impact results.
- Word Cloud was generated using https://wordart.com/create
- This work contains statistical data from ONS which is Crown Copyright. The use of the ONS statistical data in this work does not imply the endorsement of the ONS in relation to the interpretation or analysis of the statistical data.

