The data published by the DfE in August show that the overall NEET rate is falling, although it has increased recently for 16 year-olds. This analysis explores how participation of young people in education and employment has evolved in recent years and how it compares to other advanced economies.

NEET: missing from the political agenda
With education participation steadily increasing, and concerns about the labour market focused more on the quality of jobs in the face of record employment levels, the issue of young people not in education, employment or training (NEET) seems to have fallen down the political agenda. It could be argued that some of the two main parties’ manifesto pledges, such as Labour’s promise to “deliver skilled workers for employers and real jobs for apprentices at the end of their training” or the Conservatives’ plans to reform technical education, would benefit young people currently unable to find a job or an educational alternative that suits their needs.[1] However, neither of the two largest parties’ manifestoes presented any proposals explicitly designed to reduce NEET rates.[2]
Current situation in the UK compared to other OECD countries
Is this decline in attention justified? The proportion of young people NEET in the UK has fallen rapidly by international standards. In 2008, at the start of the economic crisis, the rate of people aged 15-29 who were NEET in the UK (14.9 per cent) was slightly higher than the average for OECD countries (13.9 per cent). 14.5 per cent of young people were NEET in France in 2008, 13.2 per cent in the United States, 12.6 per cent in Germany, and 10.15 per cent in Finland. By 2015 the NEET rate was down to 13.7 per cent in the UK, below the OECD average of 14.5. Of all the countries mentioned, only Germany had a lower proportion of young people neither in education, training nor employment.[3]
As shown in Figure 1, across the OECD as a whole, the proportion of young people who are NEET has followed a similar trend as that of youth unemployment, while in the UK the two appear to be at least partly decoupled. If the UK had followed the same pattern as other OECD countries, we could have expected a higher proportion of young people out of the labour market and education, but it was not the case.
Figure 1. Evolution of the NEET rate (15-29 year-olds) and youth unemployment (15-24 year-olds) in the UK and the OECD, 2007-2015[4] [5]
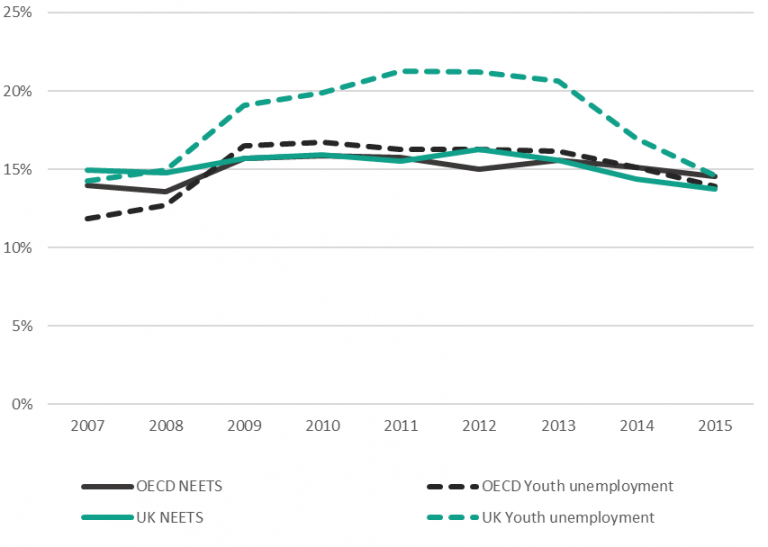
Source: OECD
The fall in the number of 16 to 18 year-old NEETs responds largely to the increase in participation in education, driven by the obligation to stay in education or training up to the age of 18 (Raising the Participation Age). The statistics published in August show that the NEET rate for 16 year-olds fell by 3.3 percentage points (from 7.7 to 4.4 per cent) between the second quarter of 2000 and the second quarter of 2017, despite an inter-quarter increase of 1.7 percentage points that corresponds to seasonal trends.[6] This was driven by a 10 percentage point increase in education participation rates (from 86.4 in 2000 to 96.4 per cent in 2016), greater than the corresponding fall in employment which was the major source of new students (from 6.9 to 0.7 per cent). [7] The trend for 17 and 18 year-olds is very similar.
Figure 2. Evolution of 16-18 year-olds in education or training, in employment, and NEET
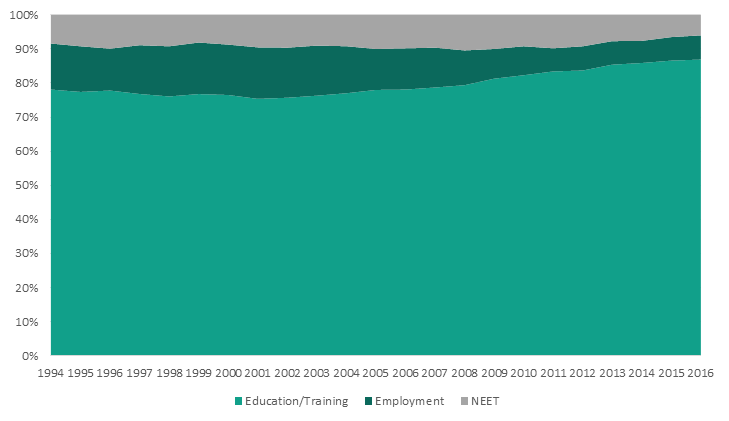
Source: Department for Education, 2017, Participation in Education, Training and Employment by 16-18 year olds
The proportion of 19-24 year-olds who are NEET rose from 14.7 per cent at the beginning of the financial crisis to 22 per cent in the third quarter of 2011. It then started to decrease, going down to 12.7 per cent in the second quarter of 2017. The fall of NEET rates among 19-24 year-olds responds to a drop in the unemployment rates and to the increasing number of young people going to university. In the academic year 2014/15 the Higher Education Participation Rate (HEIPR) went up to a record high of 48 per cent.[8]
What are the remaining challenges for the UK?
With NEET rates falling and the UK doing better than other advanced economies on some measures, is there anything left to worry about? We argue that there is still room for improvement. The Coalition Government wanted to see everyone up to the age of 18 in some sort of education or training by 2015, raising the participation age and making it mandatory for young people to stay in education or training at least until they turn 18.[9] However, the data published in August show that 18.4 per cent of 16 to 18 year-olds are in neither education nor training. That is 338,000 young people. More worryingly, this is the second year-on-year increase: from 15.7 per cent in the same quarter of 2015 and 16.6 per cent in 2016.
Further, the remaining regional disparities are concerning. Northern and Eastern regions have higher NEET rates than London and the South. For example, in the West Midlands, the North East and Yorks & Humber the proportion of 16-24 year-olds who are NEET is between 13.5 and 14.7 per cent, whilst in both London and the South it is between 9.0 and 10.1 per cent. As the Building our Industrial Strategy green paper mentions, varying unemployment rates have resulted in fewer opportunities in some of the regions than in others.[10]
Figure 3. Proportion of 16-18 year olds who are NEET by local authority, 2015[11]
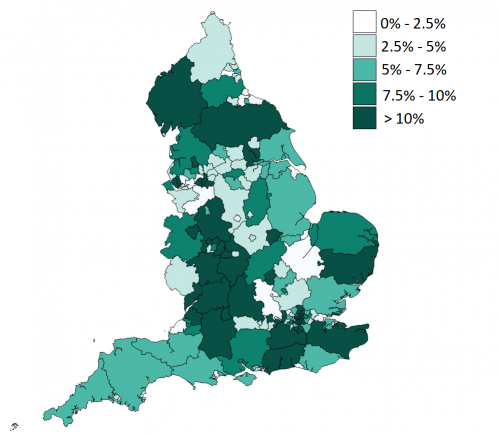
Source: Department for Education. Map contains National Statistics data © Crown copyright and database right 2016, and contain OS data © Crown copyright and database right 2016.
There has also historically been a gender gap affecting NEET rates: women are consistently more likely to be not in education, training or employment than men. This is despite girls’ better performance at school on some measures: in 2015/16, 62.6 per cent of 16 year-old girls achieved 5 A*-C in their GCSEs or equivalent qualifications, compared to 52.3 per cent of boys.[12] Although the gap has narrowed over time, there are some structural issues that may be holding women back, many of them related to the dynamics of employment: the gender pay gap was 18 per cent in 2016 according to the government, [13] and it is widely acknowledged that women still face barriers in the labour market. [14]
Figure 4. Evolution of the NEET gender gap, 16-24 year-olds, 2008-2017
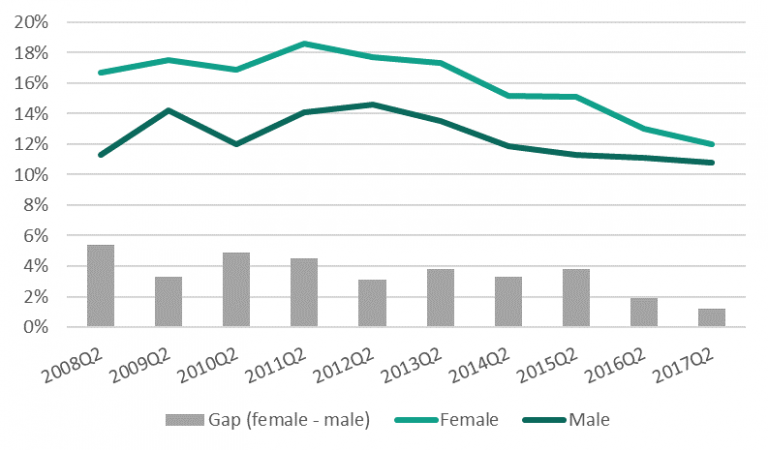
Source: Department for Education
Similarly, recent research revealed that people with a disability are more likely to be NEET (30 per cent) than those without (9 per cent), and people without qualifications (25 per cent) are more likely to be NEET than those with GCSE and above (10 per cent).[15] Likewise, longitudinal research found in 2011 that 22 per cent of 19 year-olds who had been eligible for Free School Meals in Year 11 had spent at least two periods of one month or more NEET, compared to 9 per cent of those not eligible.[16] Hence there is evidence that the chances of being out of the labour market and education or training vary significantly across social groups.
Moreover, the current policy landscape may work against a further reduction of the NEET rates. The Youth Contract for 16 and 17 year-olds, whose aim was to support young people who are hardest to reach so that they stay in education, training or a job with training, ended in March 2016. The policy was targeted to low achievers, young offenders, and people who were or had been in care.[17] An assessment of the Youth Contract suggested in 2014 that the impacts of the policy had been positive, contributing to a fall in the numbers of 16-17 year-old NEETS in England and to the 12 percentage point increase in education among participants, especially at level 1 and 2 of learning. [18]
The 16-19 Bursary Fund replaced the Education Maintenance Allowance (EMA) in 2011. Despite the substantial budget reduction involved, from £560 million to £180 million, initial evaluation evidence suggested a modest impact on participation (of around one percentage point in years 12 and 13).[19] However, the value of the fund has not kept up with inflation, and its effectiveness may therefore wane when secondary school pupil numbers begin to increase again in the coming years.[20]
Many of the main obligations for educational participation rest with local authorities to deliver: they have statutory duties to implement the mandates of the Raising Participation Age.[21] Local authorities are also responsible for Education, Health, and Care plans, which require them to assess whether a person up to the age of 25 is entitled to additional support and, in case they are, ensure they receive the right support. This has financial implications for local government. However, local authorities’ net expenditure decreased by 8.1 per cent in nominal terms between 2010/11 and 2017/18. Under these constraints, it is uncertain whether local authorities will be able to expand or even maintain the current level of support in the future.[22]
Conclusions
Recent governments have shown commitment to tackle youth unemployment and the rates of young people leaving education or training prematurely. From April 2017, the government has required young people aged 18-21 and receiving Universal Credit to take part in an intensive job-search programme, and to apply for work-based training if they are still unemployed after six months. This is called the Youth Obligation.[23]
The Post-16 Skills Plan, which expects to deliver better technical education with clearer progression routes linked to the skills needed in the labour market, has the potential to attract more students, and retain them on more logical progression paths to work or higher skill levels, if new T-Levels are implemented well. The proposed transition year for those not ready to start an apprenticeship or T-level straight away may further support those who otherwise would drop out – but again this relies upon adequate funding and effective design. Traineeships could play a part in this if used wisely, as recent evaluation evidence tentatively shows.[24]
However, given the ongoing financial constraints faced by local authorities, their role in the overall system for steering young people towards education, and the uncertain future of services provided via the European Social Fund (ESF), the government may need to define a clearer policy direction to ensure recent progress in reducing NEET rates continues.[25]
[1] http://www.labour.org.uk/page/-/Images/manifesto-2017/Labour%20Manifesto%202017.pdf, https://www.conservatives.com/manifesto
[2] The EPI’s analysis of election manifestos can be found here: https://epi.org.uk/wp-content/uploads/2017/05/EPI_Manifesto_Analysis_GE2017.pdf
[3] https://data.oecd.org/youthinac/youth-not-in-employment-education-or-training-neet.htm
[4] OECD (2017), Youth not in employment, education or training (NEET): https://data.oecd.org/youthinac/youth-not-in-employment-education-or-training-neet.htm
[5] OECD (2017), Youth unemployment rate: https://data.oecd.org/unemp/youth-unemployment-rate.htm
[6] https://www.gov.uk/government/statistics/neet-statistics-quarterly-brief-april-to-june-2017
[7] Latest data available
[8] http://researchbriefings.parliament.uk/ResearchBriefing/Summary/SN02630
[9]https://www.gov.uk/government/uploads/system/uploads/attachment_data/file/300215/Building_Engagement__Building_Futures.pdf
[10] https://beisgovuk.citizenspace.com/strategy/industrial-strategy/supporting_documents/buildingourindustrialstrategygreenpaper.pdf
[11] https://www.gov.uk/government/publications/neet-data-by-local-authority-2012-16-to-18-year-olds-not-in-education-employment-or-training
[12] https://www.gov.uk/government/uploads/system/uploads/attachment_data/file/584146/SFR03_2017_national_characteristics_tables.xlsx
[13] https://www.gov.uk/government/news/uk-gender-pay-gap
[14] http://www.employment-studies.co.uk/system/files/resources/files/294.pdf
[15] House of Commons Library, 2016, ‘NEET: Young People Not in Education, Employment or Training’
[16] Department for Education, 2011, ‘Youth Cohort Study & Longitudinal Study of Young People in England: The Activities and Experiences of 19 year olds: England 2010’
[17] https://www.gov.uk/government/publications/youth-contract-16-and-17-year-olds/youth-contract-provision-16-and-17-year-olds
[18] https://www.gov.uk/government/uploads/system/uploads/attachment_data/file/354706/RR318A_-_The_youth_contract_for_16-_to_17-year-olds_not_in_education__employment_or_training_evaluation.pdf
[19] https://www.ifs.org.uk/uploads/Britton_NCRM2014.pdf
[20] https://www.gov.uk/guidance/16-to-19-bursary-fund-guide-for-2016-to-2017#to-19-bursary-fund-changes-for-2016-to-2017
[21] https://www.gov.uk/government/publications/participation-of-young-people-education-employment-and-training
[22] https://www.gov.uk/government/collections/local-authority-revenue-expenditure-and-financing#history
[23] https://www.gov.uk/government/publications/dwp-single-departmental-plan-2015-to-2020/dwp-single-departmental-plan-2015-to-2020
[24]https://www.gov.uk/government/uploads/system/uploads/attachment_data/file/626792/Traineeships_Year_Two_Process_Evaluation.pdf
[25] https://www.gov.uk/guidance/england-2014-to-2020-european-structural-and-investment-funds