As introduced in our previous post, we are proposing to create a measure of efficiency that will help us identify the most effective school groups.
“Efficiency” can mean a lot of things. Here, we mean that an efficient school achieves the greatest output with the lowest use of input. There in fact already exists a measure of efficiency for schools in England which takes this definition quite literally: the Department for Education‘s (DfE) financial efficiency metric was developed and published in January 2016, and ranks schools based on how much progress their pupils achieve for every pound the school spends.
The strength of the DfE’s metric lies in its simplicity and transparency: it relies on just two key figures, pupil progress and spend per pupil. These are publicly available figures which schools are already familiar with and, as we’ll see, they make for an efficiency ‘score’ which is easy to interpret. But with this simplicity comes a number of limitations, which we detail below, and the opportunity to exploit other approaches to measuring school efficiency which better reflect the complex nature of school operations.
The DfE financial efficiency metric favours schools with less challenging intakes
In the DfE metric, each school is allocated an efficiency score based on their progress measure divided by their spending per pupil.[1] For primary schools the progress measure is averaged across reading, writing and maths and for secondary schools the measure is Progress 8. Worked examples with clear explanations can be found in DfE’s technical note.
By this measure, schools that make the most progress but spend the least per pupil are scored as most efficient. To its credit, this is a very simple and transparent measure. The issue is that schools who spend the least are likely to be those with the lowest funding, and they are funded at a lower level precisely because they have more pupils who tend to make more progress. Our compensatory funding system is designed to provide more support to schools via the pupil premium and funding for additional needs, and you would expect to see higher per pupil spending in schools with more challenging cohorts (how the DfE efficiency metric is used does attempt to allow for this and we will address this in the next section).
All in all, this means that schools with less challenging intakes are more likely to be scored as more efficient. This includes schools that are formally selective, such as academically-selective grammar schools, as well as schools that evidence suggests have socially selective intakes, for example comprehensive schools in affluent areas which are sometimes described as “selective by mortgage”, or schools with a religious character which evidence shows tend to have less disadvantaged and less ethnically diverse intakes.[2]
The effect is illustrated in the figures below. They show all secondary schools with valid data in 2018/19 (about 3,200), ranked by efficiency score (Progress 8 divided by spending per pupil, both progress and spending are first standardised as per the DfE methodology). The higher the efficiency score and rank, the higher the school’s efficiency. In figure 1 we’ve highlighted selective schools in dark green, showing a clear propensity for schools with selective admissions policies to place at the very top end of the efficiency rankings on this measure.
Figure 1: All secondary schools ranked by efficiency score, by admissions policy
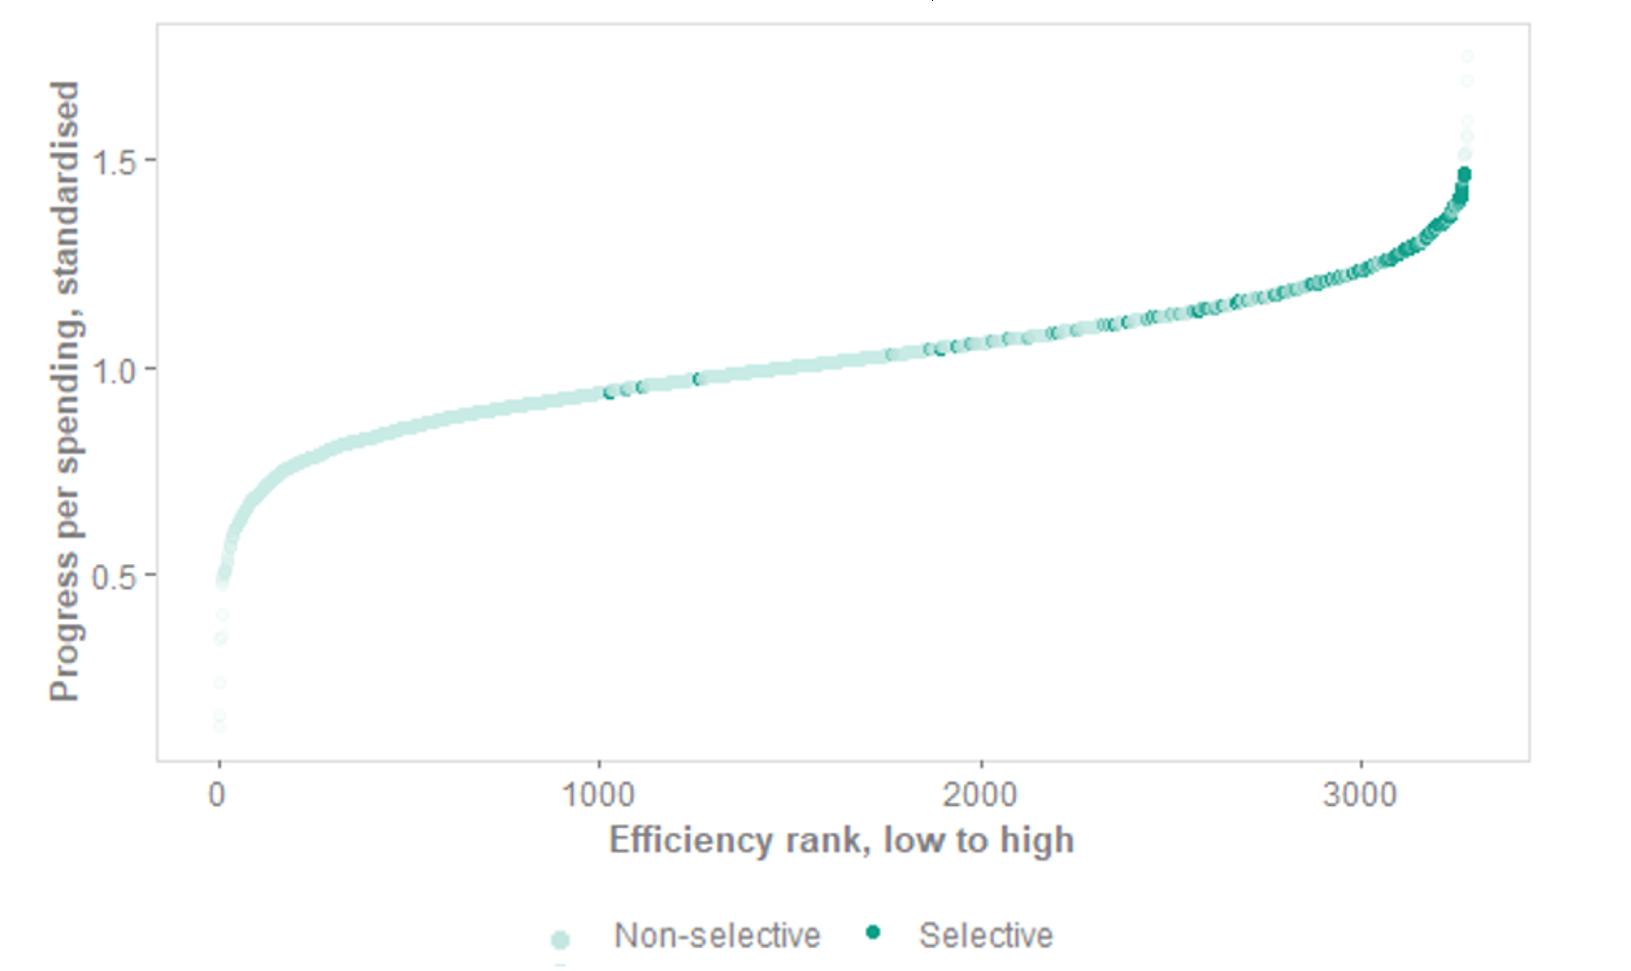
Figure 2 shows every school with a recorded religious character highlighted in dark green.[3] Here we see a slightly greater propensity to rank towards the top, with two of the top three ranking schools in the country being schools with a religious character. However, it is true that such schools are found along the full spectrum.
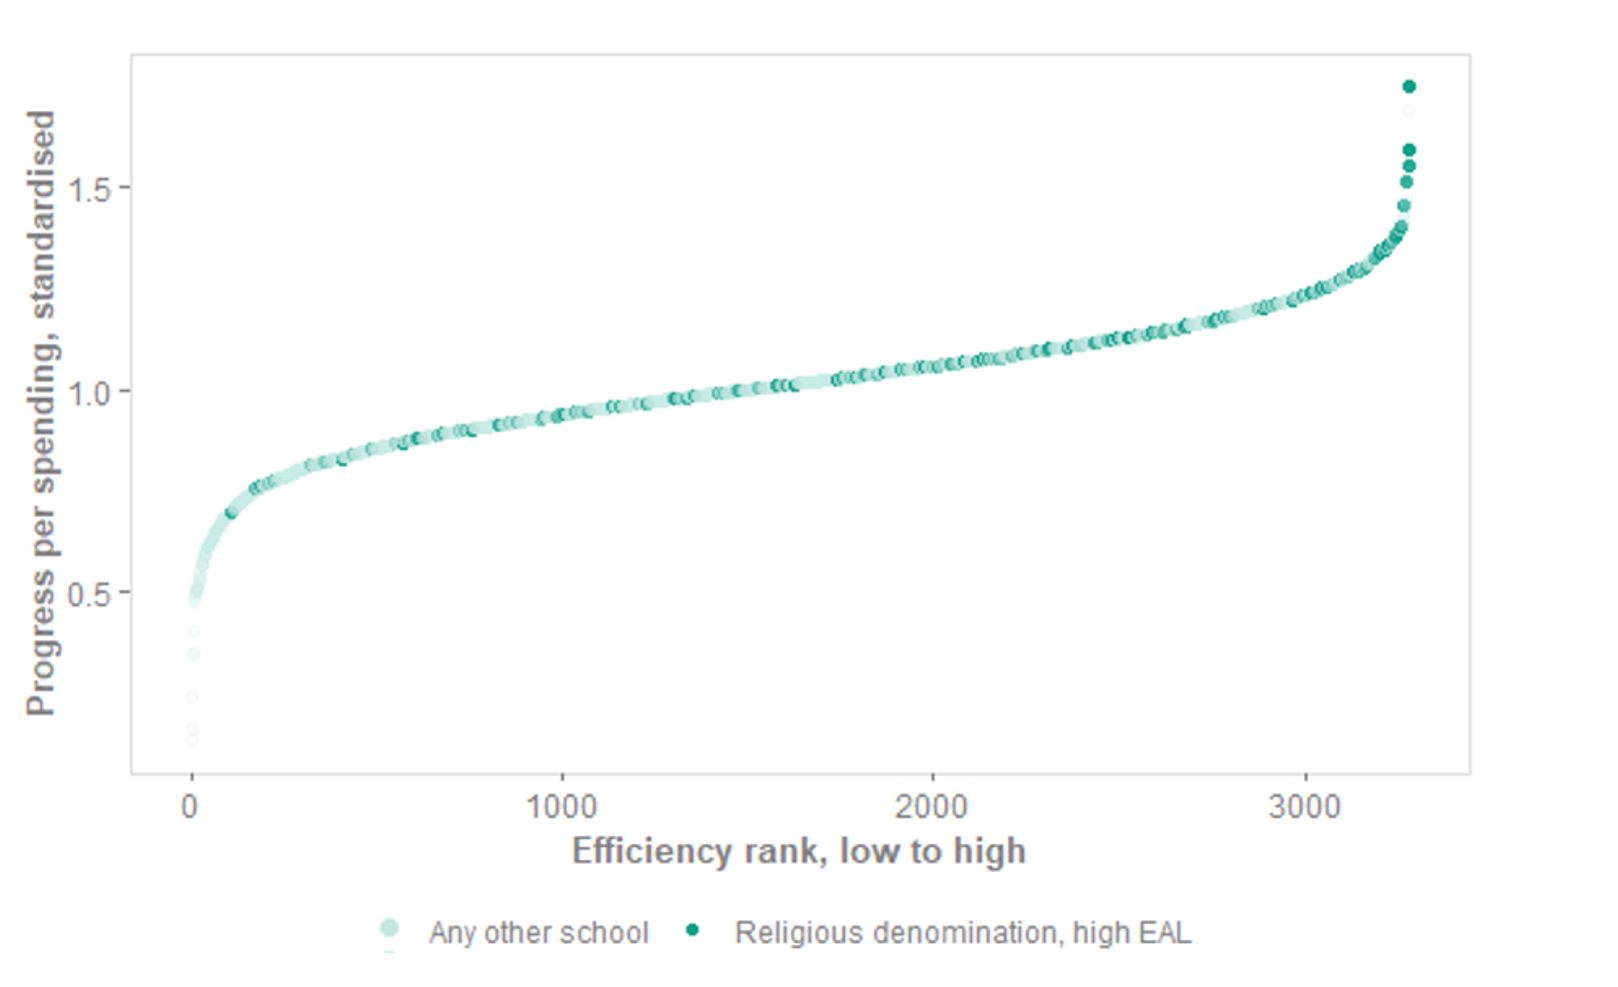
If we repeat this analysis but now restrict to those schools with a religious character that also have high proportions of pupils with English as an additional language (EAL)[4], we see that these schools are further favoured by this efficiency measure (Figure 3). Whilst they still feature at all points of the spectrum, the median efficiency rank for schools of religious denomination with high proportions of EAL is 2,239, compared with 1,604 for any other school. Twenty-five per cent of these schools are in the top eleven per cent nationally for efficiency.
This is because the progress made by EAL pupils reveals some of the flaws in the Progress 8 score which underlies the DfE’s efficiency metric. Some, not all, pupils with English as an additional language tend to make substantial progress as measured by Progress 8, because their outcomes at key stage 2 assessments tend to be artificially low. In addition, there is evidence of cultural factors which mean these pupils might be more likely to access tutoring.[5]
While it is true that some EAL pupils attract additional funding – which might lead to higher per-pupil spending and lower efficiency by this metric – this is only the case for EAL pupils who have been in the system for less than three years. Given that pupils need to be in the system for more than three years in order to have a Progress 8 score (because they need both KS2 and KS4 outcomes to be included in the calculation), the high progress score is contributed to by pupils who will not attract additional funding.
Figure 2: All secondary schools ranked by efficiency score, by recorded religious character
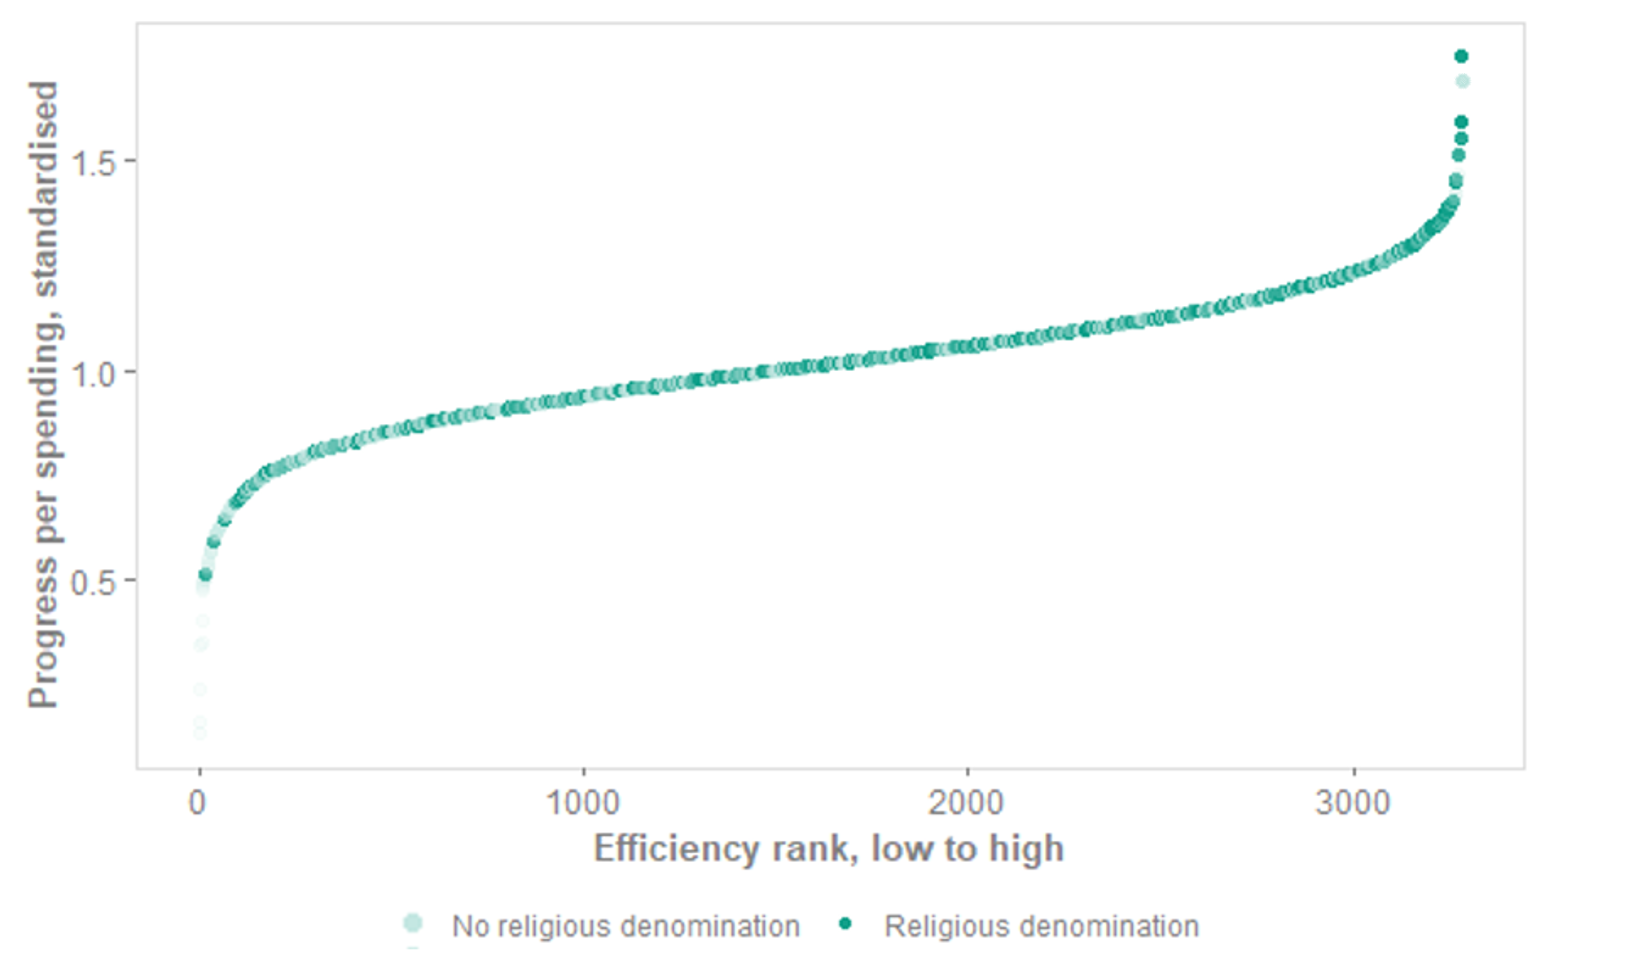
Figure 3: All secondary schools ranked by efficiency score, by religious character and high EAL
This suggests that this efficiency metric is biased towards less disadvantaged schools.
The metric uses similar schools to account for some of this bias, but not all of it
In practice, a school leader wishing to benchmark their efficiency will not be compared to all schools in the country but rather the DfE tool identifies similar ‘neighbour’ schools based on a number of characteristics: neighbours are selected on the school’s phase, type, whether or not it has a sixth form and the school’s percentage of pupils who are disadvantaged and who have identified special educational needs (SEN).[6] Based on these characteristics, the tool selects 49 schools that are most similar.
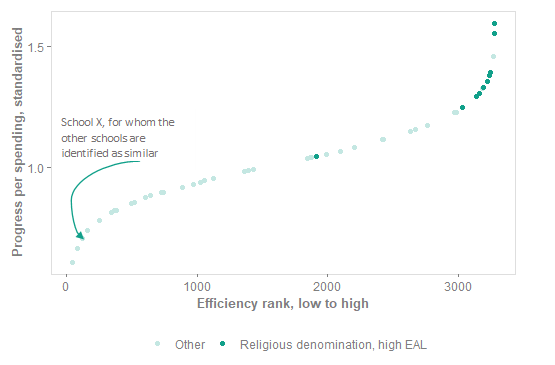
We have recreated this matching method using a city-based secondary free school “School X”, to demonstrate that, while this set of controls is proportionate to enabling a sufficient number of neighbouring schools to be returned each time, they do not eliminate the socially-selective intake bias that we explored in the first section.
As we see in Figure 4, School X is ranked second from the bottom for efficiency compared with its most similar neighbours. The top ranking of its most similar neighbours are disproportionately schools with a religious character with high proportions of EAL pupils. In order to achieve similar levels of efficiency, School X would do better to alter its pupil intake than to alter any of its financial practices.
Figure 4: Schools the metric identifies as similar to a secondary free school, ranked by efficiency score
Essentially, even though FSM and SEN are among the top things to control for we know that the Progress 8 measure, which underlies the efficiency metric, is still affected by other factors not controlled for in the DfE efficiency metric. EAL and religious character are just an example. Another example would be pupil mobility.
Even if the comparison groups were perfect, it may have limited scope to help schools improve efficiency
Even if the similar school matching exercise created an ideal set of neighbouring schools, we would argue that the efficiency metric does not provide a score that either encourages or enables schools to improve their efficiency.
If a school finds it has very low efficiency in comparison with its peers, how can it improve its score? It has one of two options, the first of which is to improve the progress its pupils make. This is sensible, however there already exist various accountability measures (which the efficiency metric is not) such as annual performance tables and Ofsted inspections which are designed to improve pupil progress. This means schools are already incentivised to improve pupil progress and the efficiency metric does not add anything.
The second option for a school looking to improve its efficiency score is to reduce its per-pupil spending. The methodology behind the metric explains that spending was selected as the denominator for the efficiency calculation as opposed to, say, funding, as schools have more control over their spending. Nevertheless, a school’s spending is closely linked to its level of funding, and indeed the revenue funding given through the NFF is funding that the DfE argue is necessary to deliver education to children currently in the school. The expectation is that money should be spent and not built up into significant reserves. All in all, a school leader is limited in their ability to actually shift their efficiency score and the metric doesn’t introduce any useful incentives beyond what already exists for schools.
DfE have always been very clear that this metric is not intended to be the whole story and that it should be viewed as a conversation starter for governors, trustees and other school leaders. It is also not intended to be used in isolation: once a school leader has made their efficiency comparison on the DfE’s financial benchmarking site they are then signposted towards other financial benchmarking tools where leaders can compare their school with their most efficient ‘neighbours’ on different levels of spending. This, however, returns us again to the issue of viable comparators: the problem remains where schools will be benchmarking themselves against the most efficient schools, which are disproportionately likely to have less challenging intakes.
There are still many positives to this tool, not least the fact that the method and data are so transparent that we were able to rebuild it using publicly available data. Its key drawback is that it only partially accounts for how school’s pupil intake affects its progress score and therefore might not serve up the most appropriate set of comparators for schools looking to improve their efficiency. A second key drawback is that it is limited in how it can help schools change their behaviour to improve their efficiency.
The next blog will introduce an alternative approach to measuring efficiency, which we have adopted with the aim of creating a metric which accounts for differences in pupil intake and which helps schools benchmark themselves against others which are operationally similar.
[1] Some adjustments are made first, for example adjusting expenditure to reflect where schools are located in areas with higher labour costs; both progress and spending indicators are weighted for the FTE of pupils in the school and both progress and spending indicators are standardised to bring them on to similar non-negative scales. Note that in this blog analysis we have standardised our indicators but we have not adjusted for local labour costs nor have we weighted our indicators by pupil FTE.
[2] https://assets.publishing.service.gov.uk/government/uploads/system/uploads/attachment_data/file/732881/Secondary_school_choice_and_selection.pdf
[3] As recorded on the Department for Education’s ‘Get information about schools’ service.
[4] Here ‘high’ is defined as having a proportion within the top quartile which is 20 per cent. Some schools with a religious character have between 80 to 100 per cent pupils on roll who have English as an additional language.
[5] Jerrim, 2017, ‘Extra Time: Private tuition and out-of-school study, new international evidence’, Sutton Trust; Mills, 2020, ‘The relationship between the Kumon maths programme and Key Stage 2 maths outcomes in England’, EPI.
[6] Note in our illustrative analysis we have not accounted for whether schools have sixth forms.