When Theresa May first stood at the lectern outside Number 10 in July 2016, she did so as the Prime Minister who would not only deliver Brexit but who would also tackle the “burning injustices” in British society; in education, in the criminal justice system, in the labour market, and in health.[1]
Our annual report on the attainment gap, published earlier this week, is hardly the legacy she would have been hoping for.[2] Disadvantaged pupils are still 18 months behind their peers by the end of secondary school; progress has stalled. In fact, if current trends continue, we may even be entering a period in which the gap between disadvantaged pupils and their peers starts to widen, undoing the progress made in recent years.
Those burning injustices? Still very much burning.
And so, we have a new Prime Minister, again standing at the lectern outside Number 10, again promising to deliver Brexit, and again making it clear that they haven’t forgotten the need for a domestic policy agenda.[3] For Boris Johnson it is around the theme of levelling up “answering at last the plea of the forgotten people and the left behind towns” be that in transport infrastructure, high speed broadband, or the so-called living wage.
As well as a significant commitment to reverse the real terms cuts in school spending by 2022, the PM has vowed to ‘level up’ school funding, by increasing the minimum level of per pupil funding that primary and secondary schools receive. A move that would see the minimum increase from £3,500 to £4,000 in primary schools, and from £4,800 to £5,000 in secondary schools.
Johnson’s campaign team estimated that this could be delivered with an additional £306m for primary and £50m for secondary schools to 2019-20 funding levels.[4] Do these sums add up? Well, yes and no.
School funding allocations to local areas are calculated on the basis of the government’s National Funding Formula.[5] This calculates allocations to schools based on pupil numbers and a range of characteristics such as levels of disadvantage, prior attainment of pupils, and whether the school has recently arrived pupils with English as an additional language. Currently these allocations are notional and are used to calculate the overall amount going to a local area, the exact amount a school receives is still determined by a local funding formula – though this has to follow a similar set of factors.
Johnson’s team appears to have based their estimates on DfE’s NFF allocations for 2019-20. While these are subject to revision with updated pupil numbers, it is a reasonable approach. In Figure 1 we have taken the same data and ranked local authorities by their per pupil funding at both primary and secondary level in 2019-20 from lowest to highest; with the proposed new funding floor highlighted.
Figure 1: Current per pupil funding under the NFF by local authority for primary (left) and secondary (right) schools with horizontal line to show proposed new funding floor.
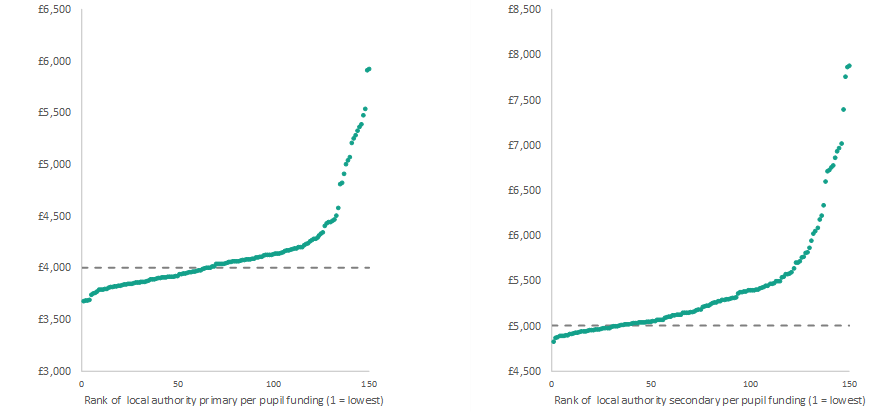
The range of allocations is significant. For example, at primary level it ranges from under £3,700 per pupil in York and Bracknell Forest, to nearly £6,000 in Hackney and Tower Hamlets. London boroughs dominate the group of the highest funded local areas.
The costings are based on moving all local authorities that are below the proposed floors up to them. There are 64 local authorities currently below the primary threshold of £4,000 and 33 local authorities below the secondary threshold of £5,000, bumping them up is simple and relatively small in school spending terms – around one per cent of the total schools block allocations.
But it does not deliver what the Prime Minister has actually appeared to commit to – that every primary and every secondary school will receive at least those amounts. The rates above are the rates that the local areas are funded at, they are basically the average amounts that a primary or secondary pupil at a school in the authority will get. Unless all schools in an authority are funded at exactly the same level some will, by definition, be below that amount, some above.
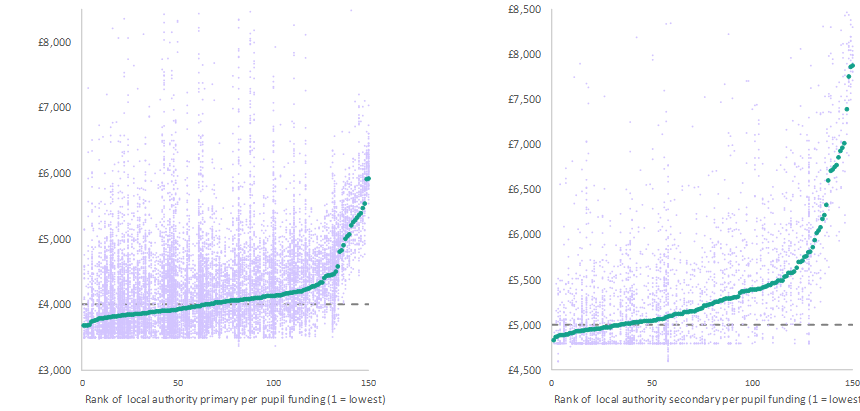
We illustrate the problem in Figure 2. We again rank local authorities by their per pupil allocations, but this time we also plot individual schools within the authority using the notional schools block funding. Now, rather than moving local authorities up to the new floor, we move all schools that are below the floor up to that level. Even relatively well funded local authorities could benefit if they have schools below the floor – which many do.
Though these amounts are not necessarily what the school actually receives – since that is still subject to the local funding formula – based on the notional DfE school level allocations data, around 41 per cent of primary schools and 34 per cent of secondary schools are below the proposed funding floors. We estimate that raising them to that level would cost around £590m for primary schools and £150m for secondary schools.[6]
So, if this is the true policy intention, then the previous estimates are around half the true cost if the pledge is to be delivered without redistributing funding from other schools.
Figure 2: Current per pupil funding under the NFF by local authority for primary (left) and secondary (right) schools – shown as purple dots – with horizontal line to show proposed new funding floor.[7]
In Figure 3, we estimate the per pupil increases by levels of disadvantage in the school – as measured by the proportion of pupils that are eligible for free school meals. Which schools would benefit from such an increase in the floor? While a range of schools could benefit, the schools that would benefit the most would be those that do not have the characteristics associated with additional funding under the NFF – schools without high levels of disadvantaged pupils, schools that are serving more affluent communities, those without large numbers of pupils with low prior attainment, those without pupils for whom English is not their first language. In short, schools with less challenging intakes.
Figure 3: Increase in per pupil funding under the proposed increase in the funding floor by level of disadvantage within the school.
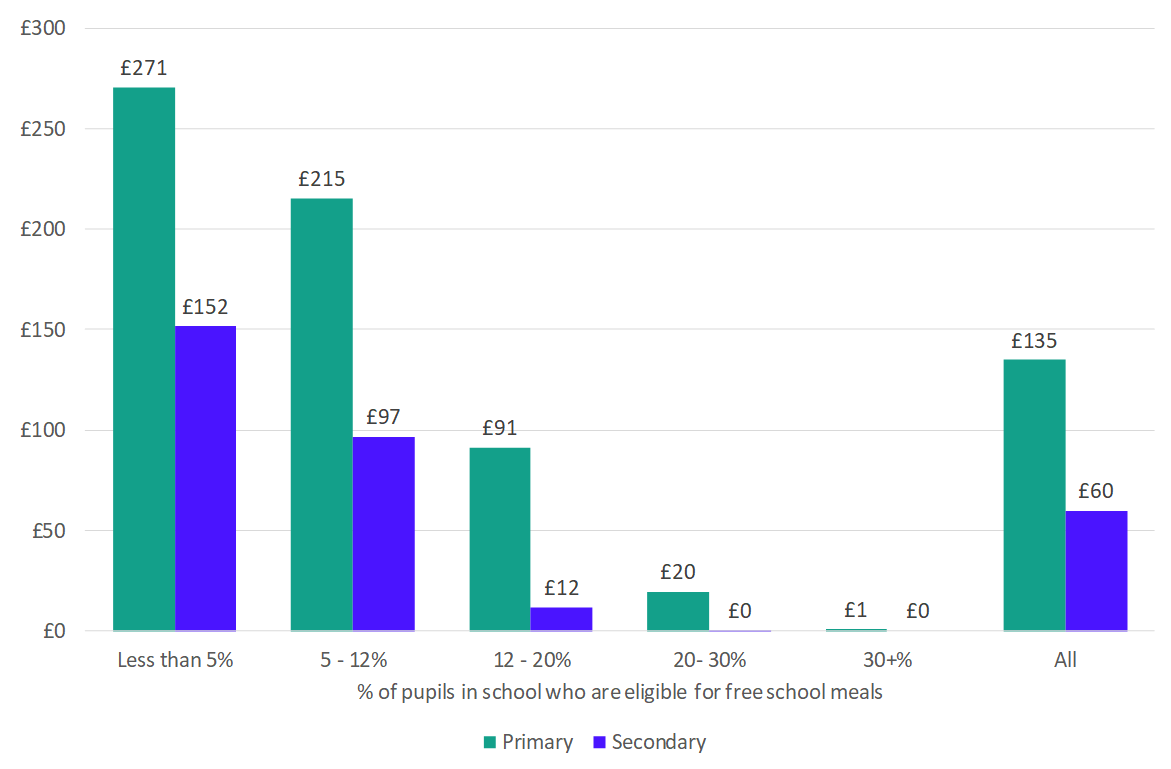
The relationship is clear but sadly not unexpected. Primary schools in which less than five per cent of pupils are eligible for free school meals – just one or two pupils in each year group – would see an average increase in per pupil funding of £271, while almost all schools serving the most disadvantaged communities would miss out. Overall, the average pupil eligible for free school meals would attract an additional £56 under this proposal, while the average pupil not eligible for free school meals would attract an additional £116.
And there is an interesting side story for secondary schools. Who could forget the noise three years ago at the proposal that one way to address social injustice was to expand academic selection with new grammar schools. Like so much in that time, the proposals were lost to the distraction of Brexit and simple Parliamentary arithmetic. The new Prime Minister may well end up helping grammar schools more than the last. All but 12 of England’s 163 grammar schools would benefit under this proposal; at an average of over £130,000 each to their total budgets.
‘So what?’ you might say. The schools that would miss out would still be funded at a much higher level than those set to gain, disadvantaged pupils would still attract higher funding than others, this is ultimately a small move to ‘level up’ rather than taking from some schools to pay others.
Sadly, this approach is likely to have been driven by political expediency rather than need. Trying to level up funding to make it more equal is to completely ignore the fact that the challenges faced, and the opportunities available, in different areas and to different pupils are simply not equal. On average, disadvantaged pupils leave school 18 months behind their peers, in some areas of the north east it’s two years. London aside, under this proposal, the north east would receive the lowest additional funding. And while many schools are struggling with recruitment and retention of teachers, it is disadvantaged schools that are struggling the most.
During the leadership campaign the now Prime Minister said that the attainment gap was not just a stark injustice but a major cause of economic underperformance across the whole UK.[8] If this is the Prime Minister’s idea of levelling up, then his legacy might be even more disappointing than his predecessor’s.