
Last month, the Department for Education released its annual snapshot of the teaching workforce in England, and the School Teachers’ Review Body (STRB) recently followed with its 36th report on teacher pay. The two tell a coherent story of a sector benefiting from favourable conditions but, perhaps, at risk of failing to fix the roof while the sun is shining. The headline numbers have improved: fewer teachers are leaving, schools are finding it easier to recruit, and there are fewer pupils for each teacher, which is a welcome easing of the past decade’s recruitment and retention crisis.
Look closer, though, and the picture is more nuanced, and less rosy, than the headlines suggest. The improvements are largely the work of external market forces rather than of deliberate policy, and they come from two directions.
On the demand side, a shrinking pupil population has reduced the number of teachers schools need. In the year to November 2025, the workforce shrank by 1,910 FTE teachers, to 466,000, but pupil numbers fell faster, easing some of the pressure on schools.
On the supply side, a weak graduate job market has made teaching relatively more attractive and slowed the rate at which teachers are leaving.
Because both forces – falling rolls and the graduate job market – sit outside the control of either the government or schools, the recovery may also be susceptible to a rapid reversal if the environment changes. And underneath the headline improvements sits a more uneven picture, in which some schools and subjects gain far more than others.
In this analysis, we assess the putative recovery and ask whether it means workforce policymakers can finally relax.
How can the workforce shrink yet still meet the government’s target?
The government pledged to recruit 6,500 additional teachers over this parliament, and ministers say they are around 70 per cent of the way there. On the face of it, the shrinking workforce appears to contradict that claim: how can the workforce fall by 1,910 teachers while the government closes in on a recruitment target?
The explanation lies in the pledge’s coverage. It does not count every teacher, only secondary, special and further-education teachers, against a 2024 baseline, and those phases did not drive the fall. Secondary slipped by only 0.2 per cent this year and special-school teaching grew by 3.9 per cent. The drop in the overall figure comes almost entirely from primary, where the workforce shrank by 1.3 per cent. Meeting the pledge in full is another question: the STRB judges the settlement the government has proposed to be too meagre to recruit the extra 6,500.
Falling teacher numbers in mainstream schools are being driven by falling pupil rolls, and the two phases are at different points in the cycle, as the chart below shows. Primary rolls have been falling since 2019 as a lower birth rate works through, and primary teacher numbers have followed them down, which accounts for most of this year’s overall fall. Secondary schools are following close behind: through the 2010s, pupil numbers grew faster than the number of teachers, pushing the number of pupils for every secondary teacher up from 15.4 in 2010/11 to 17.3 today. That squeeze is only now starting to ease as the smaller cohorts reach secondary age, and so far it has unwound only a little of the past decade’s deterioration.1
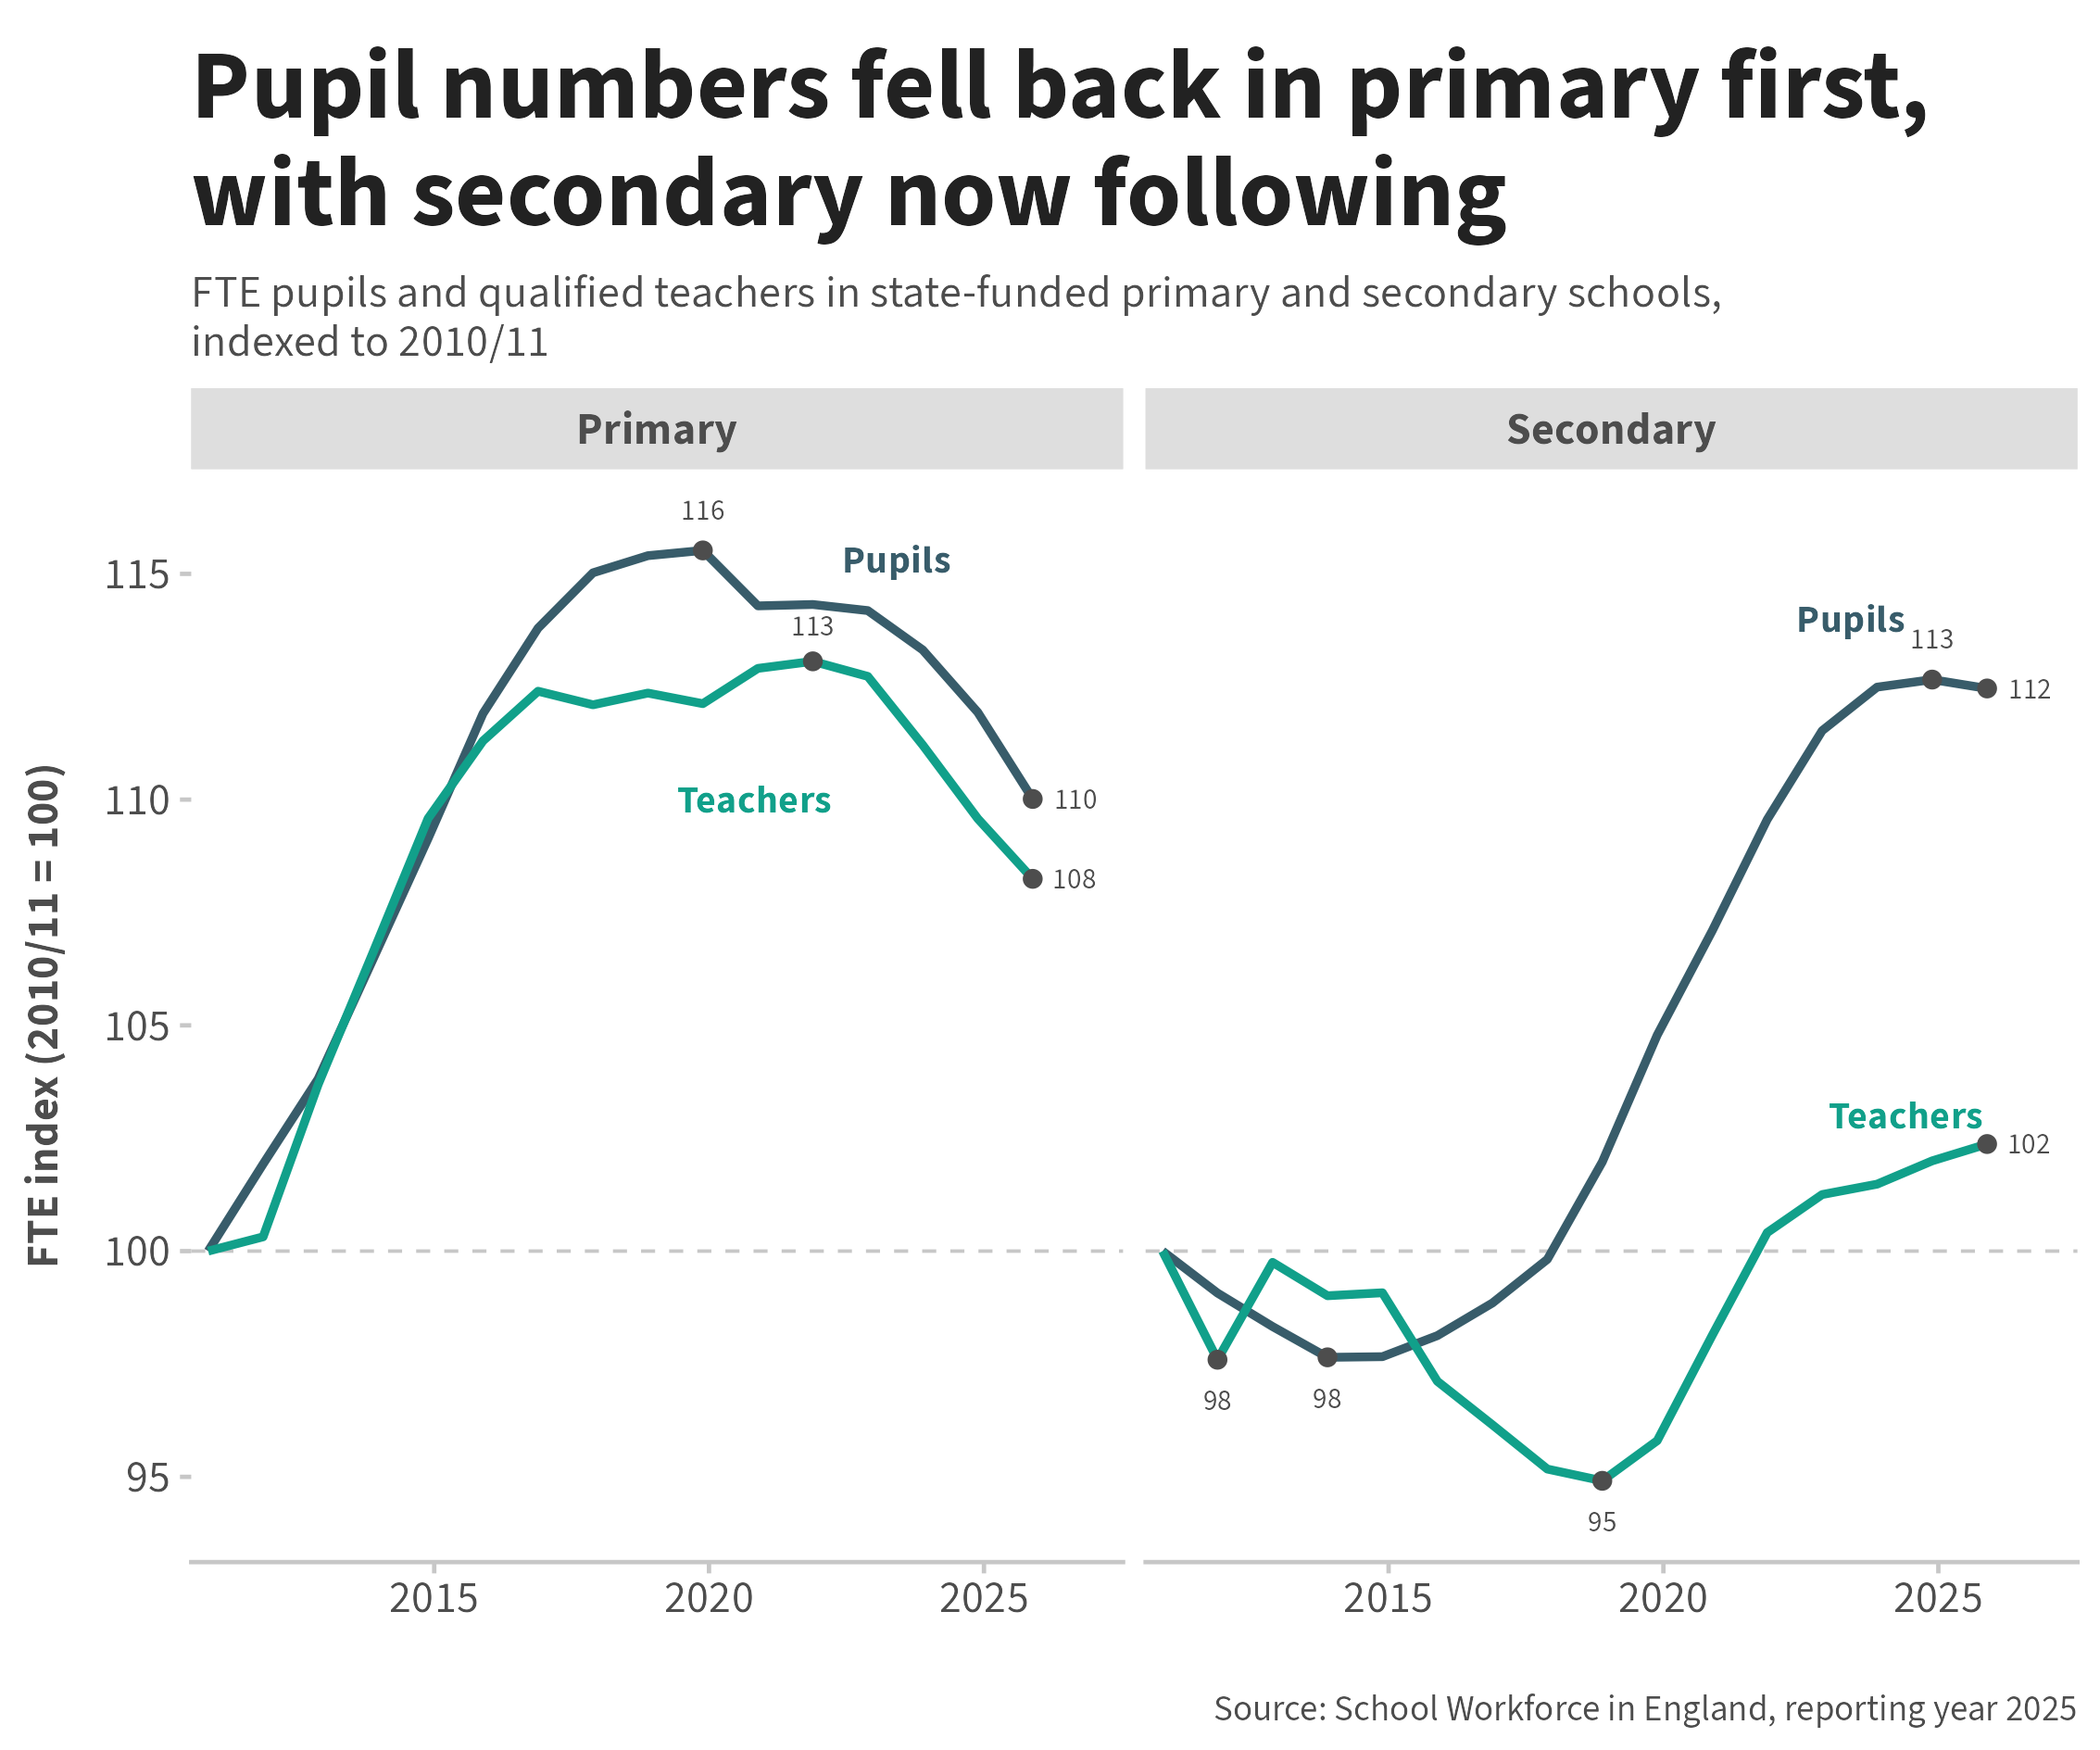
Fewer teachers are leaving, and more applying, as the labour market weakens
Falling rolls have eased the demand for teachers, while a weak graduate labour market has eased the supply side too. When private-sector jobs are scarce, teaching looks safer by comparison, so fewer teachers leave and more people apply. During the Covid-19 pandemic, for example, the share of teachers leaving for reasons other than death or retirement fell to 5.9 per cent in 2019/20 as outside options vanished, then sprang back to 8.5 per cent once the economy reopened. What initially looks like the profession becoming more attractive is often just a consequence of the wider labour market weakening.
The same thing is happening again now that graduate jobs are scarce. Recruitment at the country’s largest employers fell 14.6 per cent in 2025, its steepest drop since 2009, and the number of job applications they receive has roughly doubled since 2023.2 It shows up most among younger teachers, who have the most alternatives outside the classroom and so respond most to a weak job market. Since the leaving rate peaked in 2021/22, the share quitting by teachers in their twenties has fallen from 10.6 per cent to 9.5 per cent.
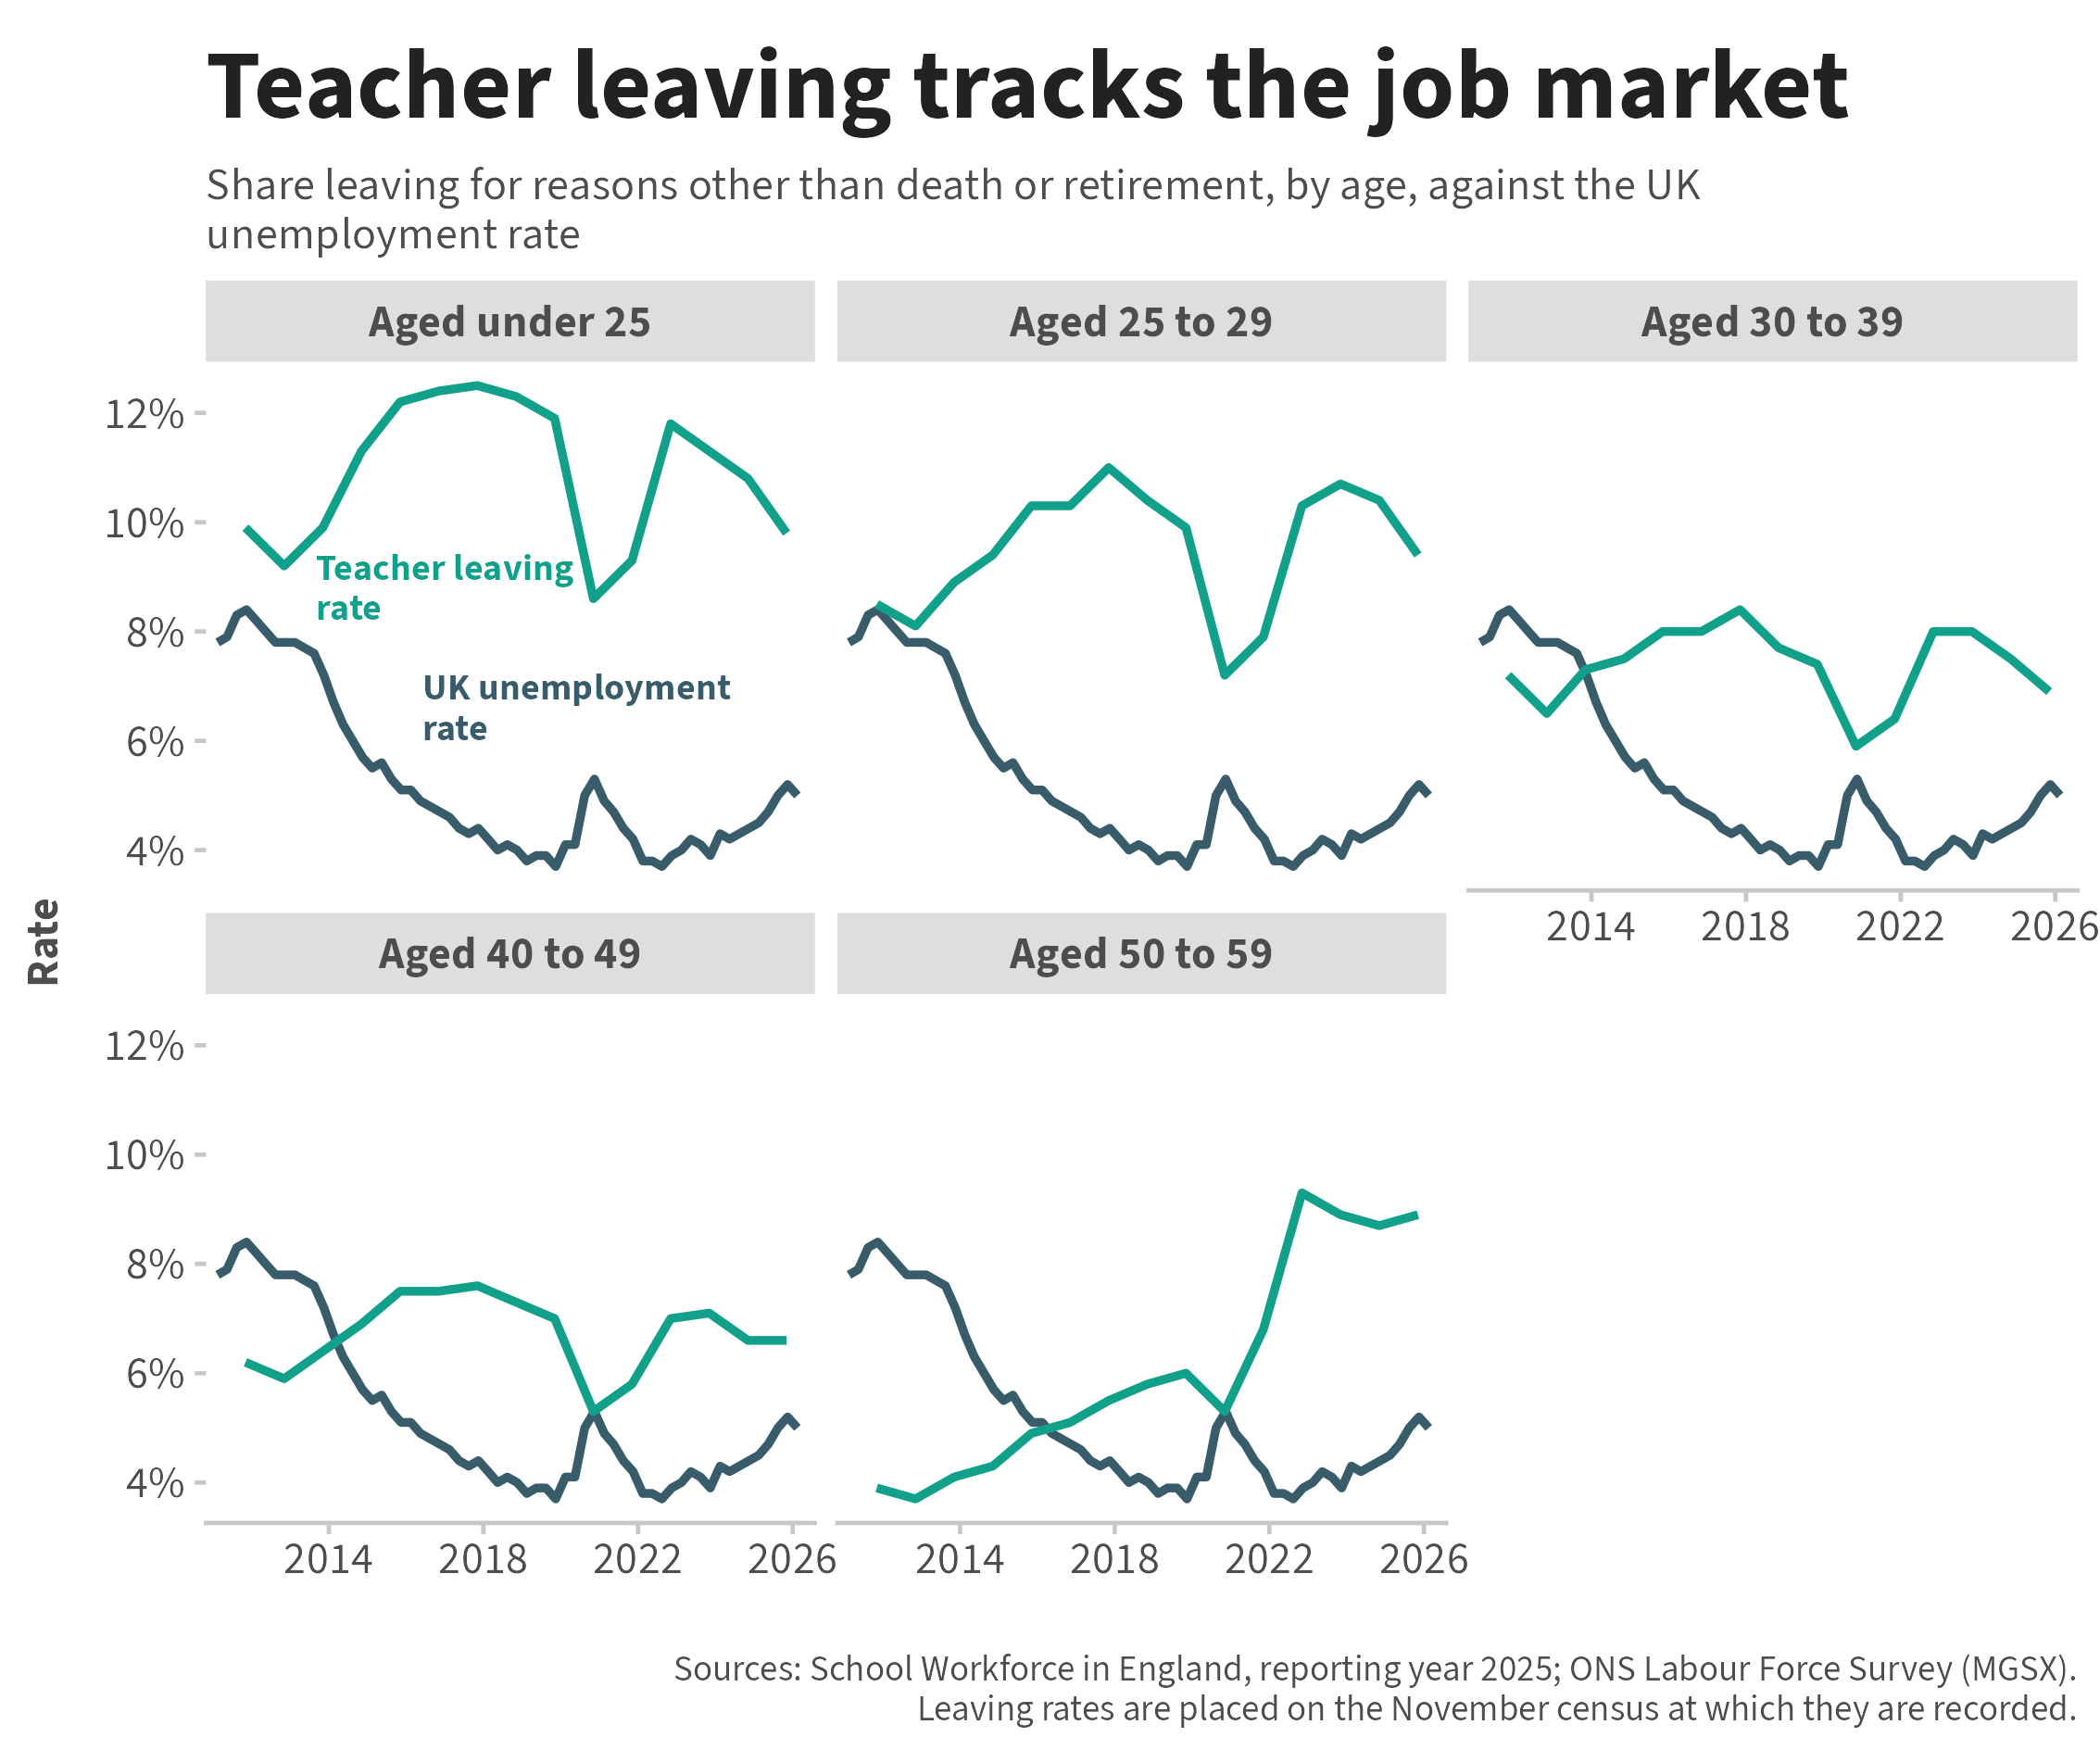
Pay has not kept pace with the economy
Both the shrinking cohort of pupils, and the weak graduate market, sit outside the government’s control. Pupil numbers are unlikely to change without warning but there is a risk that an upswing in the labour market could rapidly reverse the improving situation in schools.
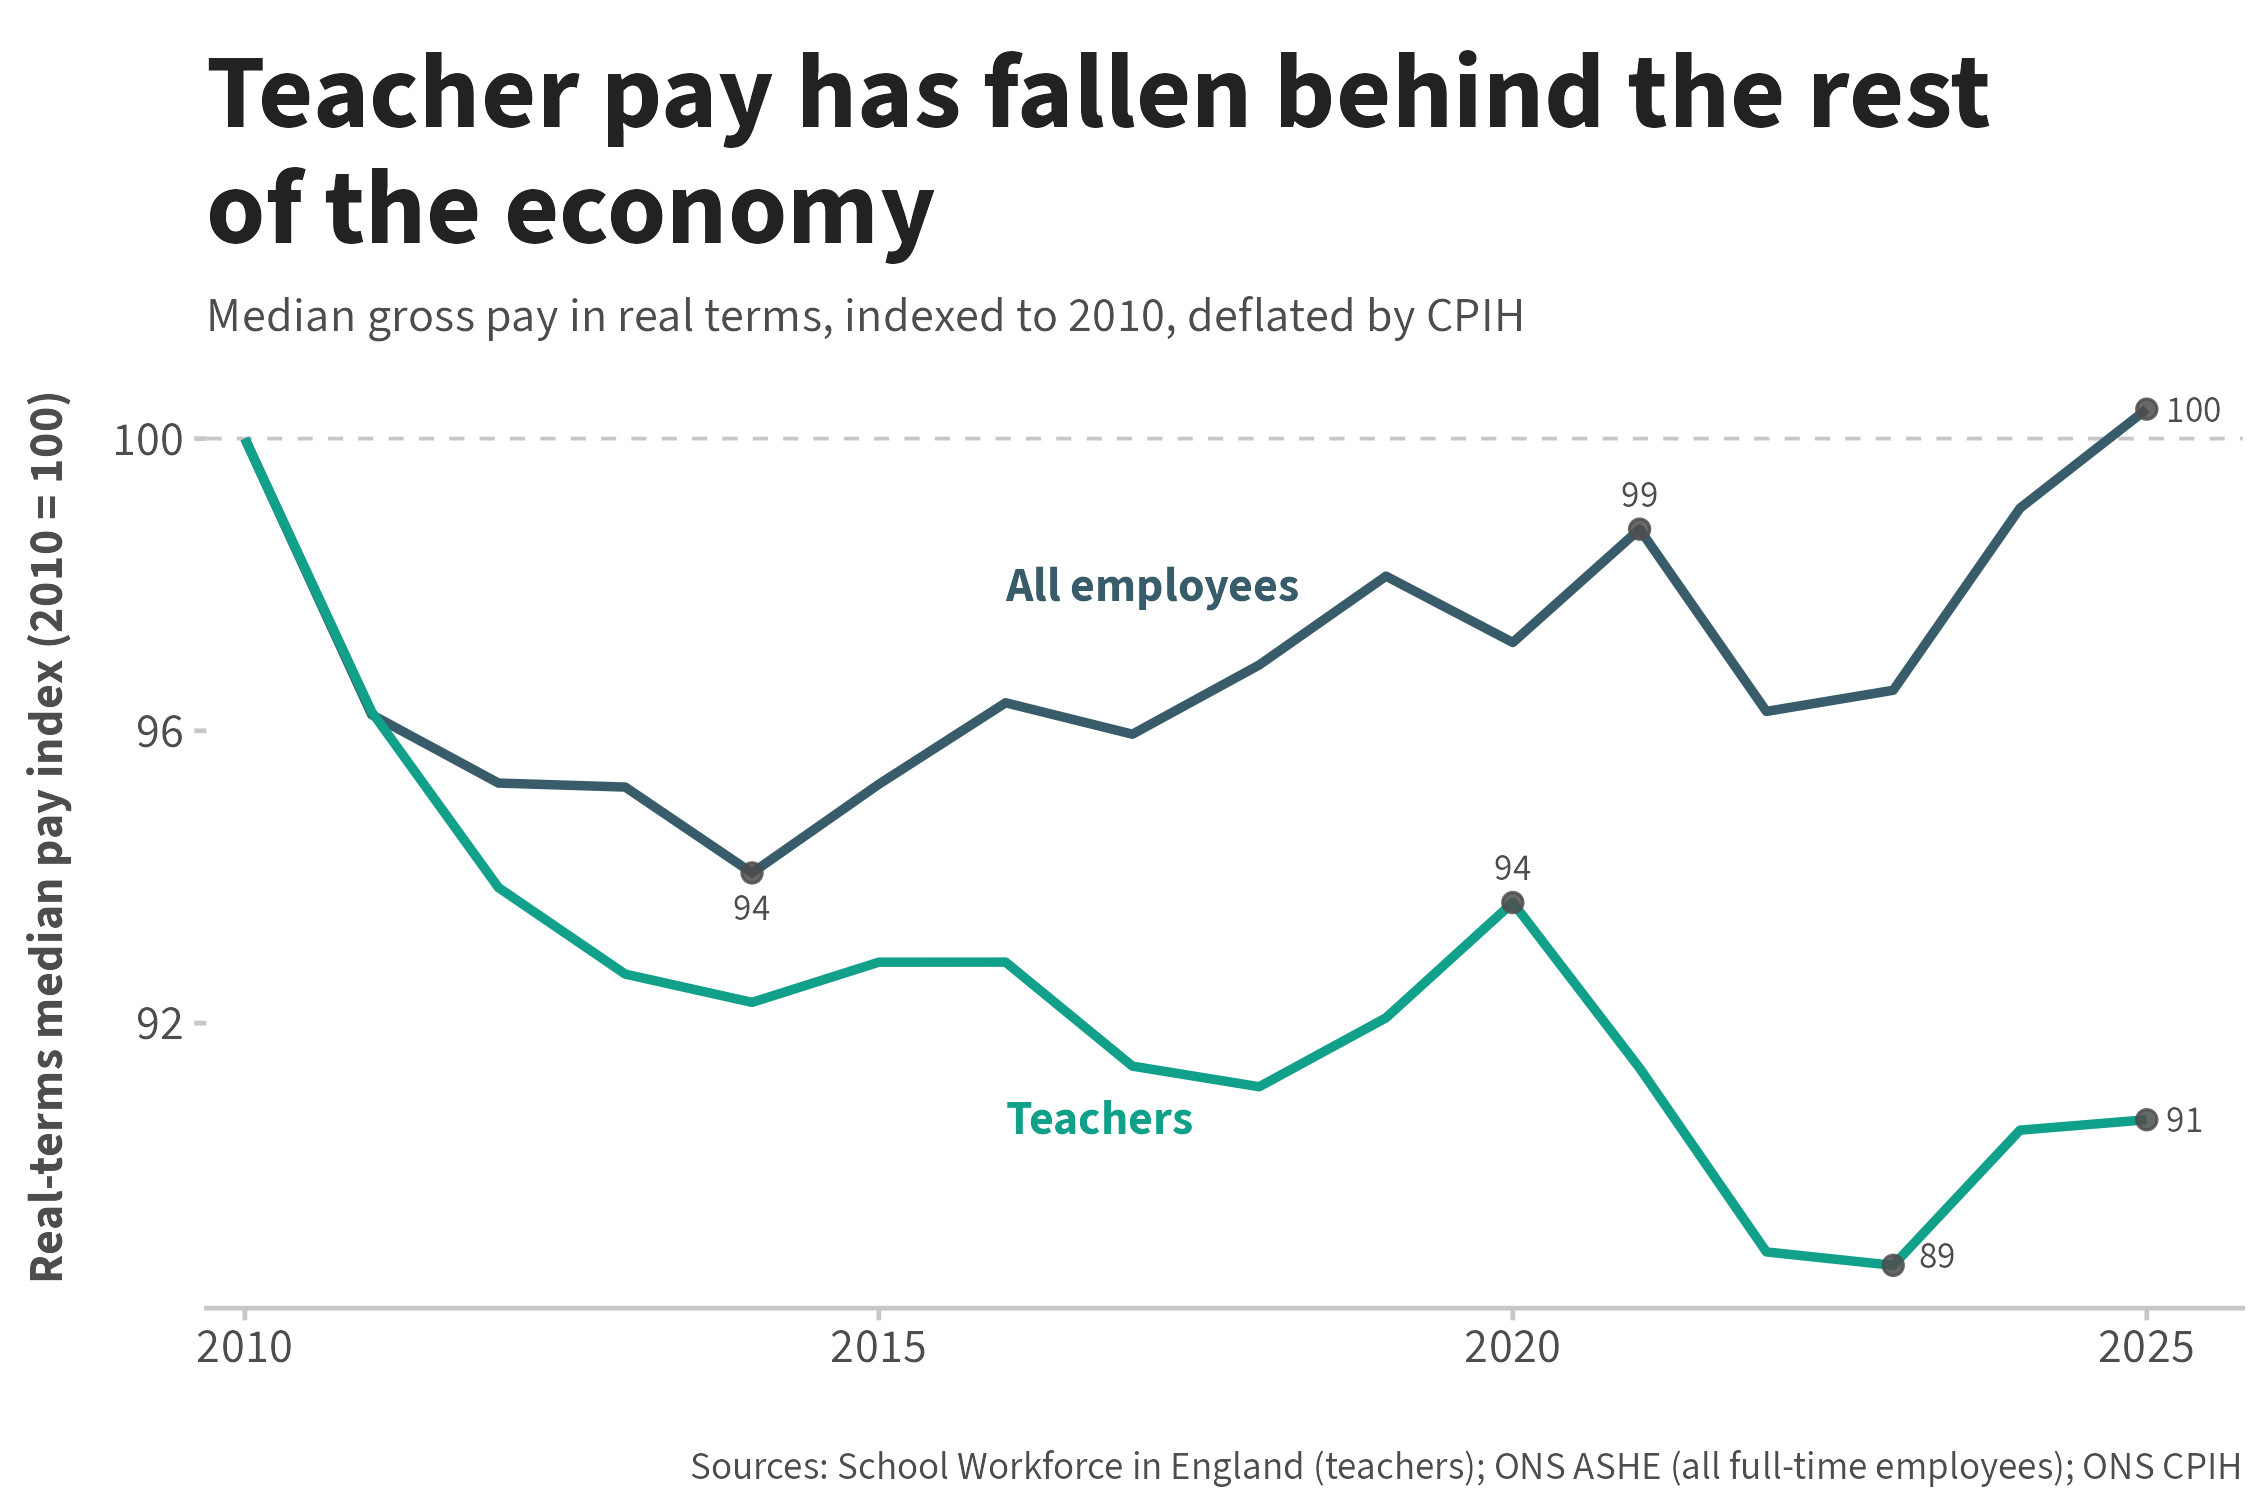
The most direct lever the government holds to affect the relative attractiveness of the profession is pay, and there it has moved in the wrong direction. Cash awards have been positive, but in real terms the median teacher now earns about 9.3 per cent less than in 2010, while pay across the rest of the economy has returned to 2010 levels, up 0.4 per cent over the same period.3
If anything, the chart is generous to teaching. On the STRB’s figures, teachers’ real-terms pay is down 13.9 per cent since 2010, against 9.2 per cent for professional occupations more broadly, and just 0.6 per cent for the whole economy, suggesting teaching has lost ground even against other graduates, whose own pay has slipped.4
Nor is the shortfall evenly spread. The STRB’s market benchmarking finds pay is competitive at the very start of teachers’ careers but falls below the rate for comparable jobs by the fifth year, and slips even further behind for experienced teachers and leaders.
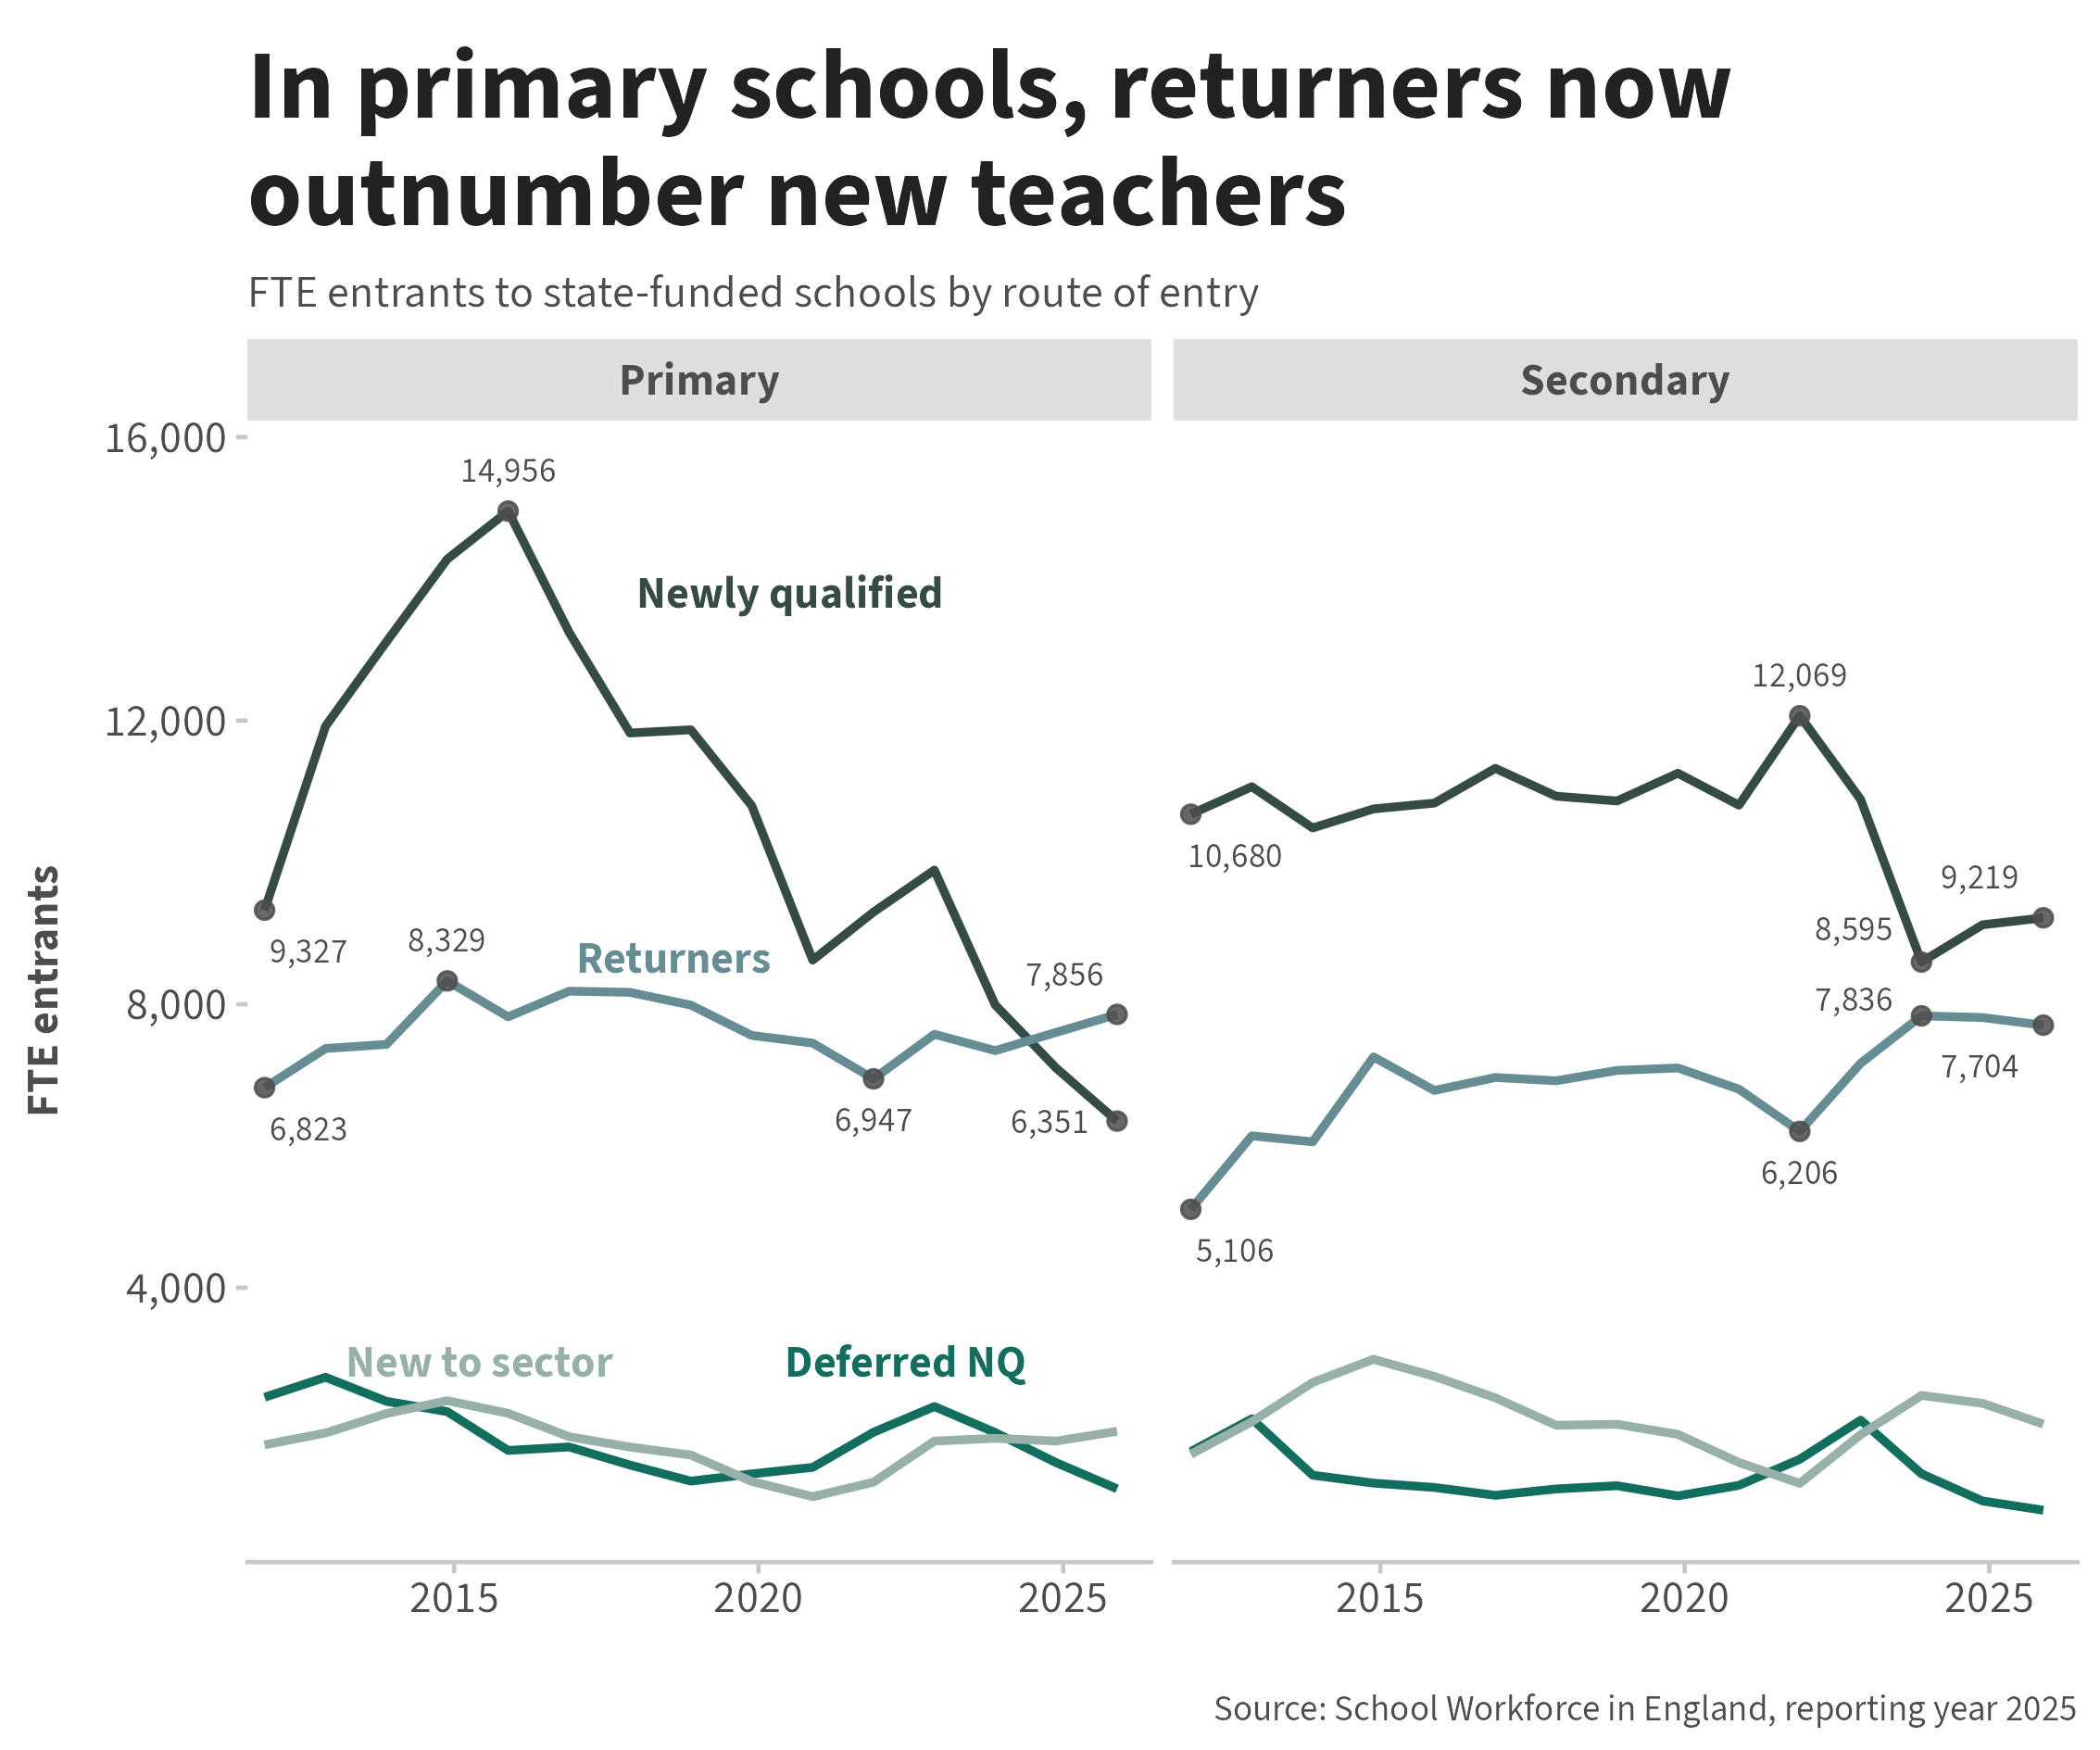
The profession is leaning on returners as retention erodes
Of course, a recovery in recruitment does not immediately mean more teachers arriving in the classroom, because trainees take a year to qualify. The people reaching classrooms this year reflect last year’s smaller intake, and the number of newly qualified teachers has carried on falling. The gap is being filled instead by teachers returning to the profession. In primary schools returners now outnumber the newly qualified, so the workforce is increasingly being sustained by people coming back rather than by a growing flow of new entrants.
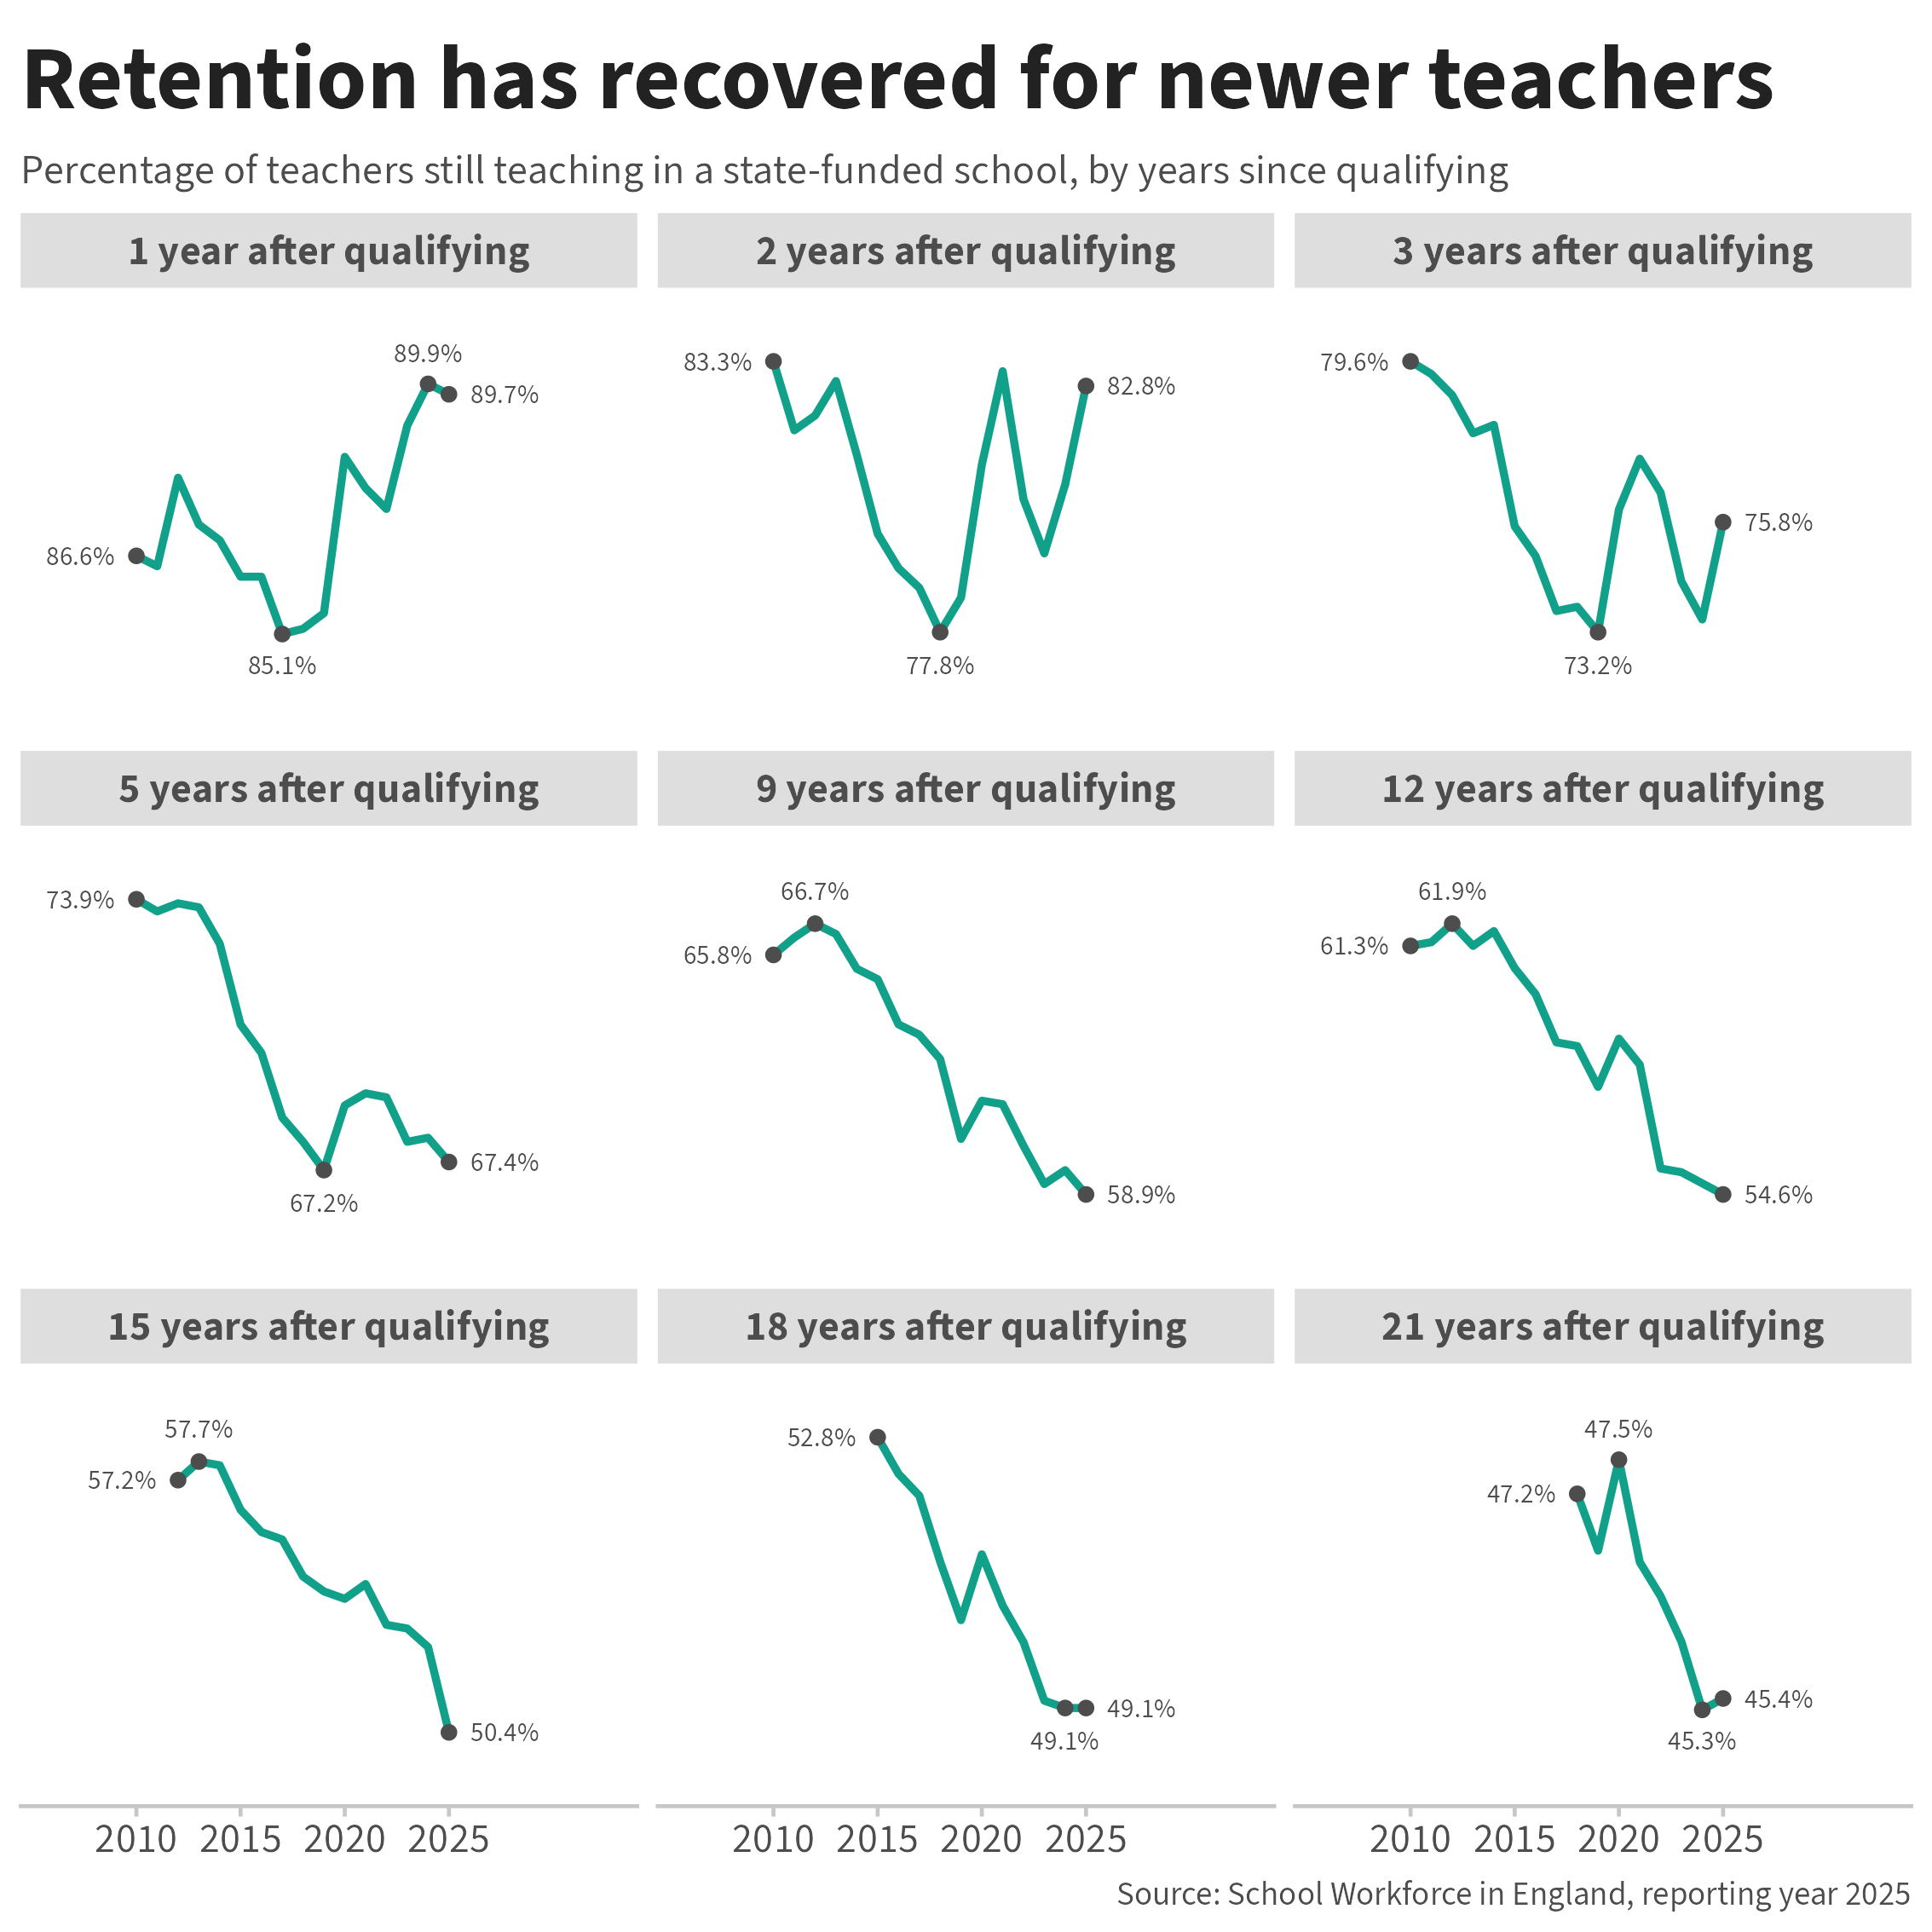
New entrants are declining, but retention tells a more encouraging story, at least for the newest teachers. The share still teaching a year after qualifying is near its highest level in over a decade, at 89.7 per cent, and the recovery now runs through the first two to three years, plausibly helped by the support new teachers receive through the early career framework. It has not reached further up the career, though: five or more years out, retention sits below where it was a decade ago, even if it has largely stopped falling rather than continuing to slide. Because these are cumulative survival rates, those lower figures reflect losses built up by earlier cohorts over many years rather than a fresh exodus; ten years after qualifying, the share still teaching has slipped from 63.0 per cent to 57.7 per cent, though it edged up in the latest year. The gains are real, then, but concentrated at the start of a career and yet to reach experienced teachers.
The gains don’t reach the schools and subjects that need them most
A better national picture does not necessarily mean that teachers are reaching the schools that need them most. When every school is recruiting from the same pool, the more attractive ones tend to win, and a teacher who leaves a struggling school more often moves to a less challenging one than leaves teaching altogether. Because the hardest-to-staff schools are largely those serving the most disadvantaged communities, a good year for the average can leave them no better off and may even widen the gap between schools: the subjects and schools that were short before tend to stay short.
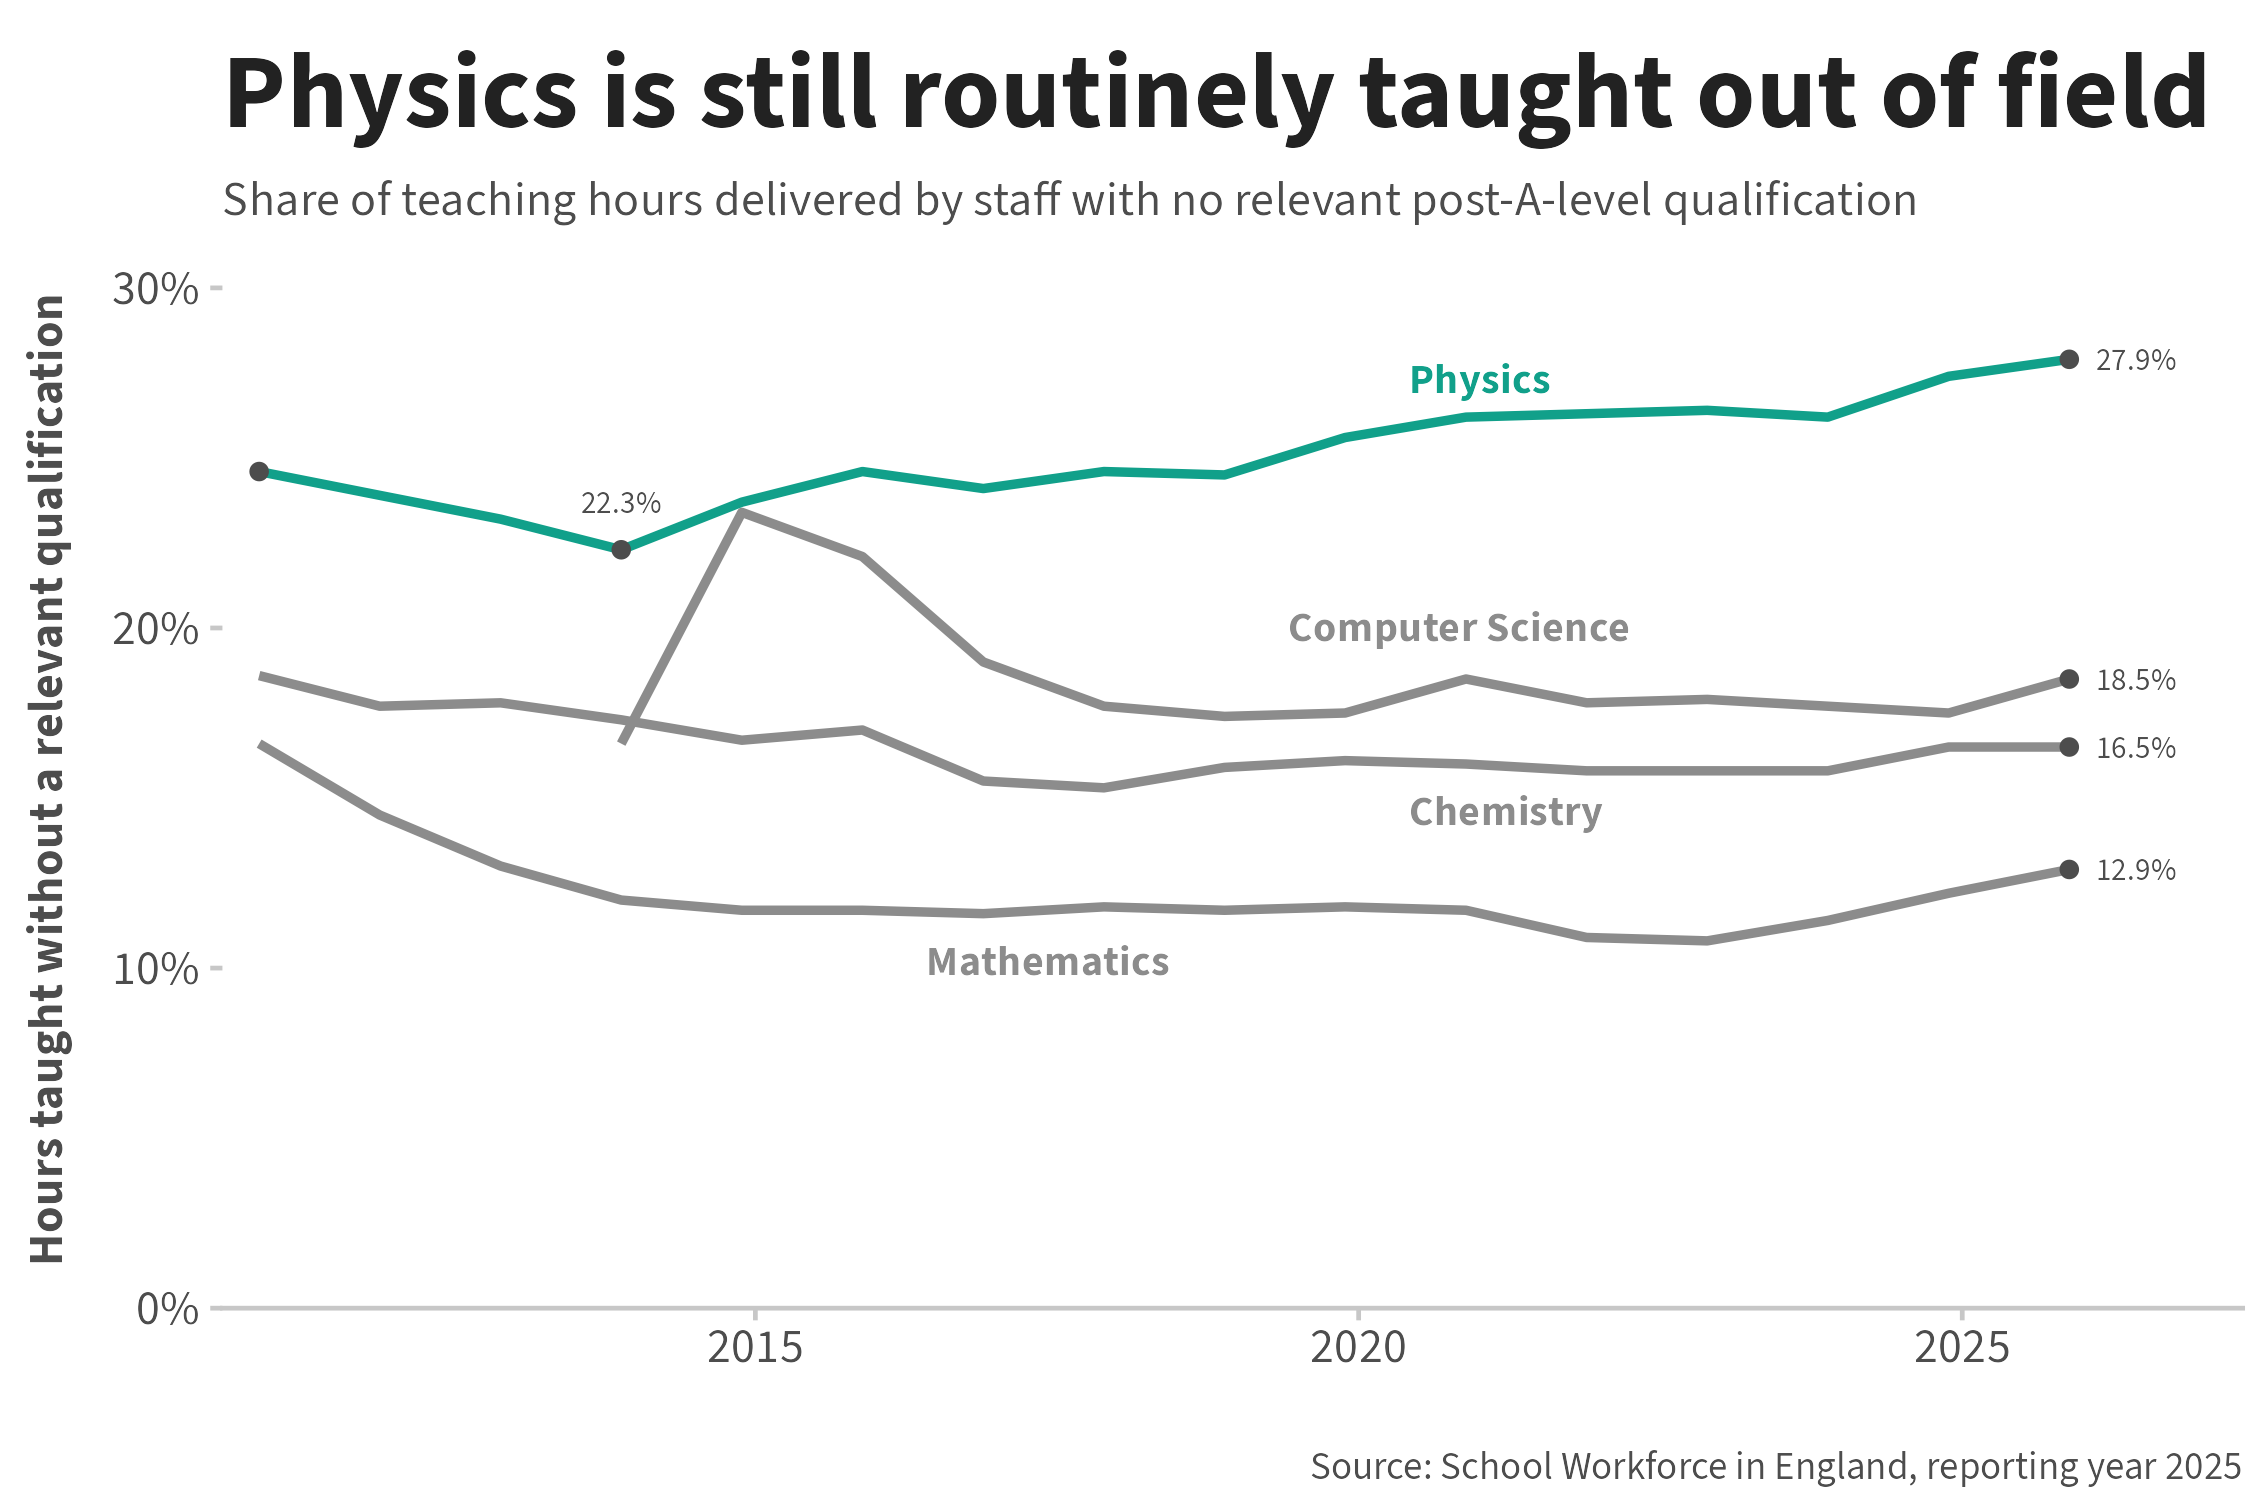
Across subjects, one of the clearest markers of shortages is out-of-field teaching: a lesson taken by someone with no qualification in the subject beyond A level. The starkest case is physics, where roughly 27.9 per cent of physics hours are delivered by non-specialists, and the Institute of Physics finds a quarter of state schools have no specialist physics teacher at all. The gaps are also widest in disadvantaged schools: our Closing the Workforce Quality Gap found the share of lessons there taught by a relevant graduate fell from 58 to 47 per cent over the past decade.
Reading the recovery
After a decade of deepening shortages, this is undoubtedly a better year. Fewer teachers are leaving, schools are finding it easier to recruit, early-career retention is near its highest level in over a decade, and falling pupil numbers have eased the squeeze in the classroom. The worst of the profession’s difficulties may be behind it. However, the government engineered very little of this: a shrinking pupil population has done the work on the demand side, and a weak graduate job market has helped on the supply side. Both could reverse, and while pupil numbers will keep falling for some years yet, the job market will turn as soon as the economy strengthens.
The economic and demographic cycles have handed the government breathing space, and with it the chance to fix the fundamentals. Pay is the most powerful lever it holds, and it has slipped: teaching now pays less, against the graduate jobs it competes with, than it did a decade ago. But this only shows that teaching has become less well paid on average, it does not show which groups of teachers have become harder to recruit and retain as a consequence. The improvements in recruitment and retention are unevenly spread, too, and have yet to reach the schools and subjects where the STRB’s own benchmarking finds teaching continues to struggle most.
Yet the STRB’s recommendation, a flat rise spread thinly across the whole pay scale, does little for exactly those places. The government’s other pay policies help: targeted retention payments to shortage-subject teachers in disadvantaged schools are a good start, but they reach only the early-career years in a handful of subjects. Holding on to experienced specialists where they are scarcest will take more than a blanket pay rise; perhaps a premium for shortage subjects beyond the early career, or higher salaries for the hardest-to-staff schools.
As more is understood about this recovery, the figure to watch is not the workforce total, nor the government’s pledge, but whether the right teachers are reaching the right schools, and whether these gains outlast the next upturn in the graduate market.
- The pupil-teacher ratio is not the same as class size. Teachers spend part of the week out of the classroom, and the ratio counts qualified teachers only, so it moves with non-contact time and the deployment of teaching assistants as well as with class sizes.
- Graduate-recruitment figures are from High Fliers’ The Graduate Market in 2026, cited by the STRB. The survey covers the country’s largest graduate employers and is weighted towards London and the South East, so it captures the scale and direction of the graduate-market turn rather than a whole-economy measure.
- The teacher series is actual gross pay by headcount, including part-time teachers at their pro-rated pay rather than a full-time-equivalent salary, while the comparator is ONS’s full-time-employee median. The two are not perfectly matched: the part-time share of the teaching workforce rose from 21.4 per cent in 2010 to 25.3 per cent by 2025, so some of the apparent real-terms fall reflects this shift towards part-time working rather than a decline in the going rate.
- The STRB’s figures use a different basis from the chart above — FTE gross earnings deflated by CPI, rather than the headcount actual-pay, CPIH measure used here — which is why they do not match exactly. The ranking is unaffected.