Disadvantage
Figure D1 shows how the 16-19 disadvantage gap over students’ best three qualifications has changed since 2017. The gap was broadly stable prior to the pandemic, and there was small progress in narrowing the gap in 2019. However, the gap has widened since then, such that disadvantaged students were 3.5 grades behind their peers by 2022.
Figure D1: The 16-19 disadvantage gap widened by almost a third of a grade since 20191
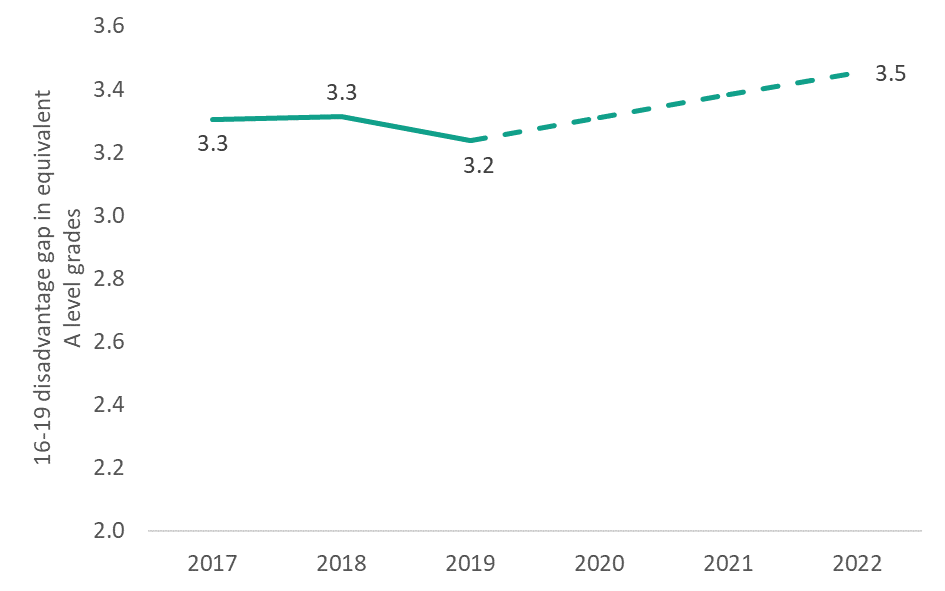
The widening of the gap since 2019 is likely to have been driven by a number of factors. As demonstrated in our report on gaps in 2021, differences in assessment between A level and applied students caused the gap to widen under TAGs. As 2022 grading was still partially pinned to the 2021 grade distributions, this effect will have been sustained into 2022. It is also likely that learning loss experienced due to school and college closures and the ongoing disruption of the pandemic were not felt equally by students from all backgrounds, although we are unable to disentangle these two effects.
How do we measure the 16-19 disadvantage gap?
We measure the 16-19 disadvantage gap by comparing the attainment of disadvantaged students to their non-disadvantaged peers over their best three qualifications by the end of their 16-19 study. As there is no comprehensive data on free school meal eligibility during the 16-19 phase, we define disadvantaged students as those that claimed a free school meal in any of the six years prior to finishing key stage 4. Unlike in earlier phases we do not use a mean rank methodology or months measure to express the gap. This is because there are a greater number of students in the 16-19 phase who do not finish their courses, or otherwise have zero qualifications, so a mean rank measure is distorted by the number of students tied on zero points.
Instead, we use a ‘grades’ measures. A disadvantage gap of 3.5 can be interpreted as meaning that on average, disadvantaged students finishing their 16-19 study in 2022, were the equivalent of between three and four A level grades behind non-disadvantaged students.
Further detail on how we map all level 1-3 qualifications on to a single scale to create our point score measure, and changes to the methodology since previous publications can be found in the ’16-19 methodology’ section of this report.
Persistent disadvantage
Figure D2: The persistent disadvantage gap was a whole grade wider than our main disadvantage gap measure
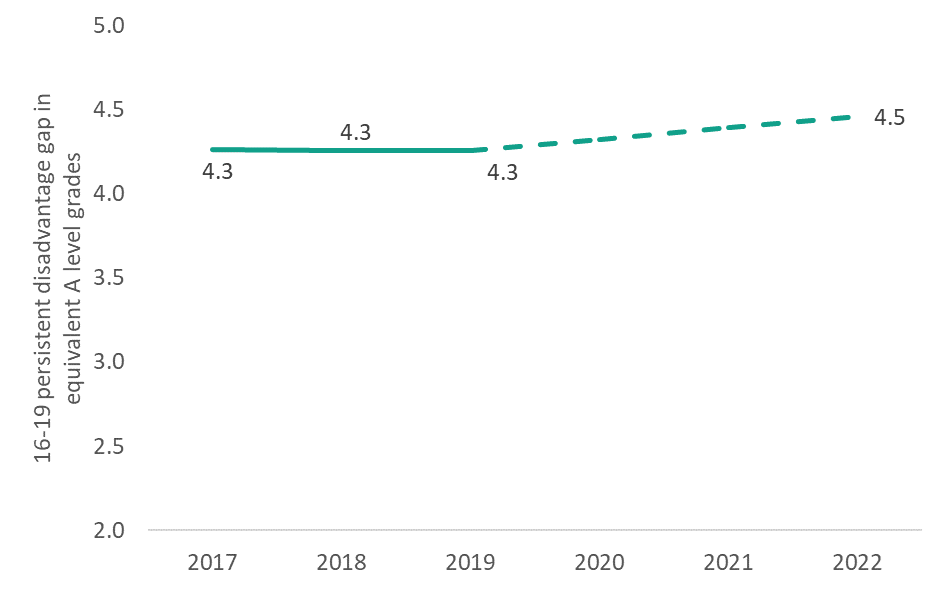
Figure D2 shows a similar trend through time as our headline 16-19 disadvantage gap measure: little change during the period 2017 to 2019, followed by a pronounced widening over the course of the pandemic. By the end of 2022, persistently disadvantaged students were 4.5 grades behind non-disadvantaged students.
Notably, the magnitude of the persistent disadvantage gap is a full grade wider than our headline disadvantage gap measure. This suggests, as with earlier phases of education, that those in long term poverty face significant and additional educational challenges, even compared to those who experience economic disadvantage over a less sustained period. The widening of this gap in recent years indicates that, as with the wider group of disadvantaged students, the pandemic disproportionately affected persistently disadvantage students.
How do we measure the 16-19 persistent disadvantage gap?
In the 16-19 phase, we define persistently disadvantaged students as those who claimed a free school meal for at least 80 per cent of their time in school up to year 11, based on spring school census records. We compare the attainment outcomes of these students to those that had not claimed a free school meal at all within the last six years of their time at school. This means that we are using the same comparator group for both our disadvantage and persistent disadvantage gap measures, allowing for meaningful comparisons between the two metrics.
Qualification type
Unlike in earlier phases of education, there is little uniformity to the qualifications student enter in 16-19 study. Fewer than half of students enter A levels. Others opt for technical or vocational level 3 qualifications, while some enter lower-level qualifications or continue study towards level 2 English and maths. However, we observe that these differences are not evenly distributed between disadvantaged and non-disadvantaged students.
Figure D3: The volume and type of qualifications held is different for disadvantaged students
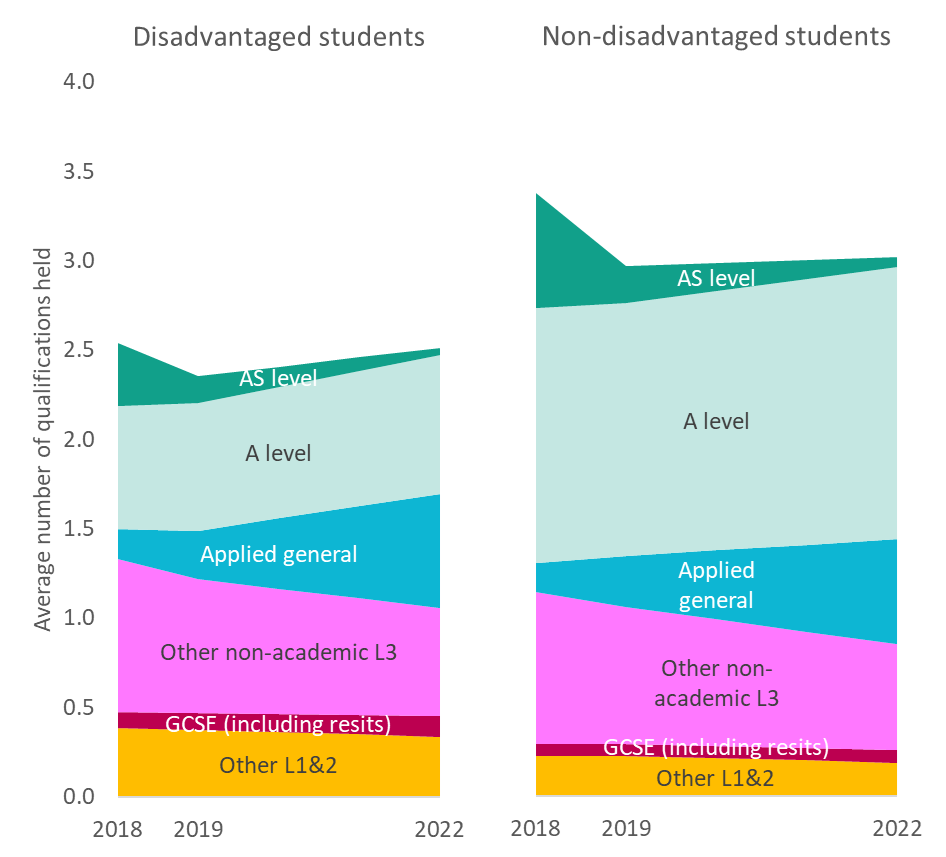
Overall, we see that there has been a sharp increase in the take up of applied general qualifications in recent years, corresponding with a decrease in the number of other non-academic level three qualifications. This trend will have been driven by incentives stemming from changes in the qualifications that are included in the 16-19 performance tables, which are used to hold schools and colleges accountable for student outcomes. A focus on applied general qualifications in performance metrics will have incentivised awarding bodies and education providers to offer more of these courses, and less other non-academic qualifications.
We also see notable differences in the qualifications held between disadvantaged and non-disadvantaged students. Most prominently, disadvantaged students entered fewer qualifications on average, which will contribute to the lower attainment of this group, and hence to the gap.
The other substantial difference is in the composition of qualifications held. Disadvantaged students were less likely to have entered A levels compared to other level 3 qualifications, and were more likely to hold lower level qualifications.
Figure D4: The 16-19 disadvantage gap has widened for all qualification types since 2019
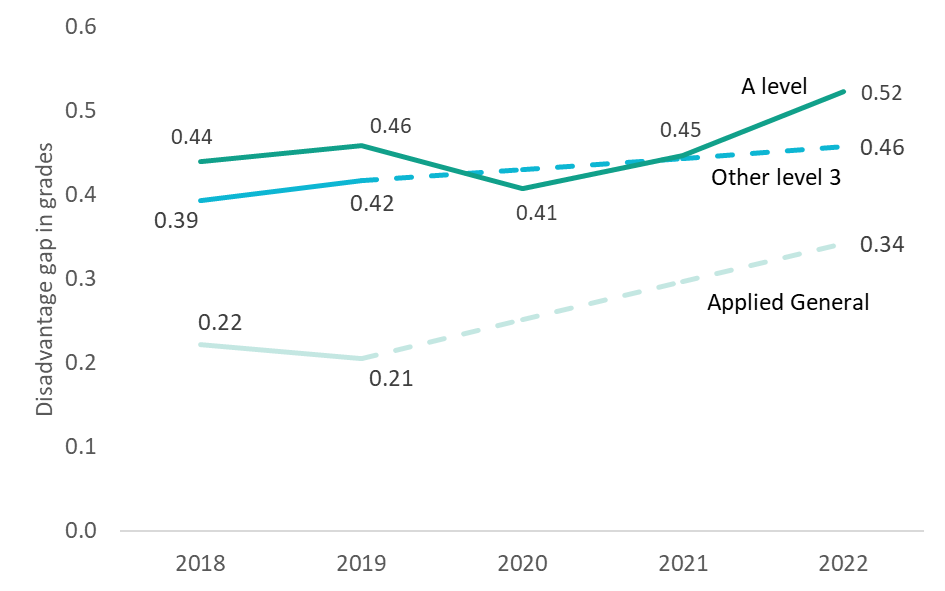
Figure D4 shows the change in 16-19 disadvantage gaps by qualification type. The gaps displayed here are smaller than our overall gap measures as they are reported per qualification, rather than over students’ best three results.
As with our overall measures, data from 2020 and 2021 are not directly comparable, so we have dashed the lines between 2019 and 2022. However, the changes in coverage had little impact upon A level students, so we have reported the full time series for this group.
Figure D4 shows that the 16-19 disadvantage gap for all level 3 qualifications is wider now than it was in 2019, before the pandemic. However, each of these measures individually is likely to understate the overall size of the gap between disadvantaged and non-disadvantaged students, due to differences in the qualifications entered between these two groups, as shown in figure D3.
We also see that in 2020, the disadvantage gap for A level students actually narrowed, even though the overall disadvantage gap widened at this point. From 2020 onwards, we see that the gap for A level students has widened each year, even with the return to exam-based assessment. By the end of the 2021/22 academic year, the A level disadvantage gap per qualification was 0.52 grades, compared to 0.46 grades in 2019. For applied general and other non-academic level 3 qualifications, the disadvantage gap was 0.34 and 0.46 grades respectively in 2022, compared to 0.21 and 0.42 in 2019. The pronounced widening of the applied general gap is likely to have been influenced by differences in the cohorts entering these qualifications as they grew in popularity, as well as underlying changes in relative student attainment.
How do we measure the 16-19 disadvantage gap by qualification type?
Unlike our overall disadvantage gap measure which includes all students at the end of 16-19 study, our qualification type measures include only those that have entered the relevant qualifications.
We also choose to use an average point score measure. This is because students may have mixed study programmes and we do not want a student with three A levels, for example, to appear to have higher attainment than someone with two A levels and an applied general qualification, if similar grades were achieved.