16-19 methodology
The analysis in this report was carried out in the Secure Research Service, part of the Office for National Statistics
This work contains statistical data from ONS which is Crown Copyright. The use of the ONS statistical data in this work does not imply the endorsement of the ONS in relation to the interpretation or analysis of the statistical data. This work uses research datasets which may not exactly reproduce National Statistics aggregates.
Data sources
Throughout our analysis we use the key stage 5 National Pupil Database (NPD) student and exam files. These datasets cover all students and qualifications entered in the 16-19 phase.
We include students in all state funded 16-19 provision, except those who were flagged as being on an apprenticeship in any year of their 16-19 study, according to the Young People’s Matched Administrative Database (YPMAD).
Changes in data coverage
The Department for Education made changes to their inclusion criteria in 2021. Previously, students were considered to be at the end of 16-19 study if they met one of the following three rules:
- They were recorded on roll at the same 16-19 institution for two years.
- They had entered at least two qualifications equivalent in size to an A level.
- They were aged 18 at the beginning of the academic year.
In normal years, there is also a ‘checking exercise’. This is a process whereby institutions have the opportunity to check the data that the Department for Education intends to publish and remove any students that have not yet finished their study, even if they met one of the first two rules above. These students would then not be included until either: the institution confirmed that they had finished their study through a subsequent years’ checking exercise, or they turned 18.
In 2020/21 there was no checking exercise, so the first of the above rules was dropped in order to avoid reporting a disproportionate number of students early, a year before they had actually finished their study. This was an overadjustment such that the number of students reported in 2020/21 was far fewer than a usual year, with applied and technical students disproportionately more likely to have been excluded from the dataset. In our report last year, we restricted the datasets in earlier years to have the same coverage to improve consistency. We also made additional proxy adjustments to account for the differences arising from the cancellation of the checking exercise.
In 2021/22 there was a checking exercise again. Many of the students who were omitted from the 2020/21 dataset would have been included in 2021/22, the academic year in which they turned 19.
This means the number of students included in the 2021/22 dataset is back in line with 2018/19 and prior (accounting for changes in the population size or differences in the proportion not in education or training).
The composition is slightly different in 2021/22 in that there are now more 18-year-olds and fewer 17-year-olds (as recorded at the beginning of the academic year) relative to 2018/19. For those that had entered qualifications and completed their study programmes, the majority of potential differences should have been corrected during the checking exercise, as institutions will confirm whether or not a student had finished their study, regardless of the three coverage rules. However, it means that for those who did not complete their qualifications or finish their study with an institution, they are now more likely to be reported as an 18-year-old a year later, than as a 17-year-old. For most, this will not change the total point score they would have been given in our analysis, just the age at which they were included. As this change has now had several years to bed in, it is more valid to make comparisons to 2018/19 and prior. However, data from 2019/20 and 2020/21 when there were no checking exercises and the rule changed was made, are no longer directly comparable.
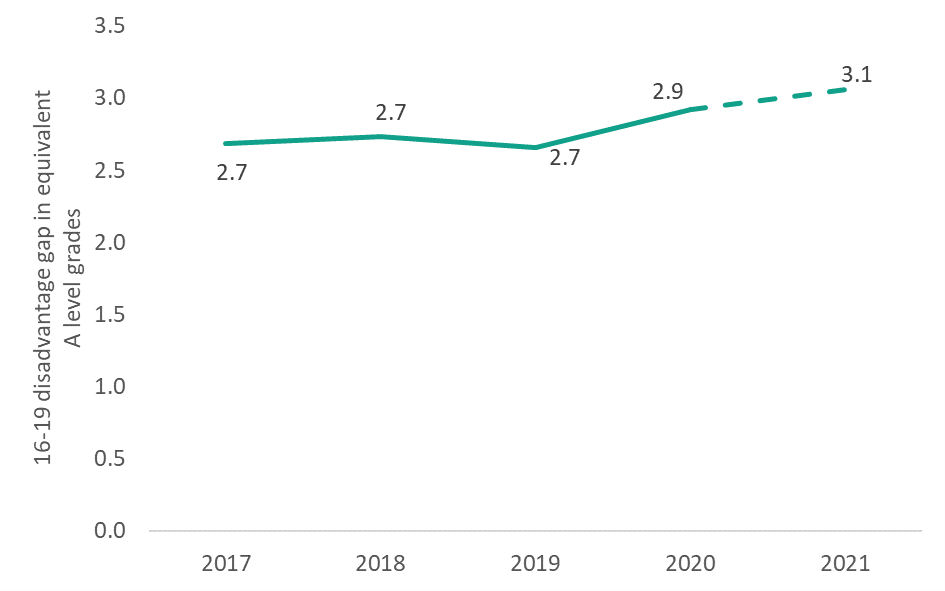
When we present a time series analysis that includes this period, we therefore dash the line between 2019 and 2022 to show that 2020 and 2021 are not directly comparable.
Impact
As discussed above, the changes made to the 16-19 datasets by the Department for Education mean we are not able to say precisely how the disadvantage gap has changed since 2021. In our report last year, we adjusted earlier years datasets to make them more comparable to 2021. However, this meant we were reporting on a subset of students so did not quite capture the full width of the gap, and it is not comparable to 2022 data.
Figure M1 below shows our chart from last year for reference, under the alternative methodology.
We estimated that the gap widened considerably during 2020 and 2021. In combination with figure D1, we can see that much of the gap that arose in this period persisted into 2022, when exams returned. However, what we cannot say with any certainty is whether the widening during the pandemic continued in 2022, or has now plateaued or started to reduce since 2021. Our qualification type findings in this report, however, do allow us to make this comparison for A level students.
Figure M1: Previous methodology, 16-19 disadvantage gap over students’ best three qualifications, 2017-2021
Methodology changes since last year
Details of how we map all level 1-3 qualifications onto the same scale and create our total point score measures are set out in Annex C of our initial ‘measuring the 16-19 disadvantage gap’ report.
Although the overall approach remains unchanged, we have made a slight revision to our mapping of level 1 and 2 qualifications onto a level 3 style point scale.
Our initial approach resulted in some level 1 or 2 qualifications having a negative point score if a low grade was achieved or they were very small in size. To account for this we shifted all qualifications up by 4.31, which preserved the relative differences between qualifications, but ensured that all qualifications with a pass grade received a positive point score.
However, this meant that all qualifications received a shift upwards of 4.31 regardless of their size. For example, a student with two A levels would have their total point score shifted up by this amount twice, whereas a student with a single qualification equivalent in size to two A levels would only have their score shifted up by this amount once.
We have now revised this approach such that we shift all qualifications up by 10 points, rescaled based on the size of the qualification. For example, an A level would be shifted up by 10 points, an AS level by 5 points, and a BTEC equivalent in size to two A levels by 20 points. A GCSE, which has size equivalent to a quarter of an A level, would be shifted up by 2.5 points.
As this adjustment was made proportionate to qualification size, it meant that for some very small qualifications, small but negative point scores still arose. We therefore imposed a lower bound such that any qualification receiving a pass grade would score a minimum of 0.5 points.
Impact
As discussed above, our original adjustment was sub-optimal. In this report we have revised the full back series to use this new methodology. However, we can see from comparing our results from our initial report to our updated results here, that the impact was minimal. Furthermore, as it was applied consistently across years it did not affect the trends through time.