Foreword
Each year, the Education Policy Institute reports on the gap between disadvantaged pupils and their peers. We use data from assessments in the early years, at the end of primary, at the end of secondary and at the end of the 16-19 phase. These reports have become the “go-to” source of information for policy makers, sector leaders and anyone interested in education and equity.
Although exams and grading were severely disrupted between 2020 and 2021 due to the Covid-19 pandemic, we still published our best assessment of the trends in the disadvantage gap (with the necessary caveats) during this period.
In 2023, examinations and grade distributions largely returned to pre-pandemic arrangements, so this report provides the first, comprehensive, post-pandemic assessment of the disadvantage gap. We are very grateful to the Sequoia Foundation and Unbound Philanthropy for continuing to support this essential work.
It’s important to consider two pieces of context when reading this report.
First, although the examinations and grade distributions largely returned to “normal” in 2023, the impact of the pandemic is not yet over. As our separate research finds (using Renaissance Star Assessment data), results for disadvantaged pupils in maths and reading remain below pre-pandemic norms in both primary and secondary phases.[1]
Second, the disadvantage gap was already widening before the pandemic. While we had seen several years of progress in closing the gap up to 2017, we then started to see stagnation and subsequent widening of the gap in the early years and secondary phases, followed by a similar trend in the primary phase by 2019. So we cannot blame the pandemic alone for increases in inequalities; this trend was already beginning to emerge.
Another crucial piece of context is that these results are presented amidst a backdrop of rising child poverty. Around 4.3 million children in the UK were in relative poverty in 2022/23.[2] Recent research also shows that it is not only children and families that are affected by poverty; so too are the public services that are designed to help them.
This report, taken with our wider research on inequalities in the education system, should be taken seriously by policymakers. We know that it is possible to close these gaps, we have made progress in the past, but doing so requires the new government to adopt evidence-based policies and interventions with urgency.
Natalie Perera, Chief Executive, Education Policy Institute
Executive Summary
Context
Following widespread pandemic disruption during 2020 and 2021, 2022 saw the return of summer exams. During the pandemic years, pupils’ grades in key stage 4 and 16-19 study were awarded using alternative processes known as centre assessed grades (CAGs) and teacher assessed grades (TAGs), whilst statutory assessments were cancelled altogether at earlier key stages. While formal exams returned in 2022, exams were adapted to acknowledge that pupils had missed a considerable amount of content and the distribution of grades was set broadly at a mid-point between (the higher grades of) 2021 and 2019. As such 2023 was the first year in which exam outcomes (and the differences between pupils from different backgrounds) could be directly compared with pre-pandemic levels. In addition to covering the period immediately following the pandemic, this analysis is also likely influenced by rising child poverty rates and the cost of living crisis. As such for this report we focus on changes between 2019 and 2023.
We present the disadvantage gap in months, except for the 16-19 phase, which is shown in grades, as the underpinning assumptions for our month methodology do not extend to the 16-19 stage.
Disadvantage
In 2019, the year before the pandemic, progress in closing the gap between disadvantaged pupils and their peers had already started to stall. We had seen signs of the gap starting to widen in the early years and secondary phases, but 2019 also saw worrying signs emerge in the primary phase.
The pandemic accelerated this trend and, between 2019 and 2023, we have seen the disadvantage gap widen in early years, primary schools and secondary schools. In the 16-19 phase the disadvantage gap appears to have returned to pre-pandemic levels.
The tables below show how the gap has widened across all compulsory educational phases since 2019.
Change in the disdvantage gap since before the pandemic
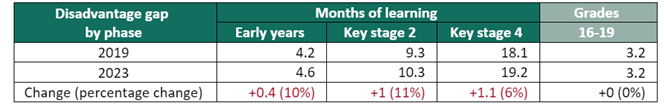
- At age 5, disadvantaged pupils were 4.6 months behind their peers in 2023, a wider gap than in 2019 (4.2 months) and in the five years leading up to the pandemic, though the gap reduced from 4.8 months in 2022.
- By the end of primary school (key stage 2), the disadvantage gap had grown to 10.3 months – one month wider than in 2019 and higher than its 2012 level. This has reversed a sustained period of gap narrowing between 2011 and 2018.
- By the end of secondary school (key stage 4), disadvantaged pupils were 19.2 months behind their peers. This gap has widened since 2019 (by 1.1 months), reaching its highest level since 2012.
- Disadvantaged 16-19 year olds were 3.2 grades behind their peers across their best three subjects in 2023. This is similar to the level in 2019, but down from 2022, when the gap was 3.5 grades.
- Persistently disadvantaged pupils were almost two years (22.9 months) behind their non-disadvantaged peers by the end of secondary school and almost one year (11.6 months) behind by the end of primary school.
- Since 2019, interpreting the persistent disadvantage gap has become more difficult year-on-year due to Universal Credit affecting FSM eligibility. However, even when we account for this in our analysis, we still see a widening gap for aged 16 pupils in long-term poverty (by almost a month since 2019).
- The 16-19 gap for persistently disadvantaged students was 3.9 grades in 2023, down from 4.1 grades in 2019.
English as an additional language
Attainment varies considerably by first language and time of entry into the English school system. Pupils arriving late to the English state school system with English as an additional language (EAL) incur a substantial attainment penalty. There have been changes in the composition of ethnicities within this group since 2019, with increases in the proportion of Chinese pupils (who are higher attaining on average) and decreases in the proportion of White students who are neither British nor Irish (a group that are lower attaining on average). This change in composition has contributed to an improvement in the gap trends observed here. However, even after accounting for these changes, there have been falls in the EAL gap across all phases.
The 2023 data finds that:
- Children with EAL in reception year were 1.8 months behind their peers, representing no change since 2019 but a long-term reduction of over one month since 2013.
- By the end of primary school, pupils with EAL who arrived late to the state school system were almost 10 months behind their peers. This is almost a 6 month reduction in the 2019 gap (15.5 months) and marks a faster rate of progress in gap-narrowing than over the pre-pandemic period 2011-2019. After accounting for changes in the ethnic makeup of this group, this reduction in the gap falls from 5.7 months to just 2.3 months.
- By the end of secondary school, late-arriving pupils with EAL were 11.8 months behind their peers. This is a marked reduction in the 2019 gap of almost 9 months. It reverses the trend of widening inequalities at GCSE for late-arriving EAL pupils in the years leading up to the pandemic. After accounting for changes in the ethnic makeup of this group, this reduction in the gap falls from 8.8 months to just 4.8 months.
Special educational needs and disabilities
Change in SEND gaps since before the pandemic
Children with special educational needs and disabilities (SEND) are significantly educationally disadvantaged and have some of the largest attainment gaps. In our analysis we distinguish between pupils who receive support in school (SEN support) and those with more complex needs set out in an education, health and care plan (EHCP). Over the past decade or so, there has been better progress in gap-narrowing for older pupils than for those starting school, as well as for those receiving SEN support. Over a similar period, there have also been changes in the types of need identified in pupils with SEND, with a smaller proportion identified as having learning difficulties and larger proportions with identified Autistic Spectrum Disorder, Speech, Language and Communications needs, or Social, Emotional and Mental Health needs. We don’t yet know the extent to which this change in the composition of the SEND group has contributed to recent trends in the gaps.
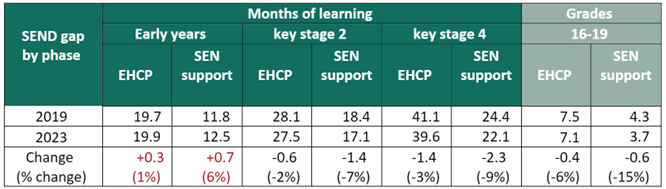
The 2023 data finds:
- Among reception-aged pupils, those with an EHCP were 19.9 months behind their peers, only a small increase since 2019. Pupils receiving SEN support were 12.5 months behind, an increase of 0.7 months since 2019. In both cases, and unlike for later phases, these early years gaps also increased to their widest since our series began in 2013.
- Among pupils at the end of key stage 2: those with an EHCP were 27.5 months behind their peers, while those receiving SEN support were 17.1 months behind. After slower progress in the 4-5 years leading up to the pandemic these gaps now appear to be closing again.
- Among pupils at the end of key stage 4: those with an EHCP were over three years (39.6 months) behind their peers, while those receiving SEN support were almost two years (22.1 months) behind. Both gaps have narrowed both before and since the pandemic – indeed the gap among pupils aged 16 receiving SEN support was over 6 months smaller than in 2011.
- Among students in the 16-19 phase: Those with an EHCP were 7.1 grades behind their peers, while those receiving SEN support were 3.7 grades behind. These gaps have reduced since 2019, with a fall of around half a grade for both those with EHCPs and those receiving SEN support.
Ethnicity
Attainment varies significantly between ethnic groups and many ethnic groups improve their position relative to White British pupils – the largest ethnic group – as they progress through school. In later phases, the attainment of White British pupils has declined relative to most other ethnic groups in the wake of the pandemic, whilst the opposite is true in reception year (other ethnic groups have declined relative to White British). On average, attainment across ethnicities has converged slightly since 2019.
- At age 5, only four ethnic groups were ahead of White British pupils in 2023, namely Chinese, White and Asian, White Irish and Indian pupils. Most lower-attaining ethnic groups saw their gaps widen in 2023 compared with 2019, with Black Caribbean and pupils of Any Other Black Background seeing the largest increases, of around 0.8 months.
- By the end of primary school, ten ethnic groups had higher attainment than White British pupils. Chinese pupils were 10.9 months ahead of White British pupils whilst Gypsy Roma pupils were 18.2 months behind. Between 2019 and 2023, ten ethnic groups saw improvements relative to White British students whilst seven groups experienced a relative decline.
- By the end of secondary school, the majority of ethnic groups were ahead of White British pupils. Chinese pupils were over two years (27 months) ahead of white British pupils, whilst Gypsy Roma pupils were two and a half years (30 months) behind. Between 2019 and 2023, all ethnicities, other than White and Black Caribbean and White Irish pupils, improved their attainment relative to White British pupils.
- In the 16-19 phase, only five ethnic groups were behind White British pupils in 2023, namely Gypsy Roma, Traveller of Irish Heritage, Black Caribbean, White and Black Caribbean and Any other Black Background. Between 2019 and 2023, all ethnicities, other than Black Caribbean pupils, improved their attainment relative to White British pupils.
- Across all phases, White Irish pupils had the largest gap between the attainment of their disadvantaged and non-disadvantaged pupils, at 9 months at age 5, 18 months at age 11, and 30 months at age 16. In the 16-19 phase, the gap was equivalent to 6 grades.
- In all but the 16-19 phase, Chinese pupils had the smallest gap between the attainment of their disadvantaged and non-disadvantaged pupils, at just 1 month at ages 5 and 11, and 6 months at age 16. Notably at ages 11 and 16, disadvantaged Chinese pupils had higher attainment than non-disadvantaged pupils of all other ethnicities. In the 16-19 phase, Bangladeshi students had the smallest gap, at just over one grade.
Gender
Girls outperform boys across all education phases but unlike other characteristic breakdowns, the gender gap is unique in narrowing during the primary school phase – before widening again during secondary school. The gender gaps we find are not unique to the English education system and point to common challenges in supporting boys’ literacy outcomes. However, although we find gender gaps are closing in more recent years, this appears to be partly driven by declines in girls’ attainment as well as increases for boys. The 2023 data finds that:
- Among reception-aged pupils: girls were already 3.2 months ahead of boys, an increase from 2.9 months in 2019 (although this gap is still nearly one month narrower than in 2013).
- By the end of key stage 2: girls were only 0.6 months ahead of boys, a significant decrease from 2.4 months in 2019. This appears to be driven by both an improvement in boys’ reading and a decline in girls’ maths.
- By the end of key stage 4: girls were 4.5 months ahead of boys, averaged across GCSE English and maths – a narrowing from 6.3 months in 2019 and marking the smallest gender gap since the start of the series in 2011. This appears to be driven by improvements in English and maths for boys alongside a decline in English for girls.
- In the 16-19 phase: female students were 1.5 grades ahead of male students over their best three qualifications, a fall from 1.6 grades in 2019, and the smallest gap since our series started in 2017. This appears to be driven by larger improvements in attainment for male students than for female students.
Geography
Change in regional gaps since before the pandemic
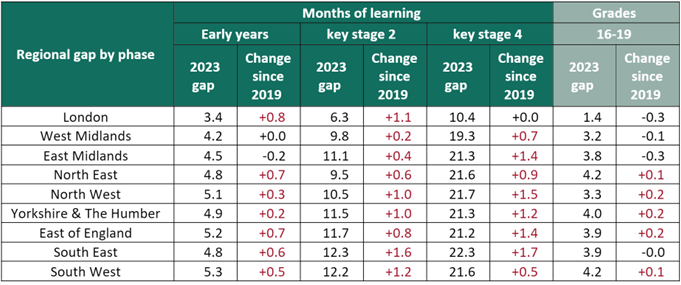
This report includes new interactive geographic tools for understanding how disadvantage gaps vary across England. For all phases and levels of geography, we compare the attainment of disadvantaged pupils locally to the attainment of non-disadvantaged pupils nationally. The 2023 data finds that:
- Disadvantaged pupils in London have higher attainment than disadvantaged students in other English regions, in all phases. The disadvantage gap in London was 3.4 months at age 5, 6.3 months at age 11 and 10.4 months at age 16, and 1.4 grades in 16-19 education. The West Midlands stands out for having the second smallest gap in three out of the four phases.
- The regions with the largest disadvantage gap at each phase were the South West at age 5 (5.3 months), the South East at age 11 and 16 (12.3 months and 22.3 months), and the North East in the 16-19 phase (4.2 grades).
- The gap has widened post-pandemic in almost all regions in the early years to key stage 4 phases. Between 2019 and 2023 gaps in the West Midlands grew less than in most other regions across all four phases. London experienced some of the biggest increases in the gap in the early years and key stage 2, while the South East and the North West saw some of the biggest increases in key stage 4.
- At a local authority level, Hackney had the smallest gap at age 5 (1.1 months), Newham at age 11 (1 month), Kensington and Chelsea at age 16 (3.4 months), and Thurrock in the 16-19 phase (-1.8 grades). Hackney and Newham are notable for having some of the smallest gaps nationally across all four phases of education.
- Four of the ten local authorities with the largest gaps at the end of secondary school were in the North West: Blackpool (27.9 months), Knowsley (27.2 months), Sefton (25.9 months) and St. Helens (25.5 months).
- Kensington and Chelsea is unique in being the only local authority where the gap is smaller for those aged 16 than for those aged 5, and the gap is only one month larger for 16 year olds in Redbridge and Tower Hamlets. The three local authorities where the gap increases the most between age 5 and age 16 are Blackpool, Knowsley, and Portsmouth.
- The gap among pupils aged 5 decreased in over one in four local authorities compared to the pre-pandemic level. Halton (-2 months), Nottinghamshire (-1.4 months), and Stoke-on-Trent (-1.3 months) had the biggest decreases in the disadvantage gap.
- At primary school, more than one in five local authorities saw their gap decrease compared to 2019. Hackney (-2.4 months) and Bedford (-2.3 months) saw the largest decreases. Conversely, the London boroughs of Richmond upon Thames and Harrow saw the largest increases (+6 months and +5 months respectively).
- Most London boroughs saw their GCSE disadvantage gap narrow compared to 2019, with Westminster (+4.7 months) being a notable exception.
Conclusions and policy recommendations
In 2023 exams returned to their pre-pandemic standards. Yet, it is now clear that educational inequalities look very different from how they did in 2019. Most notably, the disadvantage gaps for 11 and 16 year olds are at their widest levels in over a decade, and remain much higher than pre-pandemic levels for children aged 5. That children from low-income families appear to have fared so badly is no doubt related to rising levels of child poverty, and the differential impact of the pandemic.
Alongside the growth in the disadvantage gap for 5 year olds, we are also seeing concerning trends for 5 years olds with SEND, who are now further behind other children than at any point in our series.
Ostensibly there appear to be some bright spots; gender gaps and those for older pupils with SEND and late arriving EAL pupils are falling, there is some convergence in attainment across ethnicities, and the 16-19 disadvantage gap appears to have returned to pre-pandemic levels.
However, it isn’t yet clear whether these changes represent an actual improvement in educational outcomes for vulnerable pupils. The falling attainment of girls appears to be driving the reduction in the gender gap, there have been notable changes in the types of need identified in children with SEND, much of the fall in the late-arriving EAL gap is driven by changes in ethnicity, and although the 16-19 disadvantage gap is smaller, so too is participation in this phase.
There is a need for a greater understanding of the drivers of the trends identified within this report, not least how the significant increases in pupil absences have contributed, and we will look deeper at many of these issues in a follow-up to this report, due to be published later this year.
However, further research is not required for us to be confident that, even after any potential improvements for some groups, the gaps in this report remain stark, and they demand ongoing attention from policy makers.
Several of our recommendations emerging from this research are not new. This is partly a reflection of the lack of progress in closing gaps in recent years, but this is also an opportunity for the new government to address these longstanding inequalities. Our proposed priorities for the new government include:
- A renewed strategy for closing gaps – the new government should publish a strategy setting out how it will address attainment gaps for vulnerable groups. This strategy should clarify the government’s level of ambition regarding educational inequalities, should assess the effectiveness of existing policies aimed at reducing disadvantage (including the role of local and place-based strategies), and should set out a pathway to implementation based on the best available evidence.
- Targeted funding for disadvantaged pupils and students – as part of this review, the government should assess the adequacy of disadvantage funding across all phases. In particular, there should be higher levels of funding for the disadvantaged, weighted more heavily towards persistently disadvantaged pupils, and there should be a student premium in the 16-19 phase, akin to the pupil premium at key stage 4. EPI will set out further details on these proposals in upcoming reports over the coming weeks and months.
- A cross-government child poverty strategy – there remains a pressing need for a child poverty strategy which recognises that the social determinants of educational inequalities – such as poverty, housing, healthcare, transport, and many other aspects of daily life – cannot be addressed by schools in isolation or even any one government department.
- Support for children with SEND – there remains a need to provide more effective support for children with SEND, especially for younger children. We have previously recommended improved early identification, better teacher training, reviewing the high needs budget, ensuring access to other professionals such as educational psychologists, as well as improving access to Children and Young People’s Mental Health Services and NHS assessments. There is also a need for a greater understanding of changes in the types of need identified in recent years, and how support for young people should adapt accordingly.
- More research on gender gaps – there is a growing need for a greater understanding of the declining attainment of girls. In particular, whether this is related to the recent large increases in poor mental health for teenage girls.
[1] Jon Andrews, ‘Star Assessments Benchmarking Report 2022/23’, (EPI, March 2024)
[2] Households Below Average Income: an analysis of the UK income distribution: FYE 1995 to FYE 2023 – GOV.UK (www.gov.uk) UNICEF-Innocenti-Report-Card-18-Child-Poverty-Amidst-Wealth-2023.pdf
disadvantage geographic disadvantage gaps