Director for School System and Performance and Deputy Head of Research Jon Andrews assesses the Government’s new secondary school accountability system.
Background
The first school performance tables were published in 1992. When I took my GCSEs four years later just a quarter of pupils in my school achieved five or more GCSEs at grade A*-C. Over the next two decades the school would see that rate more than double, become an academy and change its name. As the state-school system underwent numerous reforms, an increasing number of measures and qualifications would be added, removed and replaced in the Performance Tables. But for all the changes seen in individual schools and across the system, the focus would remain on the number of pupils getting five good GCSEs.
So the move this year to Progress 8 represents a big shift in how we think of school performance.
Progress 8 is designed to measure how well pupils progress between the end of primary and the end of secondary school. The score for each pupil is based on whether their actual GCSE scores are higher or lower than those achieved by pupils who had similar attainment at the end of primary school. So rather than assess a school’s performance simply by the proportion passing a particular threshold, which is strongly correlated with intake, Progress 8 is a step towards measuring the underlying effectiveness of a school.
There have been measures that take account of prior attainment before. Indeed, the first Key Stage 3-4 value added measures were published nearly fifteen years ago. But this is the first time that such measures have made it to the sharp end of the accountability system as part of the minimum floor standards.
Variation in school performance
In January, the Department for Education published the first set of secondary school performance tables that included Progress 8 scores for all schools (some schools had opted in early and had results published for 2015.) At the same time, they also released data examining how Progress 8 varies by different types of school and different pupil characteristics.
The first thing we consider is the overall variation in Progress 8 scores at school level.
Progress 8 scores are centred around zero and nearly all mainstream schools have a score in the range +/-1.0. In P8 terms, a score of +1.0 means that pupils achieve one grade higher in each subject than pupils with similar prior attainment nationally. In fact, around half of all mainstream schools have a score that is within the range +/- 0.25 (a score of +0.25 meaning that pupils achieved a quarter of a grade higher in each subject than pupils with similar prior attainment nationally.)
Figure 1: Distribution of Progress 8 scores for all schools in 2016 (vertical lines show points in the distribution for mainstream schools.)
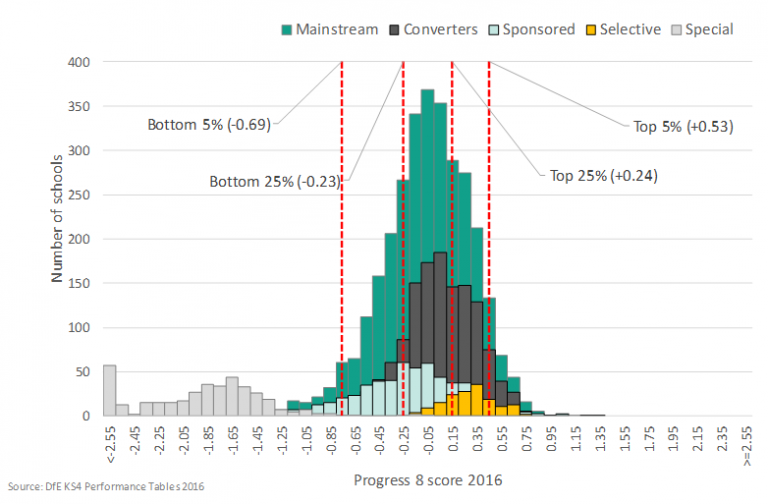
But there is variation between schools and between different types of schools. Pupils in converter academies tend to make more progress than pupils with similar prior attainment elsewhere (+0.09 – a tenth of a grade) whereas those in sponsored academies make less progress (-0.14 one seventh of a grade).
Does this show that the converter academy programme is good and sponsored academy programme bad? Almost certainly not. These measures only ever tell us about how pupils in these schools are currently performing, not the impact that academisation has had on results. Schools that became converter academies were generally already high performing before they converted, with the opposite true for sponsored academies. If we want to consider the impact of academisation we need to consider how that performance has changed over time.[i]
Grammar schools have been back in the news this week and they are another group that appears to do well on Progress 8 with a score of +0.33. Some proponents of grammar schools may will seize upon this as part of the case for increasing selection. But, we know from our own research, that the performance of pupils who attend grammar schools is only part of the story, there is also an attainment penalty for those who miss out.[ii]
The DfE provide this balance within their statistical release by publishing scores for pupils who attend non-selective schools in highly selective local authorities. They find that these pupils score on average -0.09 on Progress 8. So, based on this, pupils who attend grammar schools achieve a third of a grade higher in each subject, but, those who miss out experience a penalty of a tenth of a grade. We found effects of a similar magnitude in our own research.
The final group of schools we consider here are special schools. The attainment of pupils in special schools is compared with pupils with similar prior attainment in mainstream schools. By definition, there are a range of factors that are simply not being considered when doing this and it is perhaps not surprising to find that special schools have Progress 8 scores that are well below average. Indeed, even the ‘highest performing’ special schools on this measure barely match the bottom end of the distribution for mainstream schools. There’s a clear question as to whether we are judging the performance of special schools in the right way.
Variation by pupil characteristics
The variation that we see in pupil performance when considering pupil characteristics will be a familiar story to those that have looked at earlier measures of attainment. Girls outperform boys (by just over a quarter of a grade) and Chinese pupils are by far the highest performing ethnic group – achieving the equivalent of two thirds of a grade higher in each subject than pupils with similar prior attainment.
Figure 2: Progress 8 scores by pupil characteristics
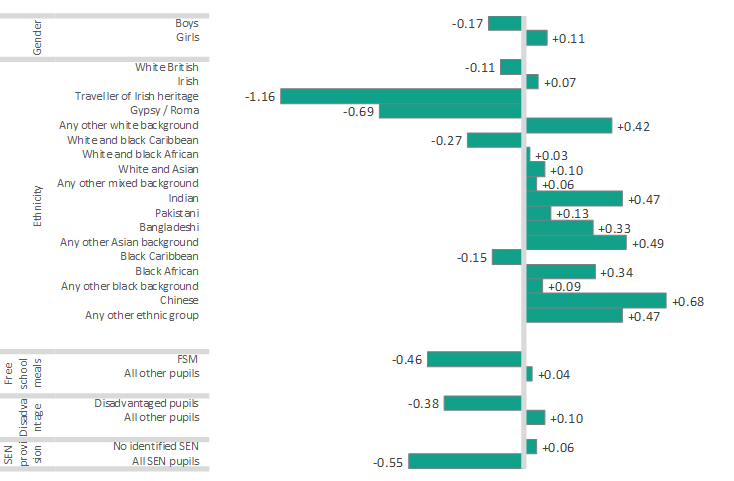
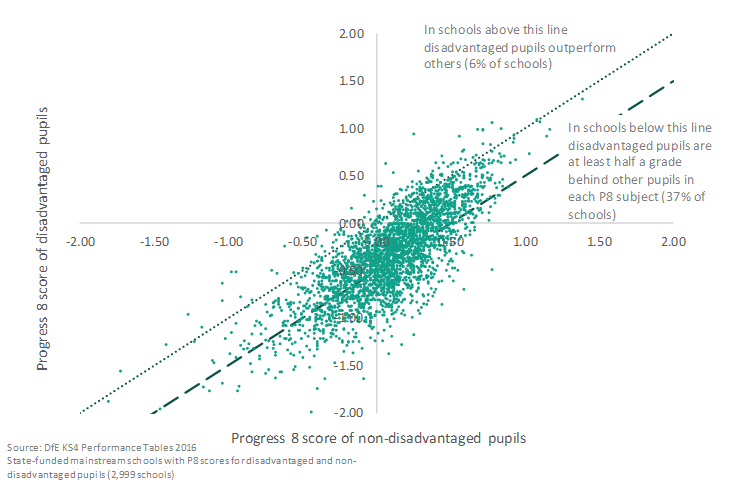
Pupils from low income backgrounds remain well behind their more affluent peers, even after controlling for the large attainment gap that we see at the end of primary schools. Pupils from disadvantaged backgrounds achieve around half a grade lower in each subject than pupils with similar prior attainment. This gap remains evident at school level. Schools that do well for non-disadvantaged pupils also see higher results for their disadvantaged pupils but, in most schools, disadvantaged pupils still lag behind. Disadvantaged pupils achieved higher Progress 8 scores than their peers in just 6 per cent of schools. Conversely, disadvantaged pupils are over half a grade behind their peers in over a third of schools.
Figure 3: Progress 8 scores for disadvantaged and non-disadvantaged pupils at school level
Floor standards
The use of Progress 8 in the floor standard represents the most significant result of its introduction. For the first time, schools are having to meet minimum expectations in the progress that their pupils make rather than their overall results.
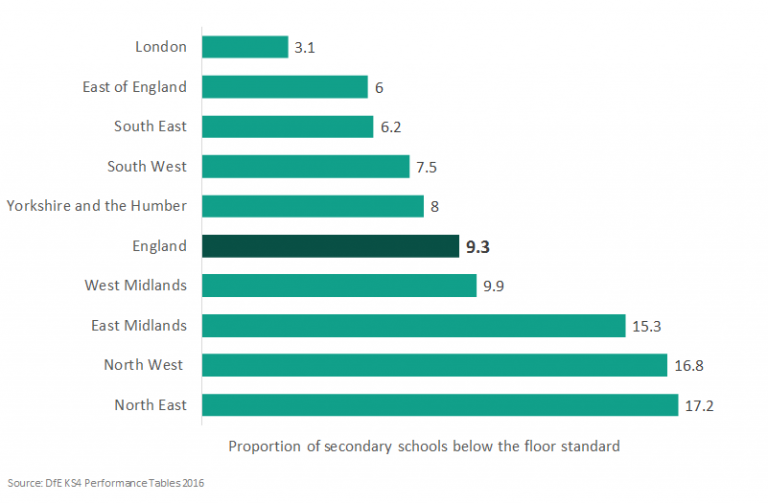
Schools are below the floor standard if they have a Progress 8 score of below -0.5 and significantly below zero. In 2016, 282 schools (9.3 per cent) were below the floor standard (a further 19 would have also been below the floor but are not included in official totals as they closed during the academic year.) There is significant variation across the country, with just 3 per cent of schools in London below the floor against nearly a fifth (17. 2 per cent) of schools in the North East.
Figure 4: Proportion of schools below the floor standard
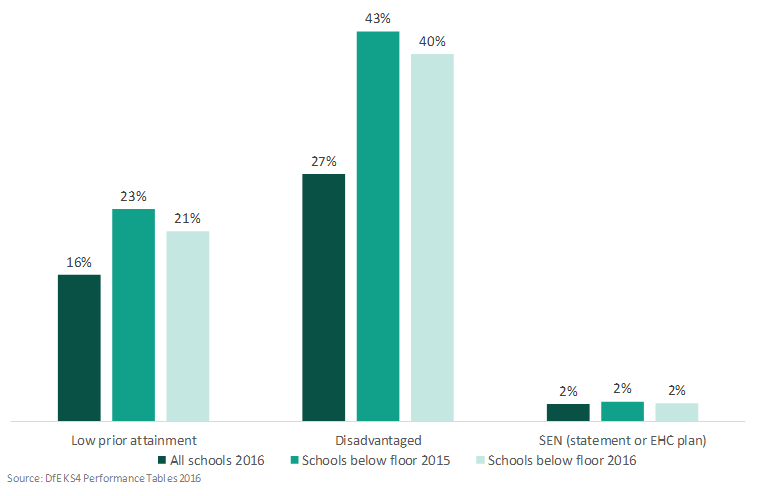
Given what we have said about the move away from attainment measures to progress being a significant step, the next question is are a different set of schools now being categorised as below the floor? As the previous measures were based on overall attainment (with an element of expected progress which is highly correlated with attainment) it tended to capture schools with characteristics associated with lower attainment (such as low prior attainment and disadvantage).
The introduction of Progress 8 has improved this but only slightly. Schools below the floor in 2016 still had far higher levels of disadvantaged pupils than average and tended to have a greater proportion of pupils with low prior attainment. Given what we see in the analysis by pupil characteristics (e.g. disadvantaged pupils achieving lower Progress 8 scores on average) this is perhaps not surprising.
Figure 5: Characteristics of schools that are below the Key Stage 4 floor standard
Conclusion
Progress 8 is a positive step forward in judging the performance of schools more fairly given that it controls for prior attainment. It also ensures that schools are accountable for all of their pupils and not just those at the old C/D borderline.
Now that the Department for Education has taken this step it should continue to consider how it develops Progress 8 further so that it helps drive genuine improvement in the system. There are ways in which Progress 8 will still be seen as unfair to some schools because it takes no account of other pupil characteristics, such as disadvantage, which are also strongly correlated with outcomes, so there is an argument for contextualising the measure further. Some may argue that this builds in low expectations, but we can have high aspirations for individuals whilst still assessing school effectiveness in a fair way.
It is also possible for individual pupils to have a disproportionate impact on the Progress 8 score. A pupil who significantly underperforms, for reasons beyond their and the school’s control, can cause a considerable drop in results. We need to consider how we allow for these cases whilst not introducing perverse incentives or allowing schools to ‘give-up’ on some pupils.
Success on this measure can reflect curriculum choices as much as outcomes since doing poorly in a subject that counts in the measure is worth more than doing brilliantly in one that does not (clearly Performance Tables are one of the major levers that Government has to change behaviours and steer people down a particular path, so for ministers this is not necessarily a ‘weakness’). As with EBacc we need to consider whether taking these qualifications has, in the long run, been better for the pupil than taking those that they may have performed better in.
And we need to give more serious consideration to how we assess the performance of special schools if they are to be part of the same accountability system.
But these challenges should be seen as an opportunity to improve Progress 8 as a measure rather than to dismiss it. As it stands, Progress 8 is a move towards a fairer accountability system.
[i] See for example “Reflections on ‘Academies: 15 years on’ conference” https://epi.org.uk/analysis/reflections-academies-15-years-conference/
[ii] Grammar Schools and Social Mobility, Education Policy Institute, September 2016 https://epi.org.uk/publications-and-research/grammar-schools-social-mobility/
Sources:
Secondary School Performance Tables 2015 and 2016, DfE, January 2017
Revised GCSE and equivalent results in England: 2015 to 2016, DfE, January 2017