Back in May, we reported on the very high absence statistics that the Department for Education published for the autumn term of 2022/23. We were concerned at the time that absences hadn’t shown signs of coming down in the aftermath of the pandemic, with all three headline measures hitting historic highs.[1] Today we provide further commentary on the more detailed data that has recently been published for the same term on the pupils worst affected by absences since 2019.
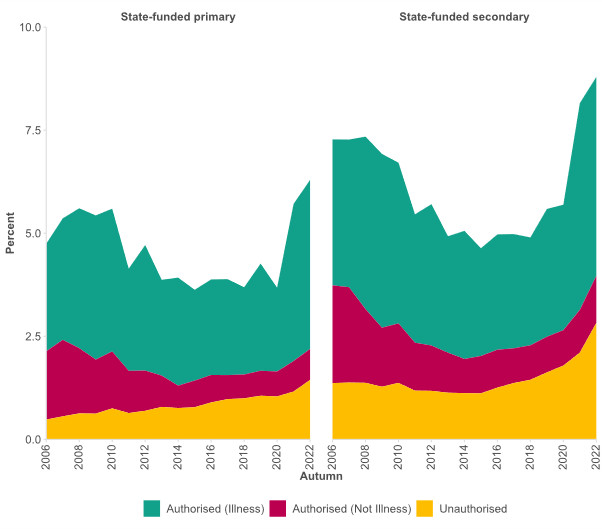
Figure 1: Overall absences reached their highest levels since 2006 in the autumn term of 2022 (particularly at secondary), driven by higher illness absence, alongside more unauthorised absences
We follow the same approach as in our previous blog and have created an ‘excess absence’ measure which compares the average number of days absent in autumn 2022 data (in pink) to autumn 2019 (green) to get a sense of how far we are from pre-pandemic norms for different groups of pupils.[2] We then split this gap measure into one of three reasons (in shades of grey) to help distinguish between illness as a driver of higher absence, as opposed to other authorised reasons or unauthorised absences.
Absence is far higher among vulnerable pupils
Two groups stand out as being worst affected since 2019: disadvantaged pupils [3] and children with special educational needs. As these groups also entered the pandemic with some of the highest levels of absence, it appears that absence is widening educational inequalities for these particular groups.
Figure 2: Absence gaps widened for disadvantaged pupils and those with special educational needs between the autumn terms of 2019 and 2022
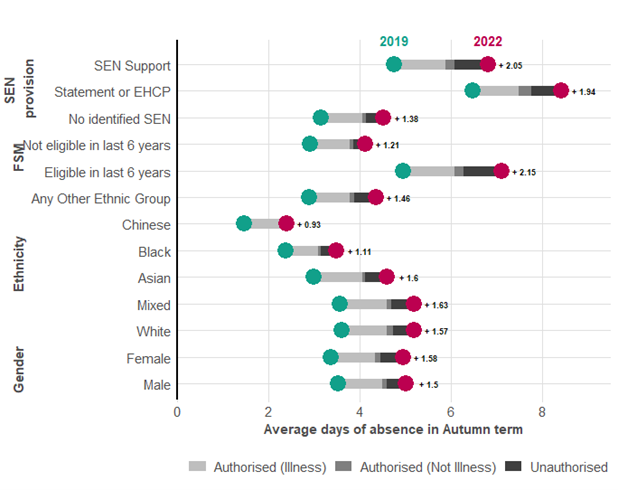
In autumn 2019, disadvantaged pupils experienced 5.0 days of absence (for any reason), equivalent to a full week over the course of the term, compared to 2.9 days for their non-disadvantaged peers – a gap of 2.1 days. By autumn 2022, absence had increased for disadvantaged and non-disadvantaged pupils alike, but this increase was more marked among disadvantaged pupils, who experienced an extra 2.1 days of absence (or 7.1 days in total over the autumn term) compared to an increase of 1.2 days among non-disadvantaged pupils (4.1 days in total).
This widening in the absence gap between disadvantaged pupils and their peers was mostly attributable to reasons other than illness – namely unauthorised absences (which rose more sharply for disadvantaged pupils in absolute terms). It is consistent with mounting evidence that it is the most disadvantaged children and communities whose educational experiences have been most impacted in the wake of the pandemic.
Pupils with special educational needs also entered the pandemic with higher levels of absence over the autumn term of 2019 (totalling 4.7 days for those with SEN Support and 6.5 days for those with more complex needs set out in an Education, Health and Care plan) relative to their peers with no identified SEN (3.1 days). These gaps subsequently widened further: by autumn 2022, overall levels of absence stood at 8.4 days for pupils with an EHCP (an increase of 1.9 days), 6.8 days for pupils with SEN Support (+2.1 days) and 4.5 days for pupils with no identified SEN (+1.4 days).
As for disadvantaged pupils, more unauthorised absences were a key factor, though higher authorised absences for reasons other than illness were also at play, which may reflect medical appointments during the school day. The Children’s Commissioner reports that some schools are struggling to make reasonable adjustments for pupils with SEND and provide suitable learning environments to meet their additional needs.
There is a clear link between mental health needs and higher pupil absence
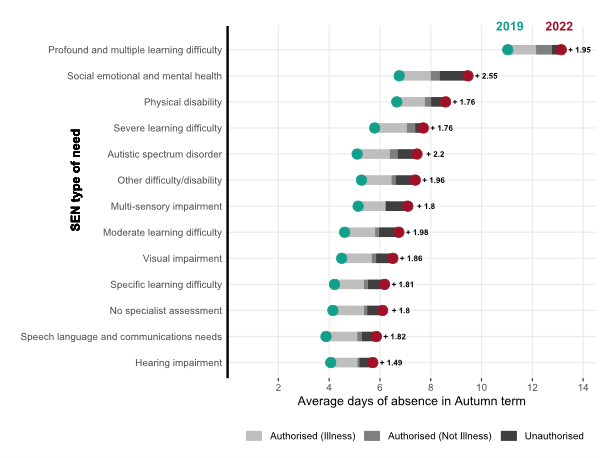
When we consider patterns by type of SEN[4], pupils with profound and multiple learning difficulties entered the pandemic with the highest levels of overall absence (at 11.1 days in the autumn term of 2019) and continued to have the highest absences by autumn 2022 (13.1 days). Meanwhile the group experiencing the biggest increase was pupils with social, emotional and mental health needs (with 2.5 days of additional absence, totalling 9.4 days over the autumn term of 2022), followed by autistic children (+2.2 days, totalling 7.4 days). Some autistic children reported that being at home during the pandemic felt like a ‘safe place’, whilst returning to school has posed challenges in adapting to new daily routines, returning to the school environment and rebuilding relationships. There is a more general sense that after a long period of school closures, some children have lost their academic and social confidence, exacerbated by the pressures to catch up on lost learning.
Figure 3: Between autumn 2019 and autumn 2022, absence increases have been most marked for children with social, emotional and mental health needs
Gypsy, Roma and Traveller pupils have some of the highest absences of all
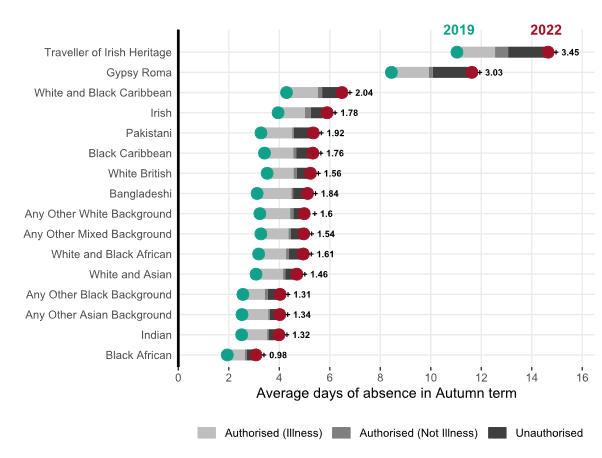
The role of absence in widening educational inequalities is also evident when looking at ethnic breakdowns (Figure 4). The groups least impacted by the pandemic – such as Black African, Indian and Other Asian pupils – also entered the pandemic with some of the lowest levels of absence. By contrast, Travellers of Irish Heritage and Gypsy Roma pupils had extremely high levels of absence prior to the pandemic (totalling 11.1 days and 8.5 days respectively in the autumn term of 2019) which increased further subsequently (to 14.6 and 11.5 days respectively), mostly due to more unauthorised absences, as well as higher illness absence (Figure 4).[5] These groups are more affected by poverty on average, but also face additional challenges around bullying and racism.
Figure 4: Travellers of Irish Heritage and Gypsy Roma pupils entered the pandemic with some of the highest absence levels which have increased further since autumn 2019
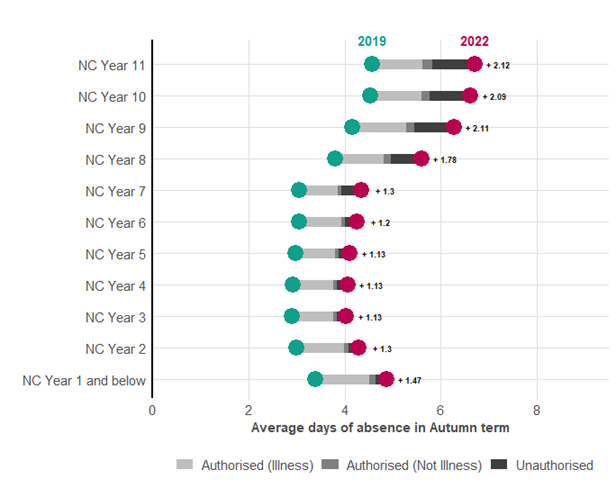
Children are more likely to be absent as they get older
Children are more likely to be absent as they get older, but it is striking that it is during year 8, rather than the transition point from primary to secondary (year 7), that absence (including unauthorised) becomes more of a problem. This may be related to teenagers gaining more agency and independence, whilst parents have diminishing influence relative to peer groups, and the pandemic has generally widened these differences between year groups.
Figure 5: Absence increases as pupils get older but there is a step-change in absence in year 8
Previous research has found that children’s previous absence history is key to understanding the likelihood of current absence. Variation in previous absence explains more about variation in current absence than any other observable characteristics. And alongside a pupil’s absence history, having been suspended or excluded are key additional risk factors. This highlights the power of pupil-level data to effectively identify those most at risk and potentially intervene early to tackle the root causes of behavioural issues before absence becomes entrenched.
Conclusion
It is well established that some pupils are much more likely to be absent. But recently published official data provides new insights on the subgroups who have fared the worst in the wake of the pandemic. These include disadvantaged pupils, children with special educational needs and mobile pupils – namely Gypsy, Roma and Traveller pupils. The drivers of these patterns are complex, though part of what is driving widening disparities in absence between groups since 2019 is related to reasons other than illness, indicating this is not a COVID-blip. These patterns appear to be widening underlying inequalities for vulnerable groups, whose education has suffered the most in the wake of the pandemic.
There are a few takeaways. Firstly, as some groups of pupils – including those with a history of previous absence, suspensions and exclusions – are much more likely to be absent, schools need to be supported to effectively utilise pupil-level data to identify those who might benefit from early intervention and provide targeted support. The nine new Attendance Hubs could hold some promise here, but their scale will limit potential benefits to the 600 participating schools. Having more inclusive school policies (around suspensions and exclusions) may also have a role in insulating children from absences.
Secondly the strength of the link between socioeconomic disadvantage and absence underlines the central role of alleviating child poverty in tackling absence. When families are increasingly unable to afford basics such as food, transport, suitable housing and toiletries, some of the barriers to attendance are predictable and avoidable. And during a cost of living crisis, the need for a cross-government approach on child poverty has never been more urgent.
Finally, worsening mental health and anxiety has been a recurrent theme in the Education Committee’s ongoing inquiry into persistent absence, at a time when over one in six young people reported a probable mental disorder in 2022, up from one in nine in 2017. Our analysis confirms that children with (diagnosed) social, emotional and mental health needs have been some of the most affected by higher absences following the pandemic, and, as a result, their absence levels were over twice as high as their peers by autumn 2022.
As a trusted, universal service, co-locating Mental Health Support Teams (MHSTs) in schools – the cornerstone of the government’s response to young people’s mental health issues – is a positive first step. But MHSTs only serve a minority of schools and colleges in England, with current coverage at 28 per cent and still only projected to reach 35 per cent of schools and colleges by April 2024. More investment is needed[6] so schools across the country can employ mental health professionals, whilst recognising that schools cannot be expected to fill the void left by wider services such as CAHMS, children’s social care, youth services and early help for families also struggling to keep up with demand.
References
1) These relate to overall absence, persistent absence (where pupils miss at least 10% of school sessions) and severe absence (where pupils miss more school sessions than they attend).
2) We base this gap on the (difference in the) average number of days absent rather than percentage absence rate to make it more intuitive. We use autumn 2019 as the latest data point prior to the start of the pandemic.
3) Based on being eligible for free school meals at some point in the previous six years.
4) This is based on SEN primary need type but often children do not present with one type of need exclusively and have a combination of needs. The data only capture children with a diagnosis and undiagnosed and unmet SEND is also a likely driver of absence.
5) The law recognises that Gypsy, Roma and Traveller families may have a valid reason to keep their children from school where parents are travelling for work purposes: Working together to improve school attendance – GOV.UK (www.gov.uk)
6) As part of EPI’s education recovery package, we estimated that it would cost £1.5 billion over three years for a mental health support workers in every secondary school, college and AP setting, and one for every two primary schools: Education-Recovery_EPI.pdf
You can read our earlier analysis of post-pandemic pupil absences here.