Further analysis of confirmed schools affected by RAAC
Yesterday, EPI published initial analysis of the 79 schools that the BBC had identified as having RAAC. Later that day, the Department for Education published a fuller list of 147 schools that have responded to the DfE survey and have since been confirmed as having RAAC. There may still be schools with RAAC that have not yet been identified, perhaps because they have not responded to the survey or RAAC hasn’t been formally identified.
Nevertheless, we have updated our analysis to cover the schools that we know, so far, have RAAC.1 We were interested in whether there were any patterns regionally, based on levels of disadvantage and based on the governance structure of schools.
Our first finding, as shown in Figure 1 below, is that secondary schools are far more likely to currently be affected by RAAC than primary schools (we stress “currently” because we do not know whether RAAC has already been addressed in large numbers of primary schools).
We also find that schools in Single or Multi Academy Trusts are more likely than local authority maintained schools to have RAAC. This could simply be because secondary schools are more likely to be academies (80 per cent of secondary schools are academies compared to 40 per cent of primary schools) and so it follows that there is a greater propensity for academy trusts to have RAAC-affected schools. Another note of caution here is that RAAC affected schools could have converted to academy status at any point in the last decade or so (i.e. we cannot conclude from this data that academy trusts are any less likely to “deal” with RAAC than local authorities).
What this finding does tell us, is that 69 percent of schools with RAAC actually fall under the ultimate oversight of the DfE, rather than local authorities.
Figure 1: Governance of RAAC affected schools

We then looked at whether schools serving larger proportions of disadvantaged pupils were more likely to have identified RAAC. As with our initial analysis, we do not find a relationship between the two. In fact, schools with smaller proportions of disadvantaged pupils were slightly more likely to be affected by RAAC.
Figure 2: Percentage of disadvantaged pupils in RAAC affected schools

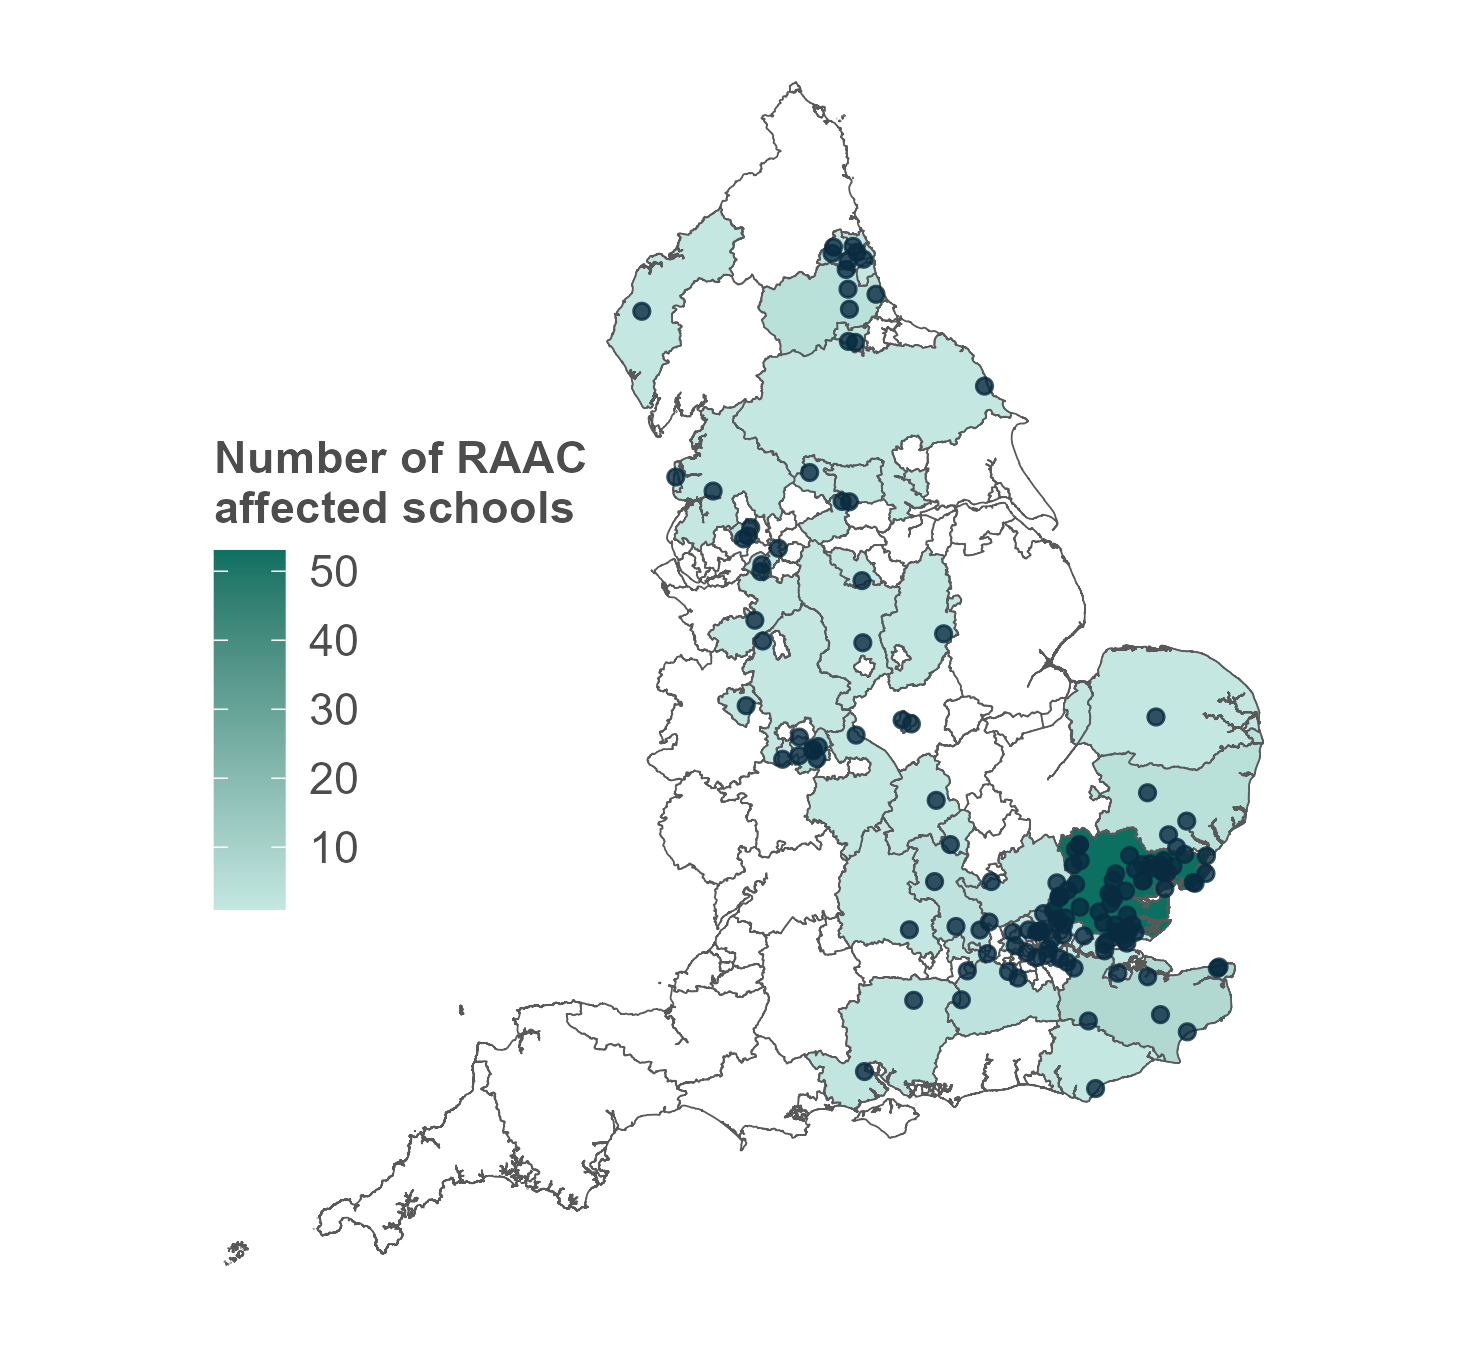
Finally, we mapped out the affected schools to see whether there were any regional or local patterns. The map below shows a concentration of affected schools in Essex, an issue which has been widely reported in the media. It’s not clear why Essex has been more affected than other authorities, but possible reasons could relate to larger post-war school building schemes and more thorough investigations of RAAC across the county. We also find that there are no RAAC affected schools in the South West. Again, we do not yet know whether this is due to the history and funding of schools in the South West, or whether there have been delays in identifying RAAC in the region.
Figure 3: Location of RAAC affected schools
 Overall, we haven’t found anything in this headline analysis that identifies common features of RAAC affected schools (other than they are more likely to be secondary schools and in academy trusts). We continue to highlight the need for a review of what decisions were made, based on what evidence, so that we can learn lessons from this latest incident.