Following rising inflation, frozen tuition fees, and falls in international students, it feels as if the higher education (HE) sector in England is at a financial precipice. The Office for Students (OfS) forecasted that 40 per cent of HE institutions were expected to run a loss in 2023/24, with some HE providers already feeling the squeeze, announcing large-scale staffing cuts and redundancies.
As Labour’s first Budget and associated spending review draws near, reassurance in the face of this crisis is something keenly anticipated by the HE sector. The rumoured tuition fee rise would be popular with providers, but the longer-term sustainability of the current HE funding model remains in doubt.
Yet despite these well-founded worries, there is a crucial part of the education landscape going largely ignored in this debate – further education. In its manifesto, Labour had promised a ‘comprehensive strategy’ that would ‘better integrate’ further and higher education, but what this commitment means in material terms is yet to be seen.
The FE sector remains a key piece of the puzzle for developing a sustainable and effective post-18 system, one that would both drive social mobility and ease the woes of universities in the long-term.
With this in mind, how does the financial health of the FE system compare to that of the HE sector? We’ve taken a look at data from the Education and Skills Funding Agency (ESFA) and Higher Education Statistics Agency (HESA) to assess the state of the two sectors’ finances over the last six years across 4 key metrics.
A few points of note – figures presented are sector-wide averages; even within sectors, the financial health of individual institutions can vary significantly from year-to-year. While we have used weighted measures where possible, these sector averages may still mask financial issues present in the sector for smaller institutions, particularly in higher education where the sector is dominated by a relatively small number of large providers. Pension transactions have been excluded from this analysis due to their disproportionate impact on providers’ balance sheets in certain years.
Nevertheless, both college and university accounts are prepared to the same reporting standards, allowing for the comparison of financial statements.
How many providers are operating at a deficit?
Put simply, a provider is in deficit if it is spending more money in a given year than it takes in income. On the other hand, a larger income than expenditure would put the provider in surplus. While running a deficit in a particular year is not necessarily indicative of poor financial health, few institutions have the reserves to operate with long-term deficits, and a rise in the number of providers operating with deficits may indicate growing financial difficulty across the sector.
Proportion of providers in operating deficit, 2017/18 – 2022/23
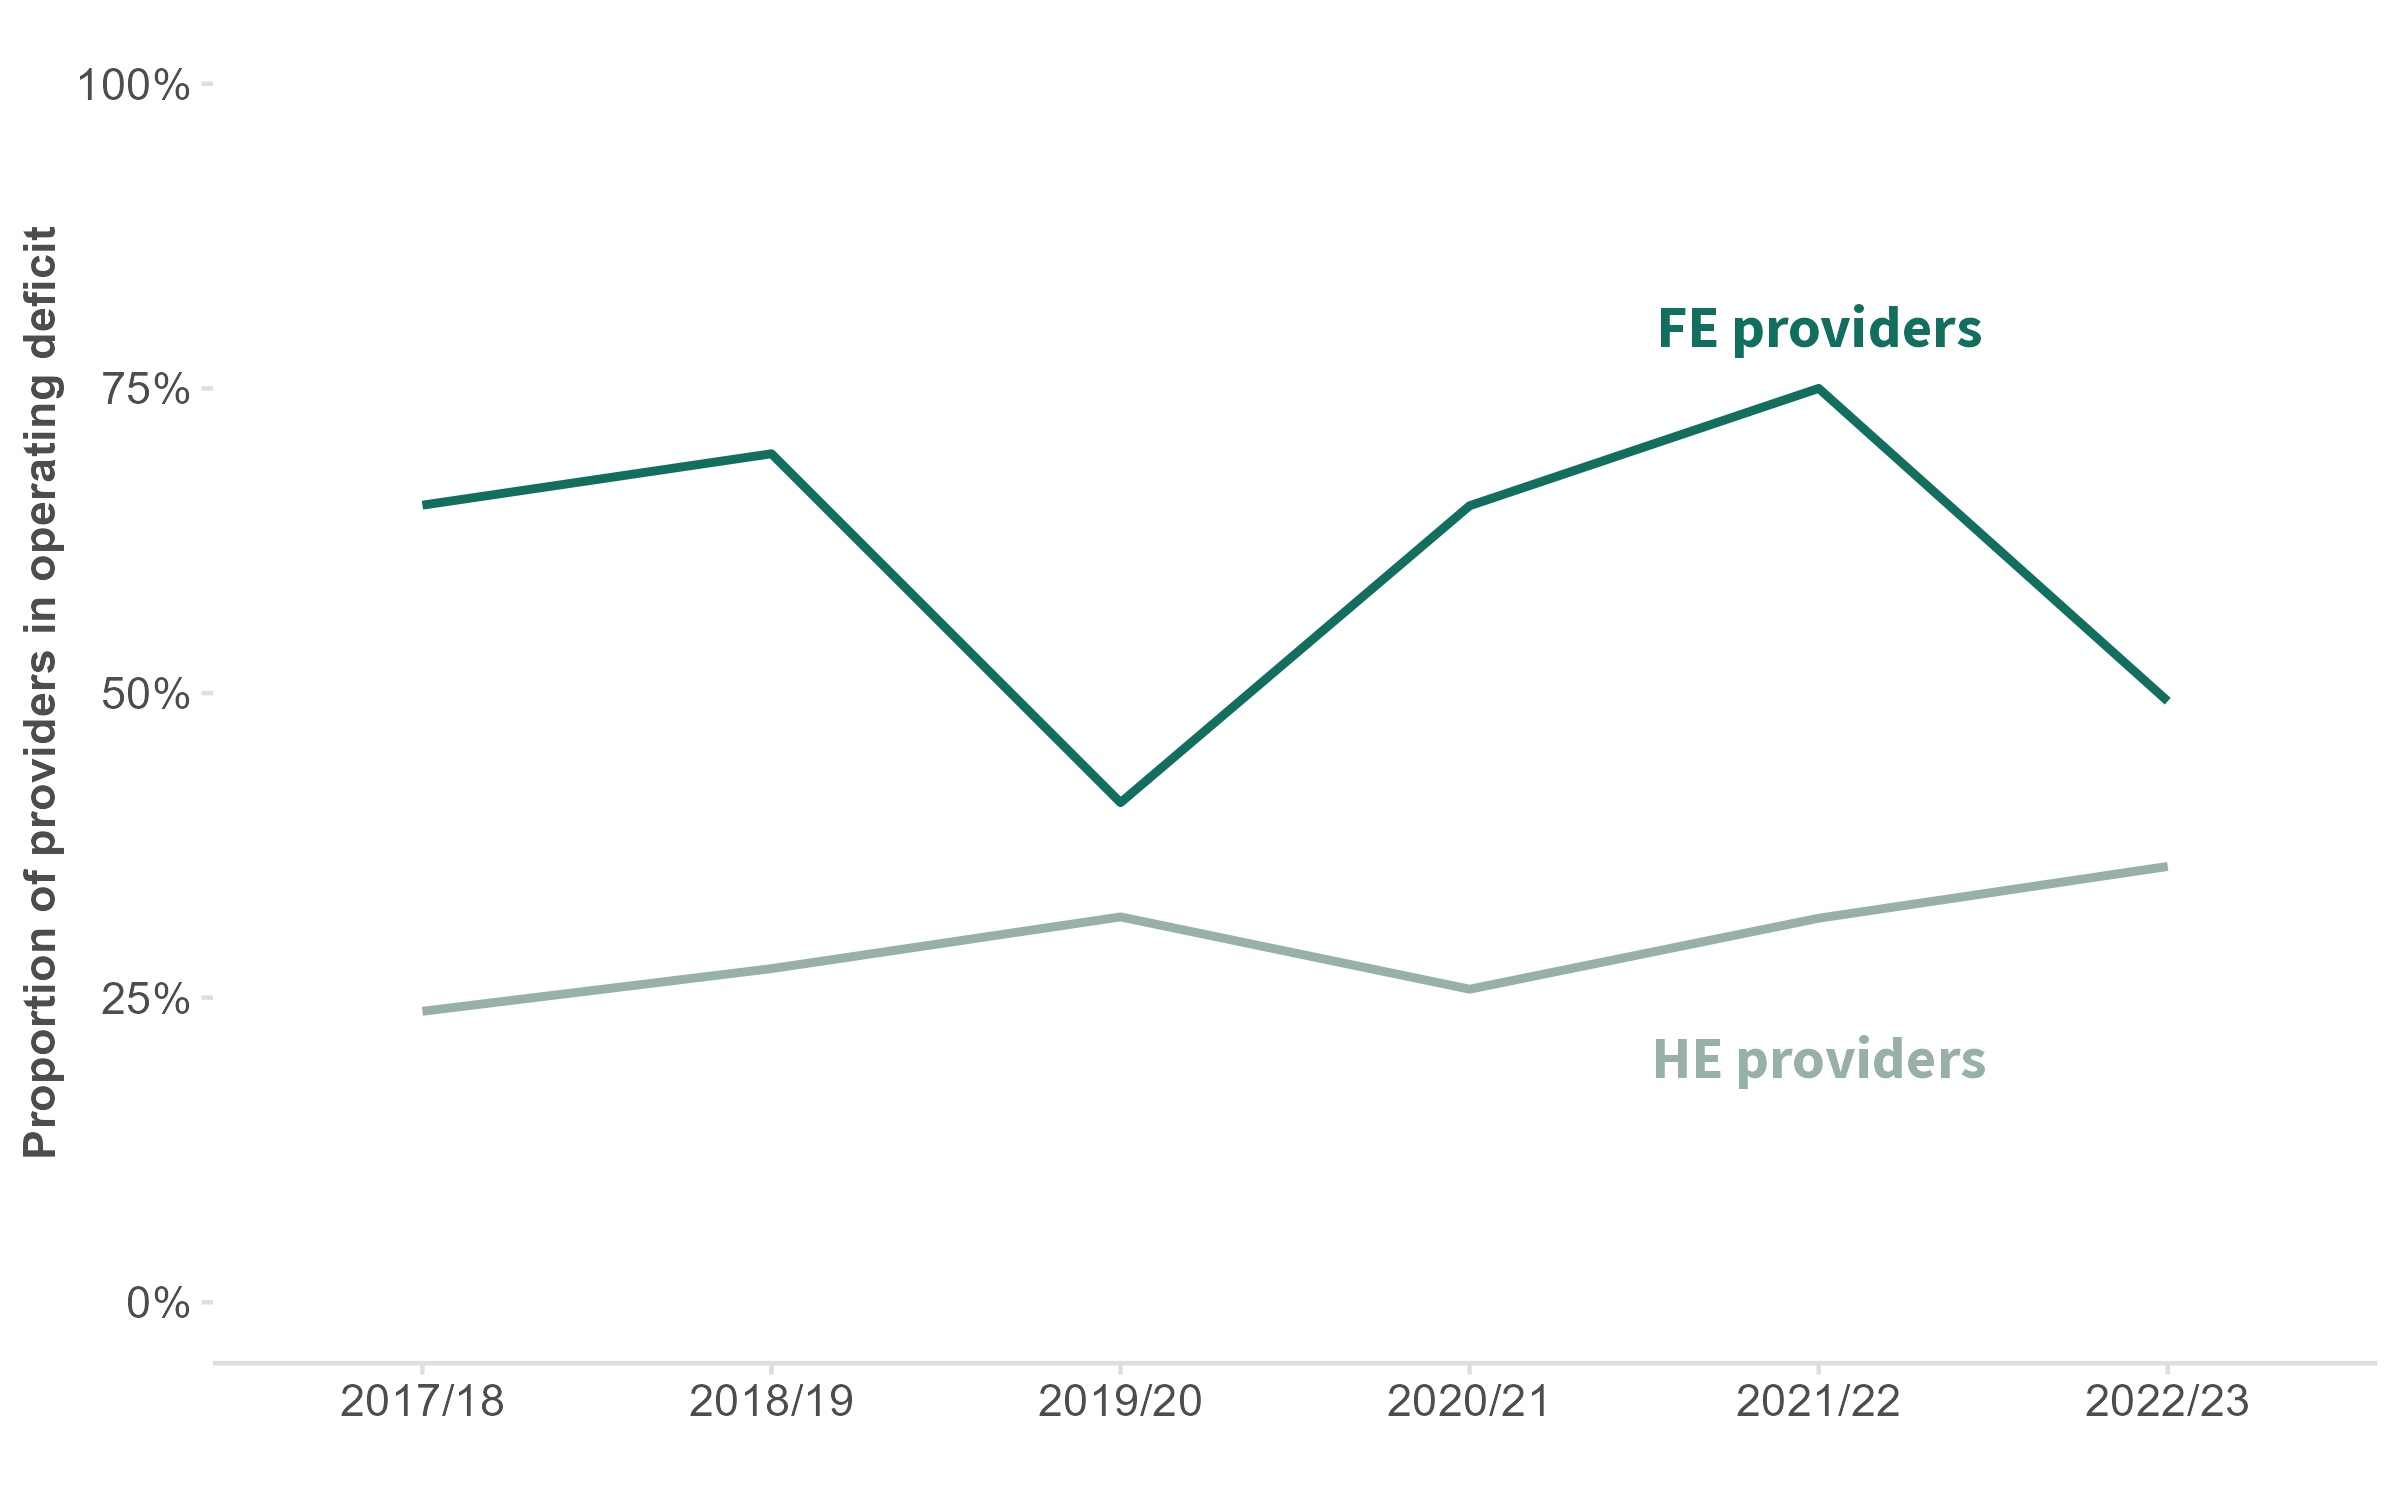
Sources: HESA income and expenditure data, 2017/18 – 2022/23. ESFA financial management: college accounts, 2017/18 – 2022/23. Expenditure figures are adjusted to remove the impact of changes to pension costs.
Since 2017/18, a steadily growing proportion of HE providers have been in an operating deficit, with this figure reaching a record high of 36 per cent in 2022/23. At the same time however, a consistently greater proportion of FE providers have been running deficits. Despite this, the FE sector did see a fall in the proportion of providers reporting deficits in the latest year of available data, 2022/23. This is in large part a result of additional 16-18 spending included as a part of the 2021 spending review. The boost for the sector, while positive, has not been as impactful as expected given the scale of inflation in the past year. Without maintaining or increasing this level of funding in the 2024 spending review, this trend is unlikely to continue.
What is the average surplus/deficit of providers?
Also of note is the average size of the surplus or deficit. A smaller average deficit would suggest that even if a majority of providers are spending more money than they take in, they are still largely able to meet their spending needs.
This metric is income-weighted, so that providers with larger incomes and larger surpluses/deficits have a greater impact on the sector-wide average. It is also presented as a percentage of income rather than a raw figure. As such, a value of zero would indicate that the sector as a whole is breaking even when adjusted for income.
Operating surplus/deficit as a percentage of total income (income weighted), 2017/18 – 2022/23
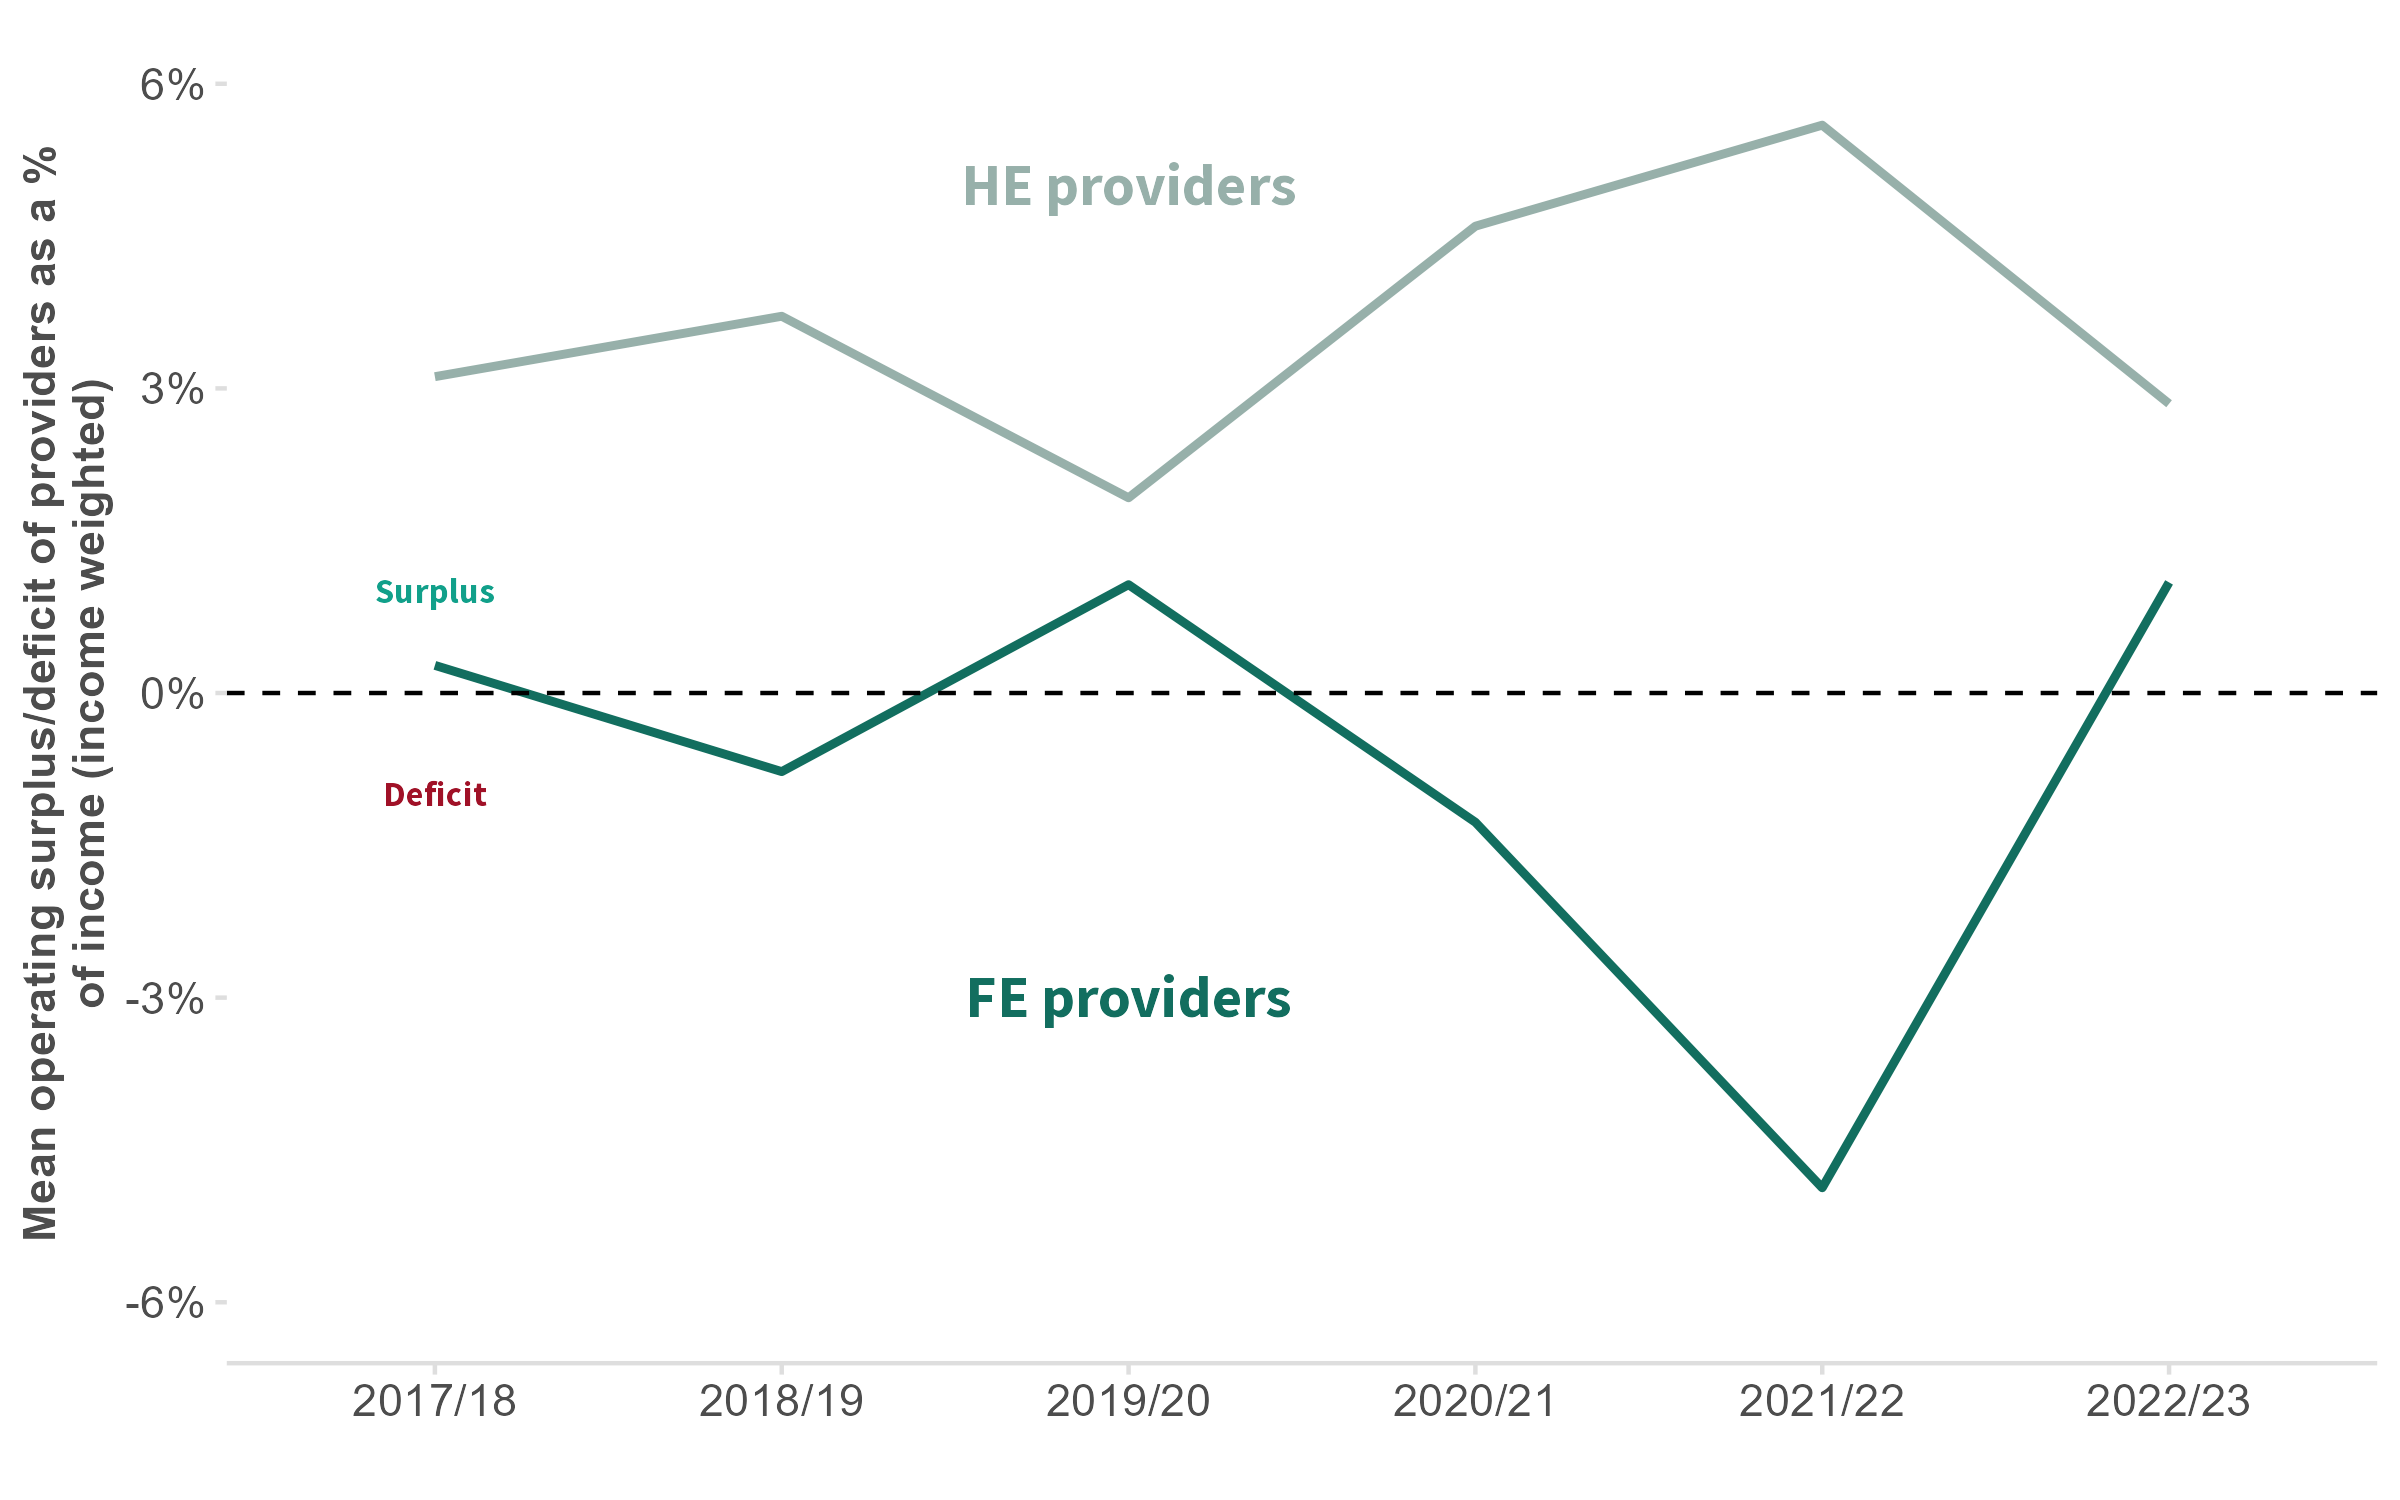
Sources: HESA income and expenditure data, 2017/18 – 2022/23. ESFA financial management: college accounts, 2017/18 – 2022/23. Expenditure figures are adjusted to remove the impact of changes to pension costs.
Since 2017/18, the mean income-weighted operating deficit as a percentage of total income has remained positive for HE providers, reflecting the previous chart that indicated a consistent minority of providers in deficit. In 2022/23, this figure has fallen to its lowest since 2019/20, the year before providers began to see some cost savings as a result of shifts to online teaching and lowered use of campus facilities in the wake of the pandemic.
Further education providers experienced the opposite throughout this period. Despite a brief sector surplus in 2019/20, the sector deficit plunged in the following years. In 2022/23, the sector returned to a surplus (again boosted by additional funding from the 2021 spending review) but remains below the higher education average.
How well are providers able to meet their debts?
The ratio of a provider’s short-term assets (such as cash, inventory, and receivables) to its short-term liabilities (such as payroll, taxes, and money owed to suppliers) is known as the ‘current ratio’. This is an indicator of the provider’s liquidity, or its ability to pay short-term debts.
A ratio of 1.5 for example, would indicate that for every £1 the institution owes in liabilities, it has £1.50 to cover that debt in the form of accessible assets. A healthy current ratio is generally considered to be above 1.2, whereas a ratio below 1.2 may indicate difficulties in meeting debts.
Mean current ratio, 2017/18 – 2022/23
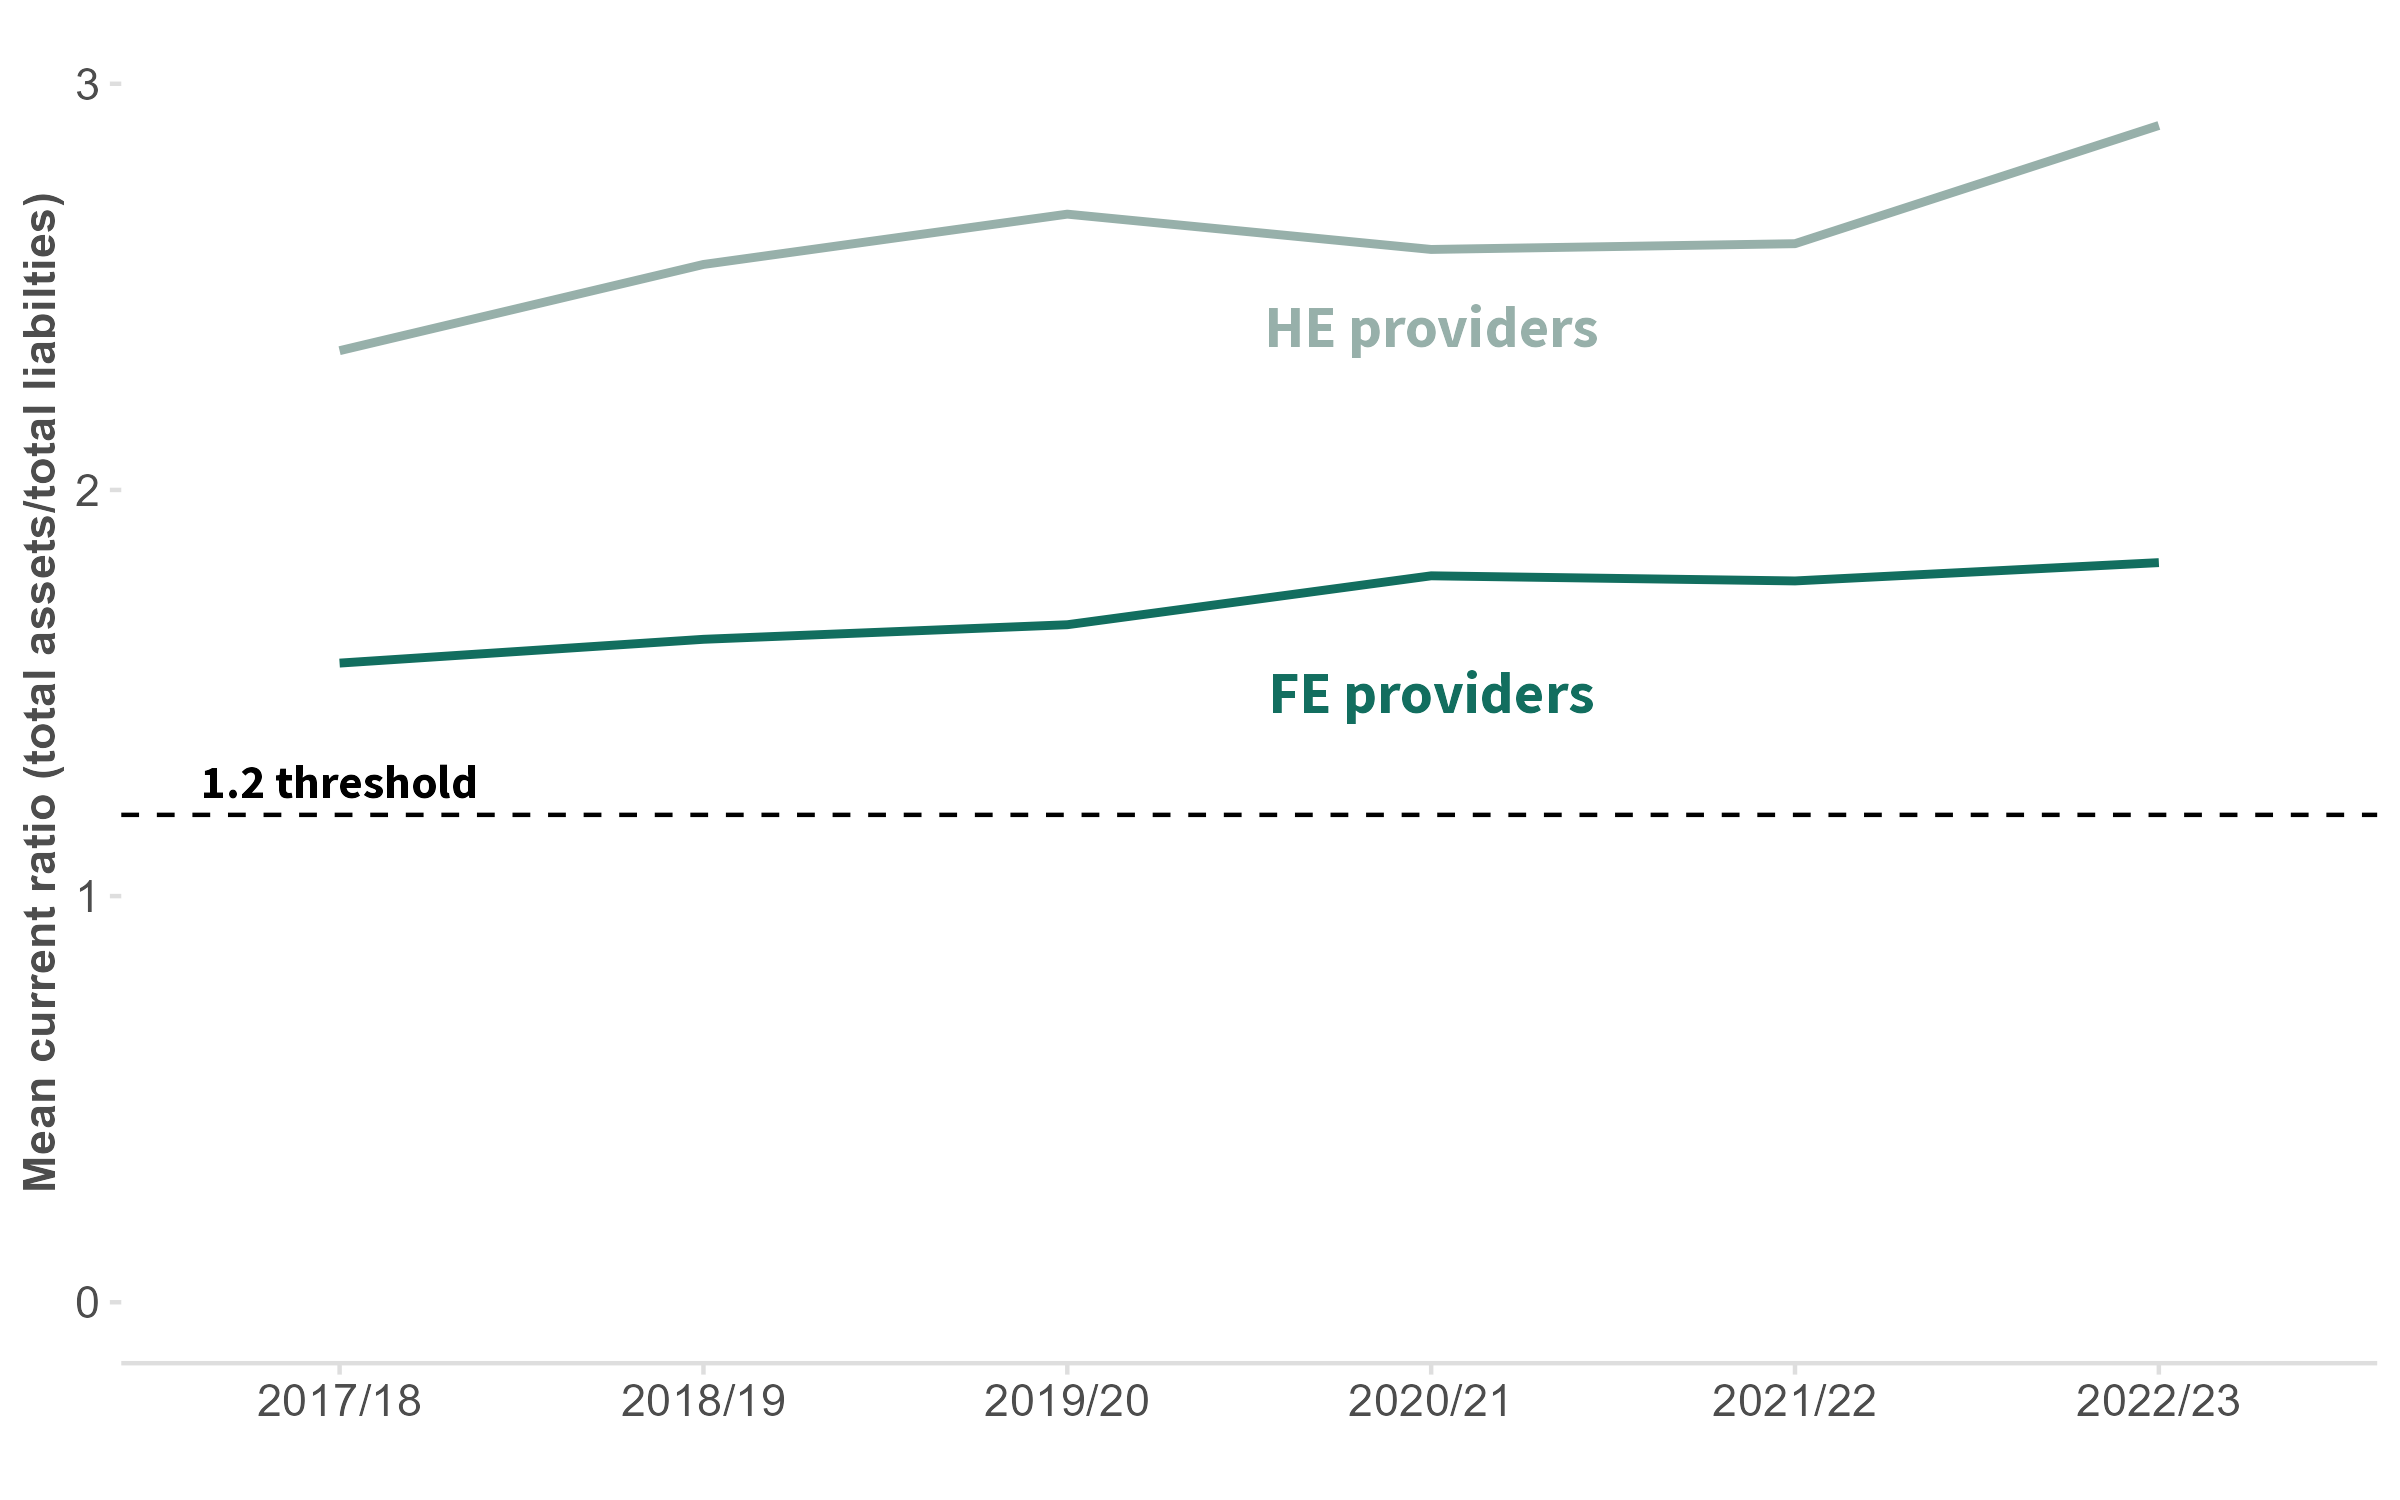
Sources: HESA key financial indicators, 2017/18 – 2022/23. ESFA financial management: college accounts, 2017/18 – 2022/23.
The average current ratio for both sectors has increased steadily since 2017/18 and has always remained above the 1.2 threshold. This is a positive indicator for both, suggesting on average they are increasingly able to meet their short-term obligations.
In higher education, the average ratio is considerably higher at 2.9 in 2022/23, with 19 per cent of providers falling below the 1.2 threshold. In further education however, the average ratio sits at 1.8, while 25 per cent of providers have a current ratio below 1.2.
Proportion of providers with current ratio below 1.2, 2017/18 – 2022/23
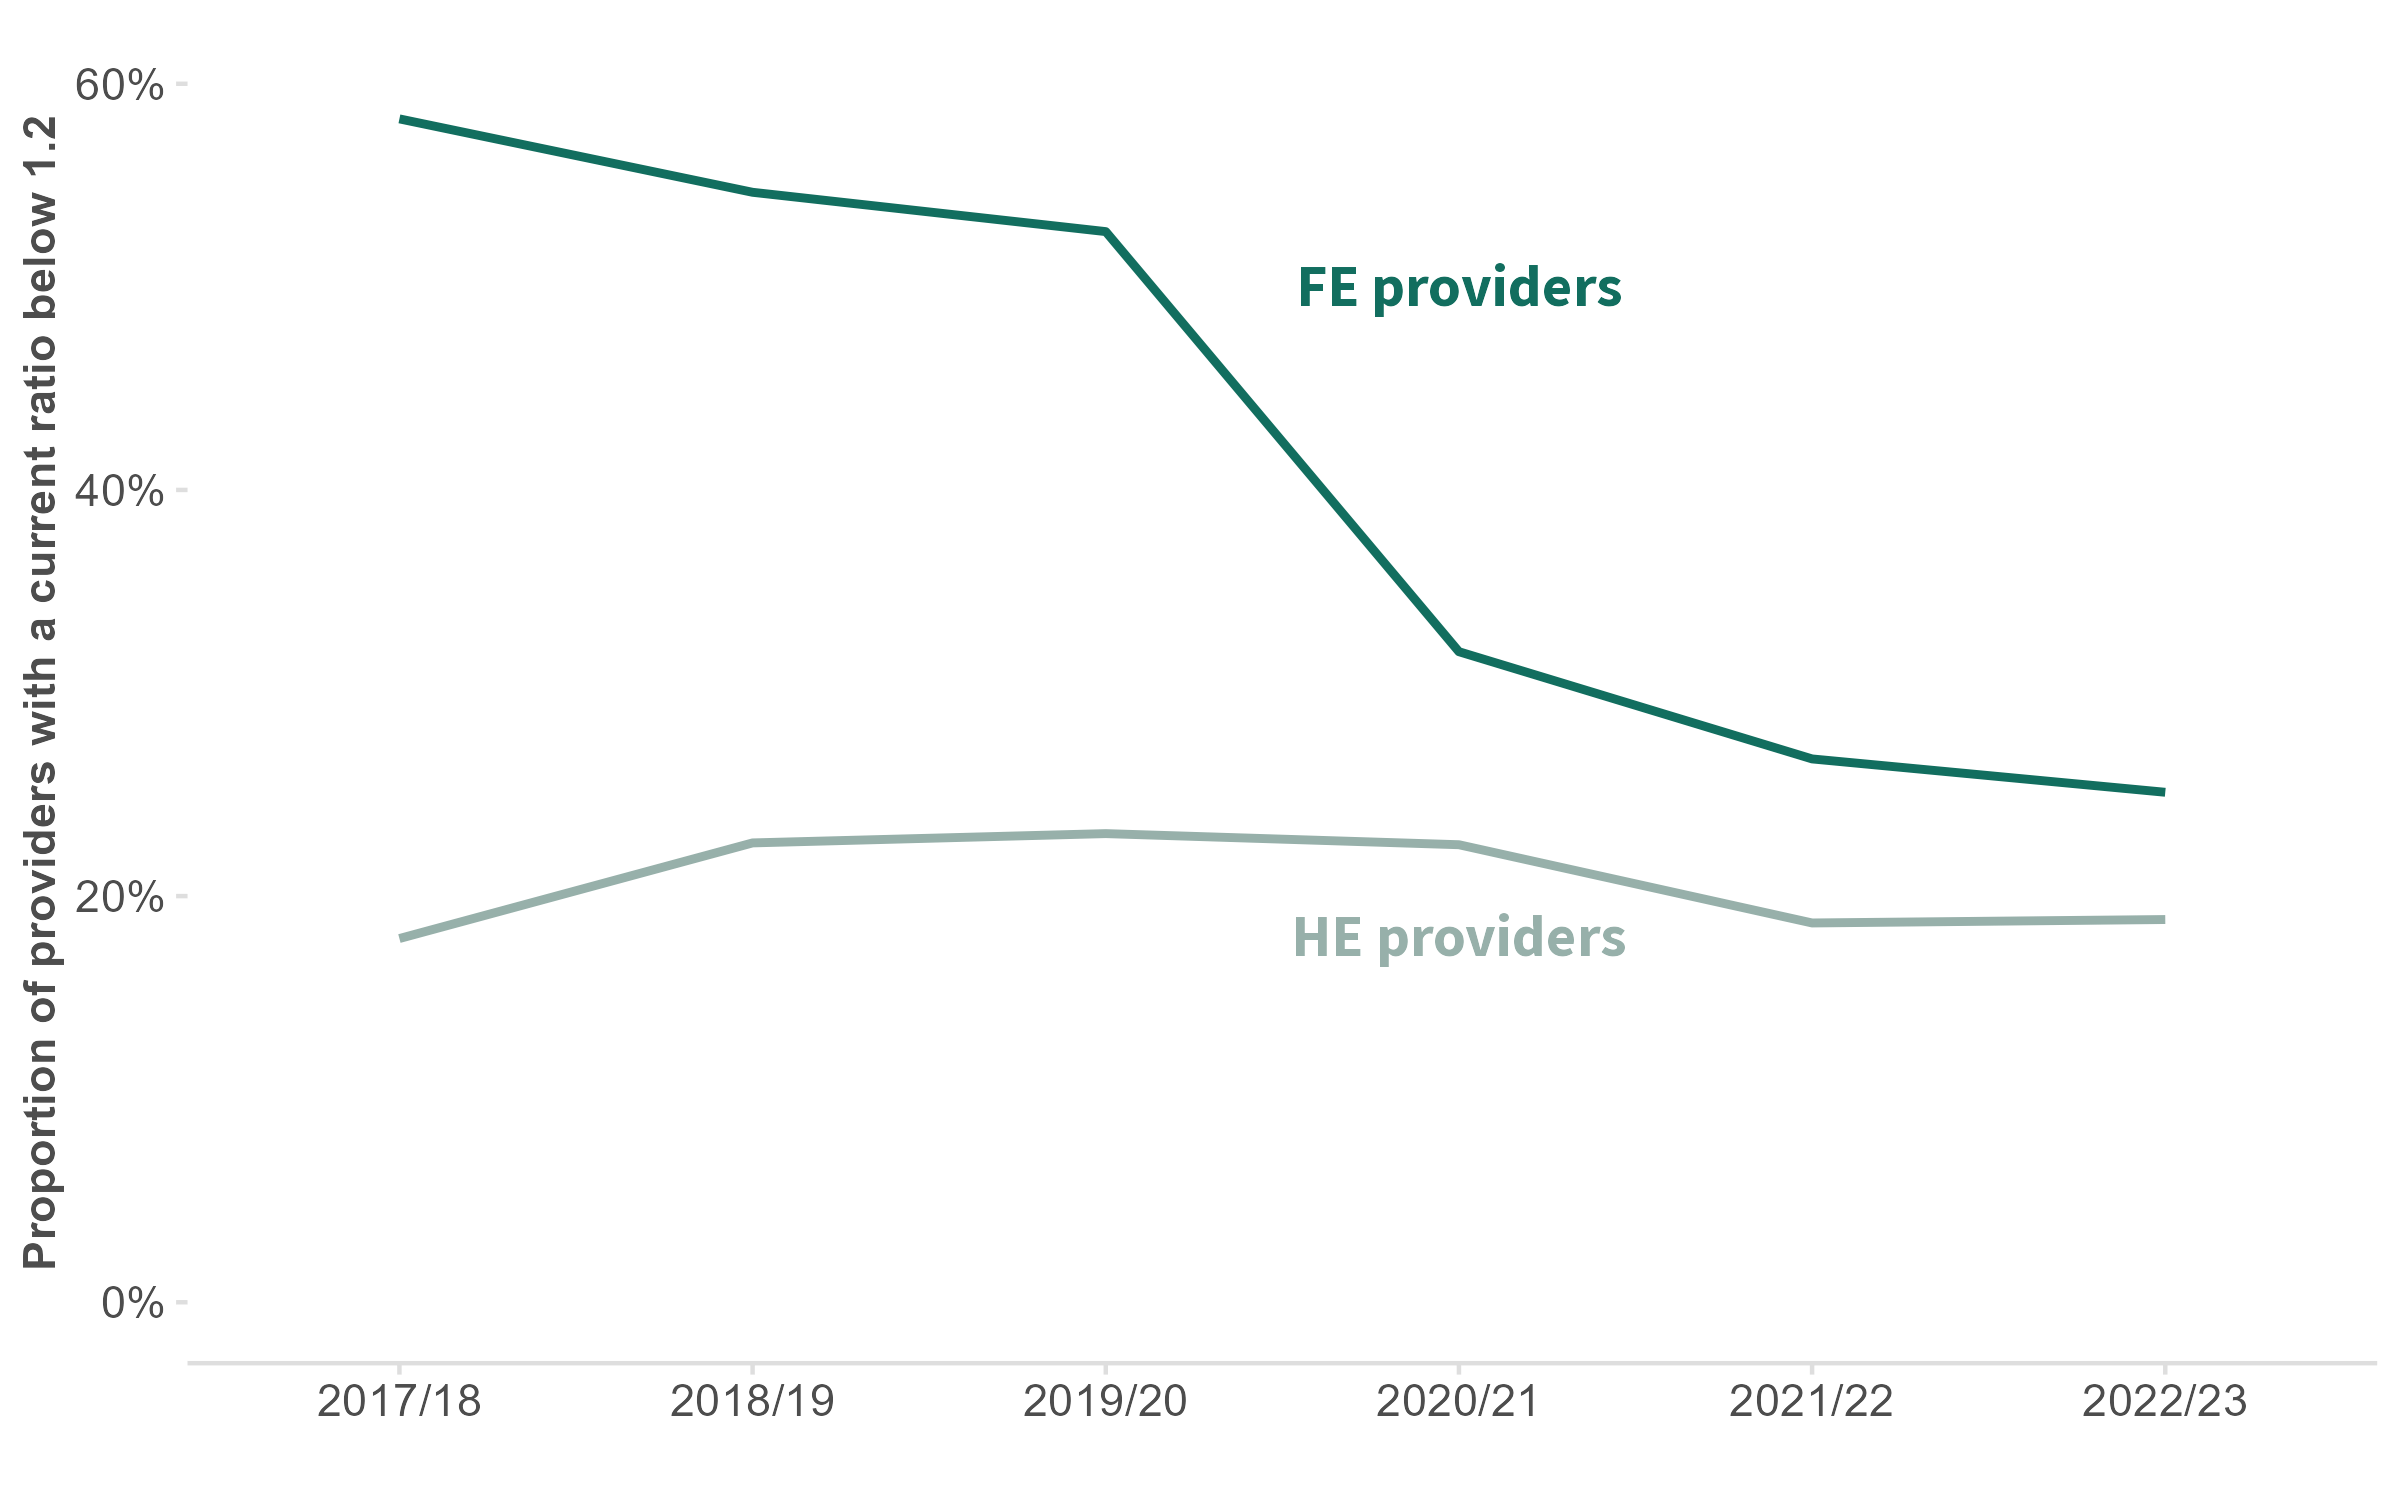
Sources: HESA key financial indicators, 2017/18 – 2022/23. ESFA financial management: college accounts, 2017/18 – 2022/23.
Put together, these financial metrics show a clear picture: when compared to their higher education counterparts, more further education providers are in deficit, their deficits are larger, and they are less able to meet those debt obligations.
Given this picture, the Treasury must place further education alongside higher education in terms of funding priorities in the upcoming budget. Without adequate funding for the sector, the scale of the challenges outlined above will only grow in the coming years, leaving many providers with an increasingly troubling financial outlook.
Alongside this, the government should consider how this funding can further support level 4 and 5 (higher technical) provision and apprenticeships for students under 25. As well as an important part of meeting growing skills demands, this provision can play a role in broadening participation in education and training after age 18, particularly among students from low-participation areas and those from the most disadvantaged backgrounds, who research has shown are more likely to participate in FE than progress to higher education. Furthermore, these alternatives to undergraduate degrees are less costly to both the Treasury and to prospective students, whilst also providing comparable employment outcomes.
Ultimately, further education must be seen as part of a holistic system of post-18 education of the kind Labour pledged to develop in its 2024 manifesto. This can’t happen unless both sectors are financially sustainable.