The Times recently published an article suggesting that the Chancellor is considering altering both the maximum level of tuition fees and the conditions of student loans.
Reportedly, these changes would include: cutting undergraduate tuition fees by £1,750 from £9,250 to £7,500, increasing the repayment threshold from £21,000 to £25,000; and reducing the interest rates students pay for their loans. Universities would be partly compensated for the cut in fees with a £1,500 top up for each student enrolled in a STEM degree.
If the Times sources are right, the government may unveil new plans for student and university funding either at the Conservative Party Conference starting on Sunday or in the Autumn Budget in November. Assuming the details of the article are accurate, many details still remain unknown, such as whether or how much fees would vary by subject or university.
We have nevertheless modelled three possible scenarios based on the proposals set out in The Times, estimating the impacts they would have on students and government:
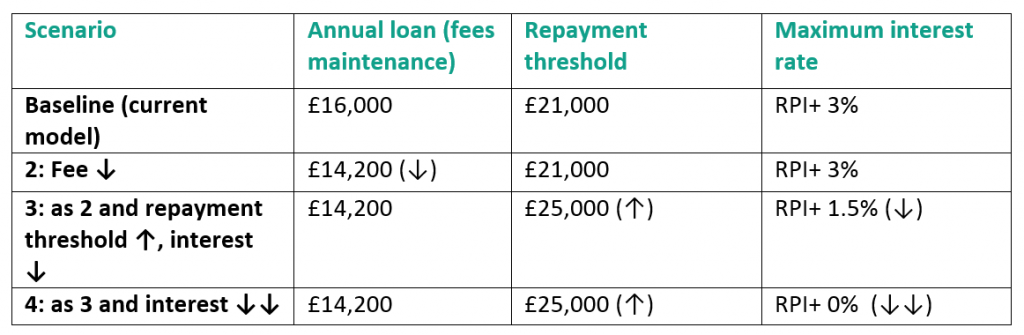
Our estimates present some limitations. First, we assume all students will stay in 3-year undergraduate degrees. Second, despite using the latest earnings growth and inflation forecast for the period 2015-2020, the mid and long-term economic environment remains uncertain. [1] Third, the lack of detail in the Times article means that we have had to make some assumptions about the details of the changes; a methodology note can be found in the footnotes.[2]
We comment here on the potential effects of the scenarios on three areas: the debt accrued by students, the amount of public subsidy, and the progressivity of the changes.
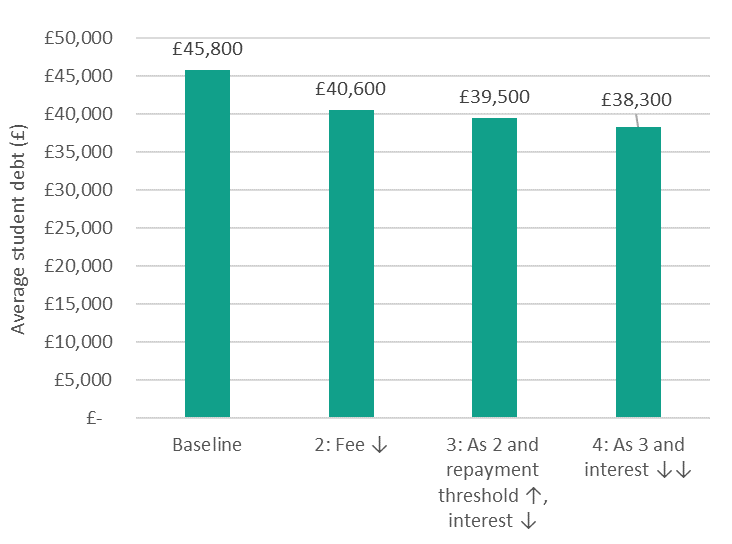
A – Student debt. All alternative scenarios include a reduction in fees, and therefore in the maximum amount of loan taken, which means that students would always reach the repayment date one year after graduation with lower debt levels than under the current model. While the average student debt is currently circa £45,800, it would go down to £40,600 if the only change introduced was a reduction in fees, while it would drop to £39,500 if on top of that the interest rate was slashed to RPI+1.5%, and to £38,300 if interest rate was RPI+ 0%.
Figure 1. Average student debt upon leaving University
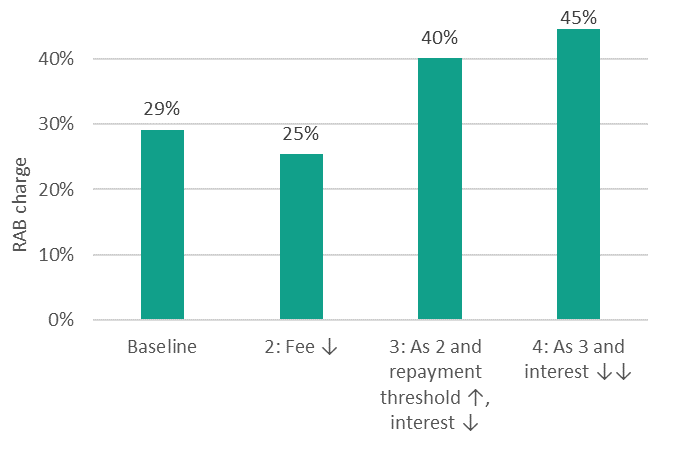
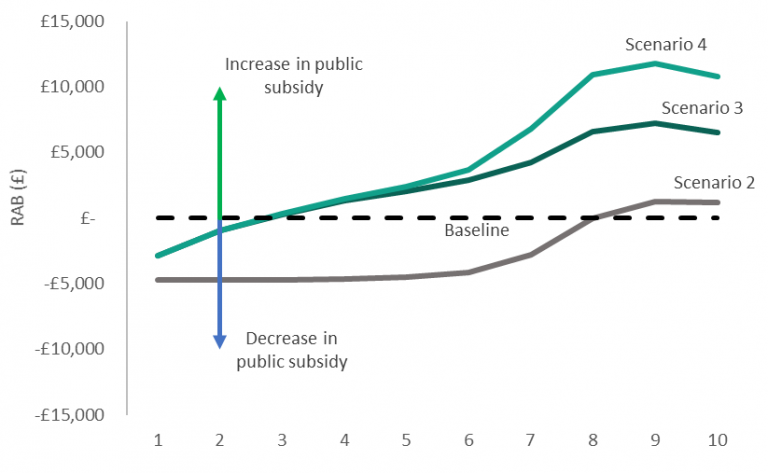
B – Public subsidy. The level of public subsidy to student loans is reflected in the RAB (Resource Accounting and Budgeting) charge. Under the current arrangements, the level of public subsidy or RAB charge is estimated to be 29 per cent, which means that the government estimates that 29 per cent of all the money lent in the form of student debts will be written off after 30 years. This is just an estimate because it depends on the future earnings of graduates. If the only change introduced is a reduction in fees, more graduates would repay more of their debt, and therefore the government would expect the total subsidy to decline; we estimate from 29 per cent to 25 per cent.
However, increases to the repayment threshold have the effect of reducing the amount of debt that graduates repay. As such scenario 3 and 4, which combine a reduction in fees with increases to the repayment threshold result in a dramatic increase to the RAB charge: to 40 per cent if the repayment threshold is lifted to £25,000 and the interest rate cut down to RPI+1.5%, and to 45 per cent if the interest rate was set at RPI+0%. The reasons behind this expansion of the public subsidy are explained in point C.
Figure 2. Average RAB charge or level of public subsidy to student loans across scenarios
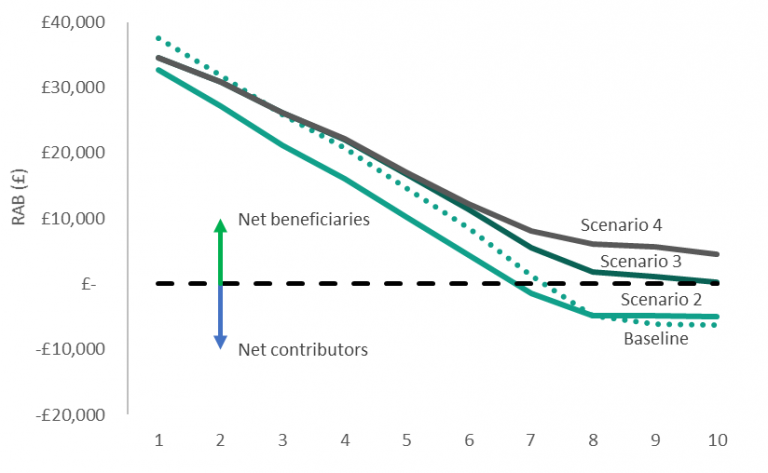
C – Progressivity of the system. Under the current system, the 30% highest earners are net contributors to the system, and the proportion goes up to 40% of highest earners in scenario 2. For example, graduates in the highest income decile currently pay back around £6,200 more than they receive in government subsidies, and this would reduce to £5,000 under scenario 2.
However, this is not true for scenarios 3 or 4, under which all income deciles would receive net public subsidies. Under scenario 4, the 10% highest earners, who are estimated to have an average annual salary of £83,800 during the repayment period, would be net recipients of £4,500 from government subsidy. This results mainly from the reduction of the interest rate, rather than lifting the repayment threshold to £25,000. By charging higher interest rates more of the burden is put onto higher earners. This is because higher earners will end up paying both their initial loan and the accrued interest whilst low earners will not pay any of the accrued interest, nor all the amount they borrowed.
Figure 3. Distribution of RAB in pounds per person across future earning deciles (1 = lowest earners, 10 = highest earners)
Consequently, each scenario is more relatively regressive than the former (4 more than 3, 3 more than 2 etc). Figure 4 shows the change in public subsidy by earning decile, as compared to the baseline. It shows that the public subsidy reduces for low earners under all scenarios, compared to the current system. For example, the 10% lowest earners would get £4,700 less than under scenario 2 than under the current system, and £2,900 less under scenario 3 and 4. Conversely, the 10% highest earners would get £,1200 more under scenario 2 than they do today, £6,500 more under scenario 3 and £10,700 more under scenario 4.
Figure 4. Change in public subsidy per capita against the baseline (current policy) across future earning deciles (1= lowest earners, 10= highest earners)
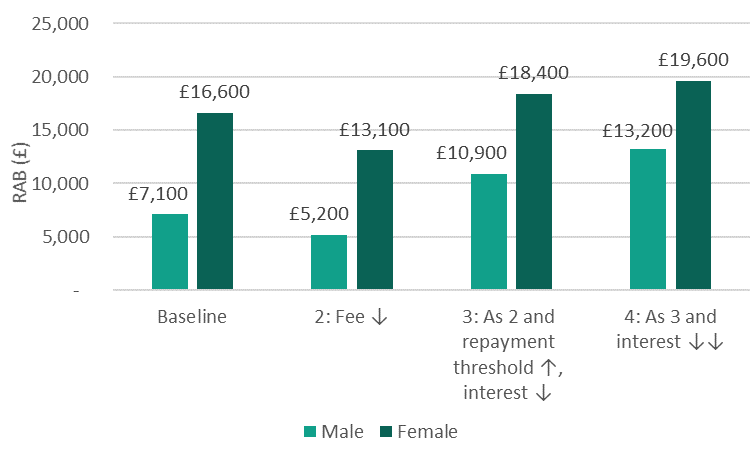
The concentration of the additional subsidy in the higher levels of income would benefit men rather than women, given that men are more likely to be high earners. For example, under scenario 4, where the public subsidy is highest, the average RAB for men would be £13,200, an 85.3 per cent increase from the current system (£7,100). The RAB for women would grow by only 18.6 per cent, from £16,600 to £19,600.
Figure 5. Distribution of RAB in pounds by gender across scenarios
How would these changes affect universities?
The effects these changes would have for universities are even more difficult to estimate, due to lack of detail and availability of data. The reduction of fees to £7,500 would affect UK and EU undergraduate students (at least until Brexit). The fees paid by this group of students represent around 30% of the total HE budget in England.[3] We know that a significant proportion of undergraduate students enrol in STEM degrees (however the government chooses to define it).[4] If universities received the £1,500 top up for each of these students, then the effect on university financing would be partly mitigated. However, we do not currently know whether universities would receive the additional £1,500 or a fraction for part-time students nor whether the top up would be given for all STEM students or only for those in specific subjects. What we can expect with certainty, though, is that effects would be more broadly noticed by universities that are less research intensive, less reliant on international students and less reliant on STEM students.
Conclusions
If a policy like the one outlined by The Times’ article was eventually implemented, there are many details that would need to be revealed for us to make precise estimations of its potential effects. However, if the plans of the governments are to cut fees, raise the repayment threshold and reduce the interest rate, then whilst we would see lower overall levels of graduate debt, this would be accompanied by an increased burden on the public finances, additional pressure on the sustainability of some universities, and a less progressive system.
Gerard Dominguez-Reig, Senior Researcher, Post-16 and Skills, Education Policy Institute
[1] Office for Budget Responsibility, 2017, ´Economic and Fiscal Outlook´. http://budgetresponsibility.org.uk/download/march-2017-economic-and-fiscal-outlook-supplementary-economy-tables/
[2] Methodology note: We made our estimates using the 2015 BIS/DfE ready reckoner student loan repayment model, which we first used for our Remaking Tertiary Education report with Alison Wolf published last year. The version used for this analysis incorporates the latest earnings growth and inflation forecasts from the OBR release in March 2017 for the period 2015-2020, while older BIS estimates have been kept for 2021 onwards. This reflects a downward revision of real wage growth forecasts, which may be caused by the aftermath of the Brexit referendum.
For the baseline scenario and scenario 2, we assume that the repayment threshold stays at £21,000 until 2020, only to rise with inflation in following years. For all the other scenarios, we assume the threshold is set at £25,000 and starts rising in 2020. For each scenario, we uprate the amount of student loans borrowed in line with the inflation. For scenarios 2 to 4, we assume the new fee level (£7,500) would be introduced in 2018 and uprated in line with the inflation yearly. Numbers are for students starting university in 2020 and reaching the repayment date in 2024, and always in 2017 prices.
[3] HESA, 2017, ‘HE Finance Plus 2015/16 and Higher Education Statistics for the United Kingdom – Finance’, Table 16 – Income of UK HE providers by source of income and location of HE provider 2015/16 https://www.hesa.ac.uk/files/pre-release/heuk_finances_1516_all_tables.xlsx
[4] HESA, 2017, ‘Higher education student enrolments and qualifications obtained at higher education providers in the United Kingdom 2015/16’, Table 6a – Full-time HE student enrolments by level of study, subject area**, sex, age group, disability status and ethnicity 2015/16 https://www.hesa.ac.uk/file/6439/download?token=Kz24_xo7