The Department for Education (DfE) has released interim national results for 2016’s Key Stage 2 Assessments.[1] As explained in our policy analysis paper published in May, this year’s tests feature significant changes in curriculum content, assessment methods, and the reporting of results.[2]
Scaled scores are being produced based on raw test marks to enable greater comparability from year to year. The translation of raw marks into scaled scores is controlled by the Department. Scores are scaled to between 80 and 120, with the ‘expected level’ equivalent to a scaled score of 100.
Today, the Department has reported the proportion of children achieving the ‘expected standard’ in reading; grammar, punctuation and spelling; and mathematics tests, along with teacher assessments in writing. The Department has also published the average scaled score in each of these subjects.
Because of the changes to these assessments, the Education Secretary, the Rt Hon. Nicky Morgan MP, was right to caution yesterday that these results cannot be easily compared to previous years’ figures and cannot be used to infer any trend in the general quality of teaching in primary schools.[3] The release of these results is intended to help schools and parents understand pupils’ performance relative to that of the rest of the country, not how pupils have performed relative to the previous cohort. However, given the DfE have set an ‘expected standard’, these results do give some indication of how far the Government’s expectations for performance have changed.
How far has the bar been raised?
The previous national curriculum used 8 levels for 5 to 14 year olds to describe pupils’ performance in different subjects. For those at the end of Key Stage 2 (age 11), the curriculum set out that most were expected to achieve at least a Level 4[4]. A Level 4 was thought to give children a good chance of passing at least five GCSEs at A*-C. In practice, it has been more commonly asserted that the sub-level 4b (the middle third of those achieving Level 4) was a more valid predictor of secondary success, and this has formed the basis for the Government’s reforms.[5]
Whilst the average scaled scores released today are impossible to interpret in isolation and figures are not directly comparable for the purposes of assessing changes in educational standards or teaching, the change in the proportion of pupils reaching the Government’s expected standards under this year’s tests and last’s gives some indication of the scale of the policy change. It suggests some combination of the standards being generally higher and the new curriculum not yet being fully established – particularly as those taking the tests were only being taught the new curriculum for two of their four years at Key Stage 2.
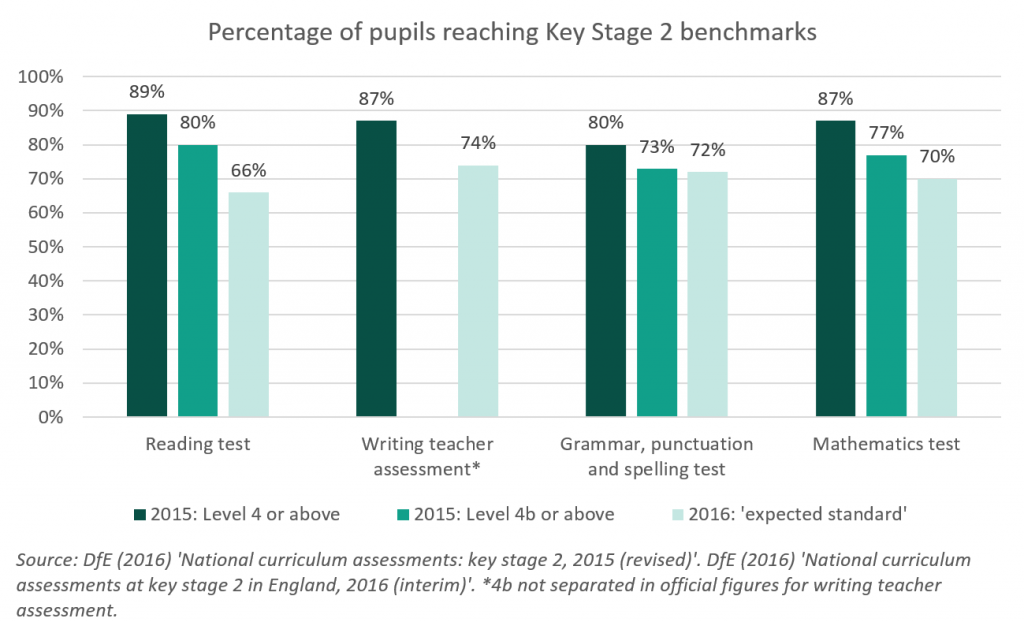
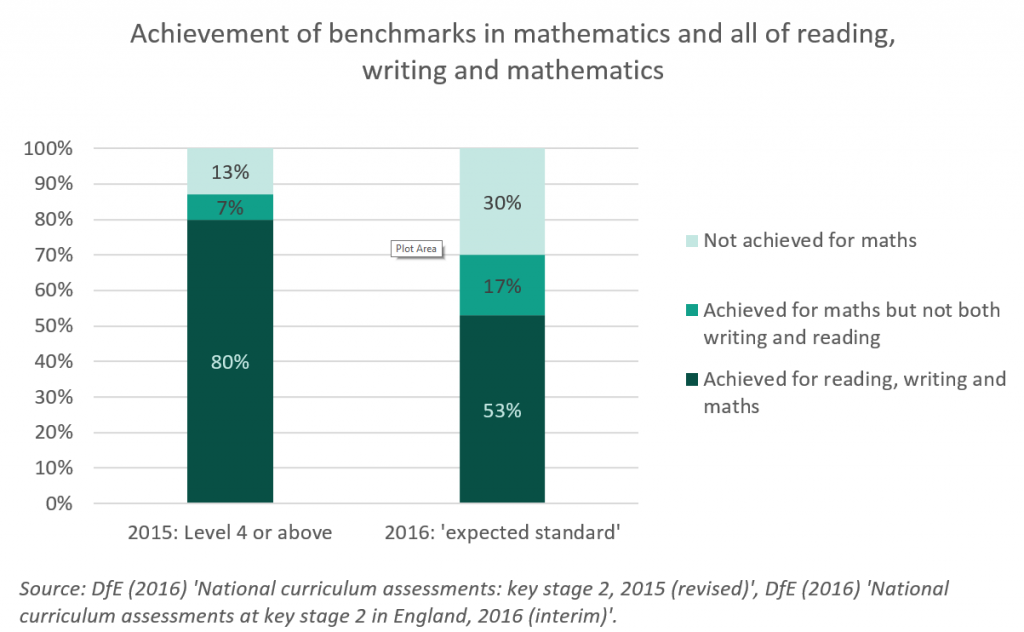
The headline result is that 53 per cent of pupils in schools in England achieved the expected standard in all of reading, writing and mathematics in 2016. 80 per cent achieved Level 4 or above in Key Stage 2 assessments for 2015 under the old National Curriculum system – a 27 percentage point-higher figure. The proportion achieving Level 4b in 2015 for reaching, writing and mathematics was reported by the DfE as 69 per cent. Because writing is not broken down into sub-levels, the 69 per cent includes those who achieved a Level 4b in reading and maths, and who achieved a Level 4 in writing. The Education Policy Institute’s Annual Report (published under our previous name, CentreForum) estimated that the true proportion of pupils achieving a Level 4b across all three subjects was around 59% in 2015 – 6 percentage points higher than the proportion reaching the Government’s expected standard in 2016.[6]
Given the difficulty of comparing figures, and the fact that this is the first year of these assessments, it is difficult to say at this stage whether the new standards are consistent or not with the previous Level 4b, but the shift is of the expected magnitude. Our Annual Report set a proposed goal for 85 per cent pupils to achieve what was a Level 4b by 2025. This would put us on track to ensure that the majority begin secondary school with the skills required to go on to succeed in their GCSEs, putting England among the highest performing developed countries by 2030. Now that we have new data on the implications of the changes to primary assessment, we will review and potentially adjust these goals.
However you look at it, the scale of the challenge is clear: these figures suggest over a quarter of a million pupils not reaching the Government’s expected standard in reading, writing and mathematics.
Has the relationship between subjects changed?
Unsurprisingly, as the figure below shows, the reduction in the number of pupils achieving the overall respective benchmarks between 2015 and 2016 is reflected in changes in each of the subjects assessed.
The most interesting pattern is that only 66 per cent of pupils achieved the reading test threshold, lower than for the other subjects. As noted in the DfE’s Statistical release, the new results reverse the pattern of recent years of reading having the highest proportion reaching the standard benchmark among reading, writing and mathematics.
In comparison, the proportion reaching the expected standard in the new grammar, punctuation and spelling test was only 8 percentage points lower than the proportion achieving the old Level 4 in 2015.
It is not possible to discern how far this change in pattern is a result of a conscious policy decision by the Department to encourage schools to focus more on reading than previously, or an unexpected outcome of the way the assessments have played out in practice between externally marked exams and teacher assessments.
More generally, there is some evidence of less consistency in pupils’ results across subjects. The figure below plots the proportion of pupils achieving the respective standards in maths, and whether they also achieved the respective standards across reading and writing in 2015 and 2016. In 2015, 92 per cent of pupils who achieved a Level 4 in maths, also did so in reading and writing. In 2016, only 76 per cent of those achieving the expected standard level in maths achieved it in both reading and writing as well.
This change could be a result of a number of potential factors, including:
- There is more variability in pupils’ assessments in the different subjects, and a bigger proportion of this being unrelated to actual ability;
- Schools have – consciously or otherwise – focused on or been more effective in adapting their teaching of some subjects than others in response to the new curriculum; or
- The new set of assessments and curricula inherently reward the performance of ‘all rounders’ less, and children have achieved greater scores in some subjects at the expense of focus on the others more than previously.
At this stage, it is not possible to discern what is behind these trends or their significance. Further provisional data published on 1 September, and revised figures to be released in December, should tell us more. Data at pupil, school and national level will help us determine how much of the patterns across subjects are caused by variation at national level, school level trends that may be associated with strategies for implementing the national curriculum, and differences in the implications of the new curriculum in each subject for pupils with different characteristics.
[1] Department for Education (2016) National curriculum assessments at key stage 2 in England, 2016 (interim)
[2] Education Policy Institute (2016) Key Stage 2 Assessments 2016: What to Look out For
[3] http://www.bbc.co.uk/news/education-36703784
[4] Department for Education, School Performance Tables [Accessed 5/7/2016] http://www.education.gov.uk/schools/performance/archive/ks3_05/k5.shtml
[5] As explained in the Department for Education’s 2013 consultation on primary assessment, “In 2012, fewer than half the pupils who had only just reached the current expected standard in both of these subjects went on to achieve 5 A*-C GCSEs at 16, including English and mathematics. In contrast, 7 in 10 of those with a good level 4 in these subjects achieved this GCSE standard”. Department for Education (2013) Primary assessment and accountability under the new national curriculum.
[6] CentreForum (2016) Education in England: Annual Report 2016