Today saw 670,000 16 year olds across the UK receive their GCSE results. In the final year before some of the new GCSEs and grading structures have an impact on exam results, we take a closer look at what today’s results tell us.
Subject entry
Today’s data only tells us the number and proportion of pupils achieving each grade in certain subjects. We cannot discern from that the combination of subjects taken by pupils or how many pupils scored 5 A*-C grades including English and maths (although this measure is less important now because the school accountability and performance tables focus on progress measures and performance across Attainment 8 subjects). The Department has said that the data for Progress 8 and Attainment 8 will be released in the autumn, so further analysis will follow then.
But what is interesting to look at in the meantime is the trend in the most and least popular subjects. What today’s data shows is that computing has seen the largest increase in entries (up 76%), but is still a minority subject with 62,000 entries in 2016.
Among the most popular subjects, additional science saw the largest increase since last year (up 11%) followed by geography (up 7%).
Engineering and health and social care are two emerging subjects gaining entries, increasing by 12% to almost 8,000 and 8% to 21,000, respectively.
Conversely, humanities saw the biggest decrease in entries (down 37%) with fewer than 5,000 entries in 2016. Possibly linked to the increase in computing, ICT entries decreased by 25% to 84,000.
Of the major subjects, design and technology (down 10%), French (down 8%) and art and design (down 6%) saw the largest decreases since last year.
These patterns are likely to be driven by the Government’s intention to get more pupils to study the English Baccalaureate (or, E-Bacc). The E-Bacc requires pupils to achieve a C or above in English, maths, two sciences, a language and history or geography. Because the proportion of pupils achieving the E-Bacc is now a prominent feature on school performance tables, there is a significant incentive for schools to encourage their pupils to take subjects that meet the E-Bacc criteria.
Indeed, the top five increases in major subjects (with more than 100,000 entries) were the EBacc subjects: additional science, geography, chemistry, history and physics. However, language entries have reduced by around 14,000 since last year; most of this decrease was in French, but there was also a small decrease in German, partially offset by a smaller increase in Spanish. The incentive for pupils is less clear-cut and, as we see from the trends over the last few years, the focus on the E-Bacc (which was introduced in 2011) seems to have caused a decline in entry in subjects that do not qualify, such as design and technology and art and design.
Attainment
In English and maths, the proportion of pupils achieving A* – C grades has decreased by 5 percentage points and 2 percentage points respectively. These decreases were slightly larger for boys, but a more important explanation comes from the first cohort of pupils required to resit these subjects if they received a D-grade at age 16. Among candidates aged 17 and over, the pass rate dropped by 8 percentage points to 27% in English and by 6 percentage points to 30% in maths.
This year, 29% of 16 year olds failed to secure a grade C or higher in English and 30% in maths, meaning that upwards of 170,000 of them will need to continue these subjects to age 18.
Gender patterns
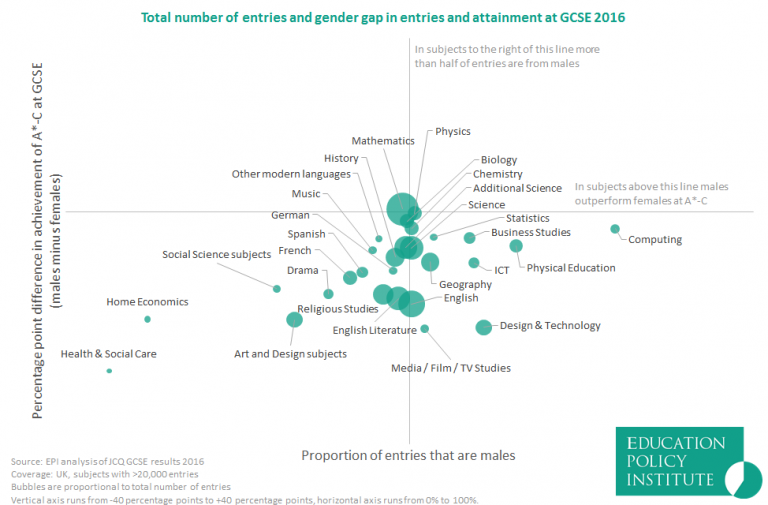
There were no big changes in the gender patterns for GCSE subject choices this year, with girls more likely to enter subjects including art and design and languages, while boys are more likely to choose physical education, ICT or computing and design and technology.
Girls retain their attainment advantage in most subjects, apart from mathematics where boys lead on grades A*-C by less than one percentage point. Girls are 19 percentage points ahead in art and design and 11 percentage points in French.
Regional analysis
EPI’s annual report published earlier this year highlighted the regional disparities that exist across the country. London has shown significant improvement over the past decade – by two-thirds of a grade on average across all GCSE entries.
Today’s GCSE data finds that the gap between London and the rest of the country is still distinct. 70 per cent of pupils in London scored A* – C grades, compared with 64 per cent in Yorkshire and the Humber and the Midlands.
On this measure, overall results fell by the smallest margin in the South East (down 1.5 percentage points) and by the largest margin in the North West (down 3.0 percentage points).